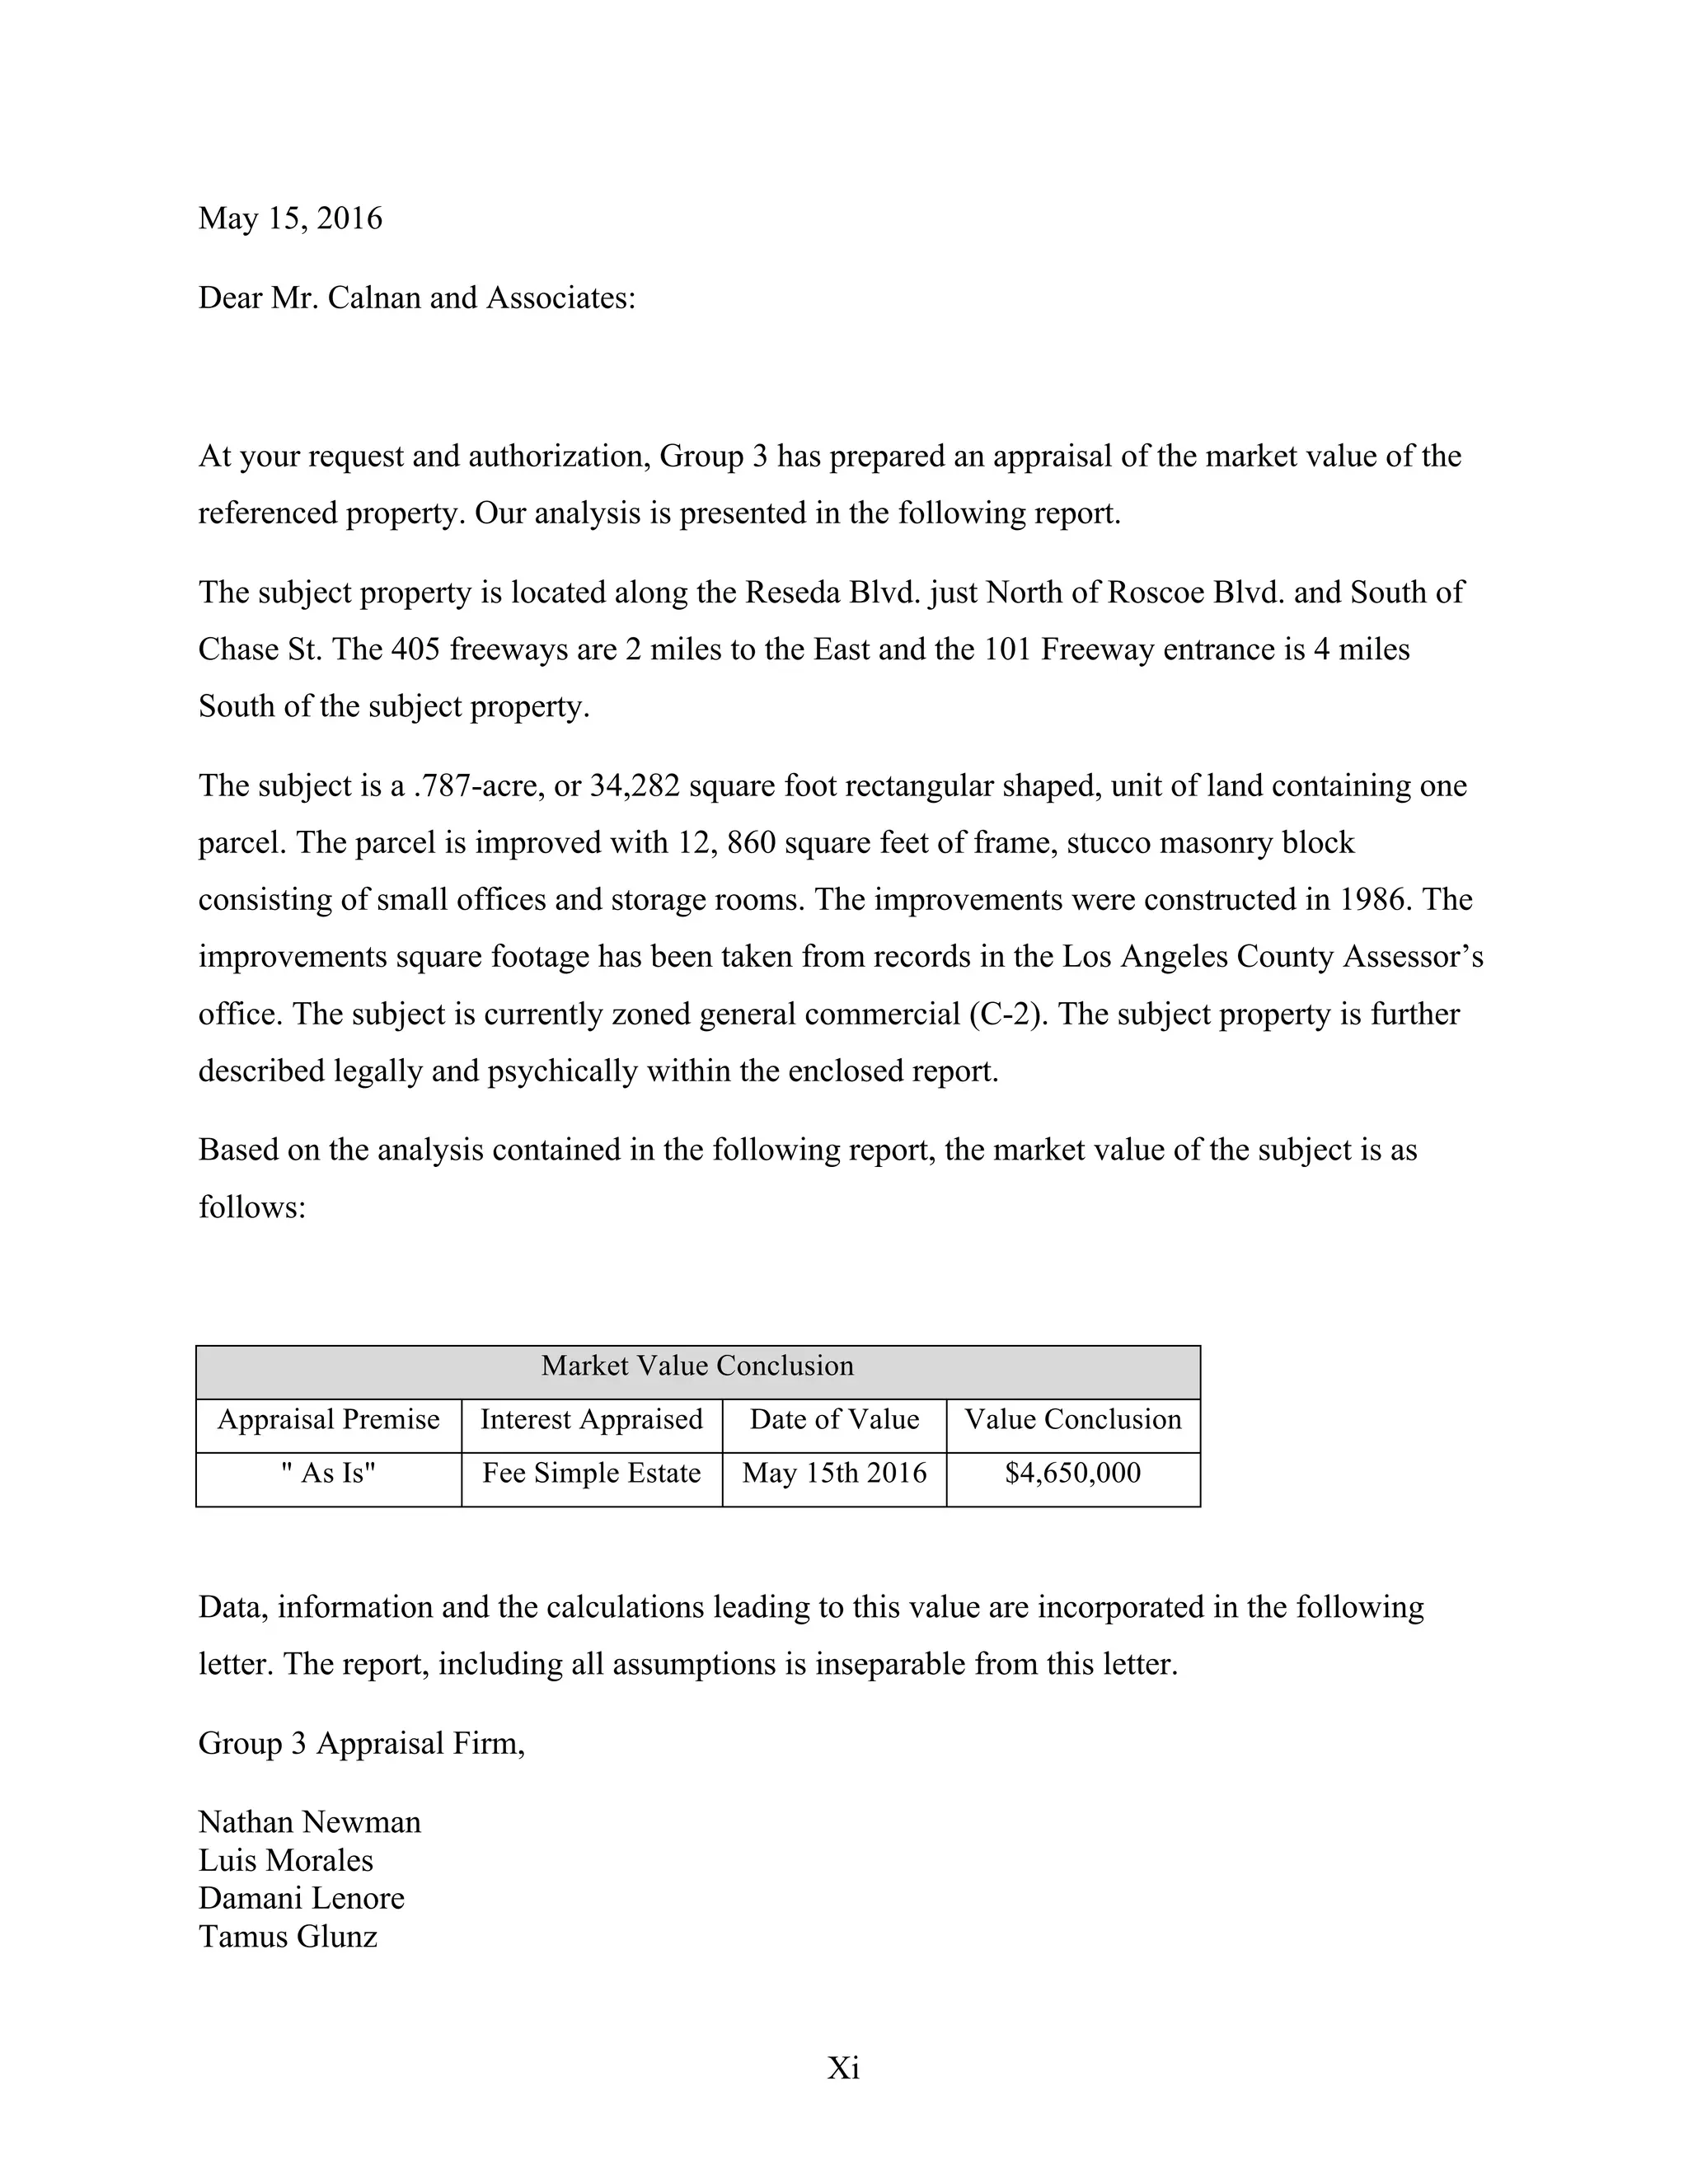
APPRAISAL OF REAL PROPERTY
LOCATED AT:
8330 Reseda Blvd.
Northridge CA, 91324
FOR:
Professor Calnan & Associates
BY:
Nathan Newman
Tamus Glunz
Luis Morales
Damani Lenore
DATE OF VALUTATION:
May 15, 2016
DATE OF INSPECTION:
May 15, 206
DATE OF REPORT:
May 15, 2016
Xi
May 15, 2016
Dear Mr. Calnan and Associates:
At your request and authorization, Group 3 has prepared an appraisal of the market value of the
referenced property. Our analysis is presented in the following report.
The subject property is located along the Reseda Blvd. just North of Roscoe Blvd. and South of
Chase St. The 405 freeways are 2 miles to the East and the 101 Freeway entrance is 4 miles
South of the subject property.
The subject is a .787-acre, or 34,282 square foot rectangular shaped, unit of land containing one
parcel. The parcel is improved with 12, 860 square feet of frame, stucco masonry block
consisting of small offices and storage rooms. The improvements were constructed in 1986. The
improvements square footage has been taken from records in the Los Angeles County Assessor’s
office. The subject is currently zoned general commercial (C-2). The subject property is further
described legally and psychically within the enclosed report.
Based on the analysis contained in the following report, the market value of the subject is as
follows:
Market Value Conclusion
Appraisal Premise Interest Appraised Date of Value Value Conclusion
" As Is" Fee Simple Estate May 15th 2016 $4,650,000
Data, information and the calculations leading to this value are incorporated in the following
letter. The report, including all assumptions is inseparable from this letter.
Group 3 Appraisal Firm,
Nathan Newman
Luis Morales
Damani Lenore
Tamus Glunz
Xii
Table of Contents
Letter of Transmittal………………………………………………………………Xi
Table of Contents………………………………………………………………...Xii
Summary of Salient Data and Conclusion…………………………………………4
Certification………………………………………………………………………..6
Assumptions and Limiting Conditions Introduction……………………………....8
Overview of General Area- Los Angeles City……………………………………19
Overview of Immediate Area……………………………………………………..29
Overview of Market……………………………………………………………….36
Site Analysis……………………………………………………………………....38
Analysis and Data…………………………………………………………………45
Addenda…………………………………………………………………………...66
8330 RESEDA BLVD.
GROUP 3
4	
	
	 	
SUMMARY OF SALIENT DATA AND CONCLUSIONS
Property Type: Multi-Tenant Office Building
Property Location: 8330 Reseda Boulevard, Reseda, CA
Property Type: Two-story office building with two elevators
Purpose of Appraisal: Market Value Estimate
Property Rights: Leased Fee Estate
Date of Valuation: May 15, 2016
Date of Inspection: May 15, 2016
Date of Report: May 15, 2016
Owner of Record: 8330 Reseda Blvd, Northridge LLC
Land Description:
APN: 2786022026
Net Land Area: 34,278.7 SF
Orientation: Total Frontage
Shape: Rectangular
Topography: Flat
Zoning: C2 and P – 1VL, Commercial District
Utilities: Service to utilities
Flood Zone: C 060137 0043C, dated May 5, 1999
Earthquake Zone: 8.4km away from the Northridge fault line
Buildings Description:
Building Area: 12,860 Gross SF / 12,860 Rentable SF
Construction: Steel beam and concrete with brick facing
Building Height: Two-Story Building
Year Built: 1986
Quality/Condition: Good / Good
On-Site Parking: 62 Spaces (4.82 spaces/1,000SF)
Elevator/Staircases: Two Elevators / Two Staircases
Common Area: Parking, Restrooms, and Walkways
8330	RESEDA	BLVD.																																																																																					COMMERCIAL	APPRAISAL	
GROUP 3	 					5


Highest & Best Use:
As If Vacant: Multi Tenant Office Building
As Improved:Multi Tenant Office Building
Exposure Time: 7. 5 months
To find the estimated exposure time of the subject property we first identified what the market
exposure time was. An exposure time is the number of days a property has been on the market
before it was sold. We found 27 comparable properties in the Los Angles country area and
identified the number of days they were on market. We found the average exposure time of these
27 comparable sales to be 222.37 days on market. Based on these findings we believe it will take
about 7 and one half months to sell the subject property.
Extraordinary Assumptions
The Los Angeles County Assessor’s office estimates the gross site area to be .787 acres or
34281.72 square feet. We reserve the right to amend this valuation if subsequent land area survey
indicates a different land area than that which is utilized in this report.1
Hypothetical Conditions
None noted
1
	"ZIMAS."	ZIMAS.	N.p.,	n.d.	Web.	15	May	2016.
8330	RESEDA	BLVD.																																																																																					COMMERCIAL	APPRAISAL	
GROUP 3	 					6


Certification of the Appraisers
We certify:
That we have performed an inspection of the subject property on May 15, 2016 and have
considered all of the pertinent facts affecting the value represented in this appraisal report.
That all market data pertaining to the value estimates has been accumulated from various
sources, where possible, personally examined and verified as to the details, motivations and
validity.
That we have no present or contemplated future interest in the property appraised and neither is
there any personal interest or bias with respect to the subject matter or to the principals involved.
That our analyses, opinions and conclusions were developed, and this report was prepared, in
conformity with the Uniform Standards of Professional Appraisal Practice ("USPAP") and in
accordance with the regulations developed by the Lender's Federal Regulatory Agency as
required by FIRREA.
That our compensation is not contingent upon the reporting of predetermined values or direction
in value that favors the cause of the client, the amount of the value estimate, the attainment of a
stipulated result, or the occurrence of a subsequent event.
That this appraisal assignment was not based on a requested minimum valuation, a specific
valuation or the approval of a loan.
That to the best of our knowledge and beliefs, the statements of fact contained in this report,
upon which the analyses, opinions and conclusions are based, are true and correct, subject to the
Statement of Basic Assumptions and Limiting Conditions herein set forth.
That this appraisal report sets forth all limiting conditions (imposed by the terms of our
assignment of by the undersigned) affecting the analyses, opinions and conclusions expressed.
No one other than the undersigned persons has provided assistance in preparing the report.
8330	RESEDA	BLVD.																																																																																					COMMERCIAL	APPRAISAL	
GROUP 3	 					7


That our analyses, opinions and conclusions were developed, and this report has been prepared,
in conformity with the requirements of the Code of Professional Ethics and the Standards of
Professional Practice of the Appraisal Institute.
This appraisal report has been prepared in its entirety and without bias, in conformity with and
subject to the requirements of the Code of Ethics of the Appraisal Institute. The appraisers are
competent to complete this report in accordance with the competency provision in USPAP.
The use of this appraisal report is subject to the requirements of the Appraisal Institute relating to
review by its duly authorized representatives.
The appraiser has not given consideration to any on-site personal property either owned or leased
by the tenants and/or the owner of the subject property.
This appraisal is a summary report, which is intended to comply with the reporting requirements
set forth under Standards Rule 2-2 (b) of the Uniform Standards of Professional Appraisal
Practice. As such, this report contains summarized documentation and discussion required to
identify and describe the real estate being appraised, as well as a summary description of the
physical and functional characteristics of the property.
Disclosure of the contents of the appraisal report is governed by the bylaws and regulations of
the Appraisal Institute. In furtherance of the arms of the Institute to members, we may be
required to submit authorized committees of said Institute, copies of this report and any
subsequent changes or modifications thereof.
In our opinion, the estimated the Leased Fee “As Is” Market Value of the subject property, which
represents a multi-tenant office building, built in 1986, totaling 12,860 gross square feet, and
12,860 rentable square feet, situated on 34,279 square feet of land, situated at 8330 Reseda
Boulevard in Reseda, as of May 15, 2016 is as follows:
Market Value Conclusion
Appraisal Premise Interest Appraised Date of Value Value Conclusion
" As Is" Fee Simple Estate May 15th 2016 $4,650,000
8330	RESEDA	BLVD.																																																																																					COMMERCIAL	APPRAISAL	
GROUP 3	 					8


Assumptions and Limiting Conditions
1. No responsibility is assumed for legal descriptions or for matters including legal or title
consideration. Title to the property is assumed to be good and marketable unless
otherwise stated.
2. The property is appraised as though free and clear of any or all liens or encumbrances
unless otherwise stated.
3. Unless otherwise stated in this report, the existence of hazardous material, which may or
may not be present on the property, was not observed by the appraisers. The appraiser is
not qualified to detect such substances. The presence of substances, such as asbestos,
urea-formaldehyde foam insulation, or other potentially hazardous materials may affect
the value of the property. The value estimates are predicated on the assumption that there
is no hazardous materials on or in the property exist that would cause a loss in value. The
subject site is assumed to be free and clear of the same.
4. Please understand that we are not experts in the toxic/hazardous substance field. While
every effort has been made to observe and potential toxic waste hazards, we are not
qualified to make a determination as to their existence. If any hazards exist and the costs
to cure these toxic problems have been estimated, these costs should be deducted from
the final value estimate in this report. We have appraised the subject site free of any
toxic/hazardous materials.
5. Rentable square footage information for the subject property improvements is based on
information provided by the property owner via a current rent roll. Land and gross
building square footage information is based upon information obtained in public records
from the Los Angeles County Assessor. We have deemed all information with regards to
the physical measurements as accurate and correct.
6. Responsible ownership and competent property management are assumed.
7. It is assumed that there is full compliance with all-applicable federal, state and local
environmental regulations and laws unless noncompliance is stated, defined and
considered in the appraisal report.
8330	RESEDA	BLVD.																																																																																					COMMERCIAL	APPRAISAL	
GROUP 3	 					9


8. It is assumed that all applicable zoning and use regulations and restrictions have been
complied with, unless nonconformity has been stated, defined and considered in the
appraisal report.
9. It is assumed that all required licenses, certificates of occupancy, consents, or other
legislative or administrative authority from any local, state or national government or
private entity or organization have been or can be obtained or renewed for any use on
which the value estimate contained in this report is based.
10. The information furnished by others is believed to be reliable. No warranty is expressed
or implied as to its accuracy.
11. The allocations of the total valuation between land and improvements (if any), applies
only under the program of utilization stated in this report. Our reported market value is
for the total property as appraised and no attempt has been made to evaluate any
fractional interests, should they exist.
12. All engineering is assumed to be correct. The plot plans and illustrative material in this
report are included only to assist the reader in visualizing the property.
13. It is assumed that there are no hidden or unapparent conditions of the property, subsoil, or
structures that render it more or less valuable. No responsibility is assumed for such
conditions or for arranging engineering studies that may be required to discover them.
14. It is assumed that the utilization of land and improvements is within the boundaries of
property lines of the property described and that there is no encroachment or trespass
unless noted in the report.
15. Statement of Policy - The following statement represents official policy of the Appraisal
Institute with respect to neighborhood analysis and the appraisal of real estate:
a. It is improper to base a conclusion or opinion of value upon the premise that the
racial, ethnic or religious homogeneity of the inhabitants of an area or of a
property is necessary for maximum value.
b. Racial, religious, and ethnic factors are deemed unreliable predictors of value
trends or price variance.
c. It is improper to base a conclusion or opinion of value, or a conclusion with
respect to neighborhood trends, upon stereotyped or biased presumptions relating
to race, color, religion, sex, or national origin or upon unsupported presumptions
8330	RESEDA	BLVD.																																																																																					COMMERCIAL	APPRAISAL	
GROUP 3	 					10


relating to the effective age or remaining life of the property or the life expectancy
of the neighborhood in which it is located.
16. We have not reviewed a current preliminary title report, for the subject property.
However, based upon our inspection of the subject property, we are of the opinion that
there are no negative encroachments or other special hazards that might adversely affect
the utility or marketability of the subject property. The only encroachments found were
normal utility easements and access easements. The subject is assumed to be free and
clear of the same of any potential encumbrances, which may negatively impact the
subject property.
17. Flood maps used by the appraisers are issued by the National Flood Insurance Program;
the appraisers have no responsibility as to the accuracy of these maps. The owner or
lender should be aware of the potential for flooding in low lying areas and the
responsibility to purchase flood insurance if needed for the protection of the property.
18. The subject site lies in an area of very frequent geological activity, particularly
earthquakes, along with an overwhelming majority of Southern California. As such,
earthquakes can occur at the subject's location at any time. The possible future effect of
earthquake damage to the subject property has not been considered in the values set forth
in this report, except as measured by comparable sales of properties that may be subject
to the same hazard.
19. This report assumes the condition of the subject property has not changed from the date
of inspection to the date of our valuation.
20. This appraisal report has been made with the following general limiting conditions:
a. The distribution, if any, of the total valuation in this report between land and
improvements applies only under the stated program of utilization. The separate
allocations for land and buildings must not be used in conjunction with any other
appraisal and are invalid if so used.
b. Possession of this report, or a copy thereof, does not carry with it the right to
publication. It may not be used for any purpose by any person other than the party
to whom it is addressed without the consent of the appraiser, and in any event
only with proper written qualification and only its entirety.
8330	RESEDA	BLVD.																																																																																					COMMERCIAL	APPRAISAL	
GROUP 3	 					11


c. The appraisers herein by reason of this appraisal are not required to give further
consultation, testimony, or be in attendance in court with reference to the property
in question unless arrangements have been previously made.
d. Neither all of any part of the contents of this report (especially any conclusions as
to value or the identity of the appraiser) shall be disseminated to the public
through advertising, public relations, news, sales, or other media without the prior
written consent and approval of the appraiser.
e. The liability of the appraisers is limited to the client only and to the fee actually
received by the appraiser. Further, there is no accountability, obligation or
liability to any third party. If this report is placed in the hands of anyone other
than the client, the client shall make such party aware of all limiting conditions
and assumptions of the assignment and related discussion. The appraisers are in
no way to be responsible for any costs incurred to discover or correct any
deficiencies of any type present, physically, financially and/or legally.
21. The Americans with Disabilities Act (ADA) became effective January 26, 1992. We
have not made a specific compliance survey and analysis of the subject property to
determine whether or not they are in conformity with the various detailed requirements of
the ADA. It is possible that a compliance survey of the properties, together with a
detailed analysis of the requirements of the act, could reveal that the properties are not in
compliance with one or more of the requirements of this act. The appraisers, however,
are not qualified to determine such requirements or conditions. The value estimates
provided in this appraisal report are predicated on the assumption that there are no
characteristics of the properties, which would cause a loss in value due to a failure or
comply with the Americans with Disabilities Act (ADA). No responsibility is assumed
for any such conditions, or any expertise or engineering/architectural knowledge, which
may be required to discover them.
22. In this appraisal report, we have utilized two of the three traditional approaches to value,
the Sales Comparison Approach and the Income Capitalization Approach. The Cost
Approach was not utilized for the following reasons:
a. The Cost Approach is predicated on the assumption that the market value of the
subject property is equivalent to the land value plus current construction costs less
8330	RESEDA	BLVD.																																																																																					COMMERCIAL	APPRAISAL	
GROUP 3	 					12


depreciation, which is not always reliable, since the estimation of depreciation is
subjective.
b. The Cost Approach is not intrinsically suited to render an opinion of value for
investment properties, since construction costs plus land are not always equivalent
to market value.
c. The omission of the Cost Approach, when appraising an investment property such
as the subject property, does not result in a misleading value estimate. The Cost
Approach is typically not relied upon by investors and buyers in the marketplace;
the Sales Comparison Approach and the Income Capitalization Approach are the
traditional approaches utilized in the marketplace.
Introduction
Identification of the Property
The subject property represents a multi-tenant office building, situated at 8330 Reseda Boulevard
in Reseda, California. The subject property includes a multi-tenant office building, built in 1986.
The improvements are two-stories in height and total 12,860 gross and 12,860 rentable square
feet; the improvements are situated on 34,279 SF of commercial land with 62 on-site parking
spaces (4.82 spaces per 1,000 SF of building area).
As of the date of valuation, the subject property was 100% occupied.
Purpose of the Report
The purpose of this report is to estimate the “As is” market value, as of May 15, 2016.
Intended Users
The appraisal is for the use of Professor Calnan and his partners. The purpose of this appraisal is
to determine the true market value of this property in pursuit of a real estate loan. The appraisal
will calculate the market value of the property located at 8330 Reseda Blvd. Northridge, CA
8330	RESEDA	BLVD.																																																																																					COMMERCIAL	APPRAISAL	
GROUP 3	 					13


91324. The intended use of this property is multiple tenant offices. The appraisal date is the same
day of inspection, May 10th 2016.
Property Rights Appraised
The property rights appraised in the context of this appraisal will be the leased fee estate.
Leased Fee Estate defined as the full ownership interest held by the lessor regardless of the
duration of the lease or of the specified rent.2
Historic Ownership Information
The subject property is currently held by 8330 Reseda Blvd LLC. The property is not available
for sale and has not been sold or transferred within the last five years. 8330 Reseda Blvd. LLC
acquired this property in 1986
Scope of the Report
The scope of this report included the process of data gathering, data analysis and valuation.
Data Gathering
The data-gathering phase of this assignment included interviews with employees with the
Planning and Building & Safety Departments of the City of Los Angeles, real estate brokers and
developers specializing in office buildings and investment properties in the region.
Documents pertaining to the appraisal assignment such as a site plan, grant deeds, assessor plat
maps, existing rent roll and other pertinent documentation related to the subject property were
also gathered and analyzed.
The subject property was inspected on May 15, 2016 to gather data concerning the physical
features, as well as surrounding neighborhood influences. Rentable square footage information
for the subject property improvements is based on information provided by the property owner
2
	The	Appraisal	of	Real	Estate.	13th	ed.	N.p.:	Appraisal	Institute,	n.d.	Print.
8330	RESEDA	BLVD.																																																																																					COMMERCIAL	APPRAISAL	
GROUP 3	 					14


via a current rent roll. Land and gross building square footage information is based upon
information obtained in public records from the Los Angeles County Assessor. We have deemed
all information with regards to the physical measurements as accurate and correct.
Discussions with agents and property owners in the immediate area were conducted to obtain
positive and negative influences, market trends, land, sales and rent comparables. Such
comparables were also gathered from sources such as Costar Group Inc., Axiom, First American
and real estate agents active in the general area. Those comparables considered most appropriate
were identified and verified by discussions with individuals involved in the transaction (owner,
buyer, seller, or broker). Hence, information regarding the subject, the general area, and its
neighborhood have been collected and analyzed to determine the subject's highest and best use as
if vacant, and as improved.
Data Analysis: Initially, overall factors relating to interest rates, employment and demographics
were explored and encompasses in the overall valuation process. Market data, sales, and rentals
were adjusted for physical and locational equivalence to the subject thereby developing
indications for market value via the Sales Comparison and Income Capitalization Approaches.
Valuation
This appraisal report utilizes the two of the three traditional approaches to value, which are
summarized below, but also discussed in greater detail in the Appraisal Methodology section of
this report. The Cost Approach was not utilized for the following reasons:
• The Cost Approach is predicated on the assumption that the market value of the subject
property is equivalent to the land value plus current construction costs less depreciation,
which is not always reliable, since the estimation of depreciation is subjective.
• The Cost Approach is not intrinsically suited to render an opinion of value for investment
properties, since construction costs plus land are not always equivalent to market value.
• The omission of the Cost Approach, when appraising an investment property such as the
subject property, does not result in a misleading value estimate. The Cost Approach is
typically not relied upon by investors and buyers in the marketplace; the Sales
Comparison Approach and the Income Capitalization Approach are the traditional
approaches utilized in the marketplace.
8330	RESEDA	BLVD.																																																																																					COMMERCIAL	APPRAISAL	
GROUP 3	 					15


Sales Approach: Includes the valuation of the subject property, via an analysis of
comparable buildings, which have sold in the subject’s general area.
Income Approach: Valuation of the subject property based on the existing improvements
through direct capitalization analysis. This analysis includes estimates of
annual rents, vacancy and collection loss rate, operating expenses, and the
capitalization of the property’s annual operating income by a market
derived overall capitalization rate. We have also performed a discounted
cash flow analysis on the subject property.
Property Rights Appraised
The property rights appraised consist of the Leased Fee Estate of the subject property. A leased
Fee Estate3
is defined as an estate in which the owner of the building has given up the right to
occupy. A Leased Fee Interest represents the landlord’s rights. These rights are affected by the
lease rate, term, and any other conditions stipulated in the lease document.
Historic and Current Ownership
8330 Reseda Blvd, Northridge LLC, owns the subject property. To our best knowledge, the
subject property is not available for sale and has not been sold or transferred within the past five
years.
Exposure Time / Marketing Period
The Uniform Standards of Professional Appraisal Practice requires an analysis of exposure
period. According to the Dictionary of Real Estate Appraisal, Third Edition, published by the
Appraisal Institute, exposure time* is defined as:
" The time a property remains on the market. The estimated length of time the property
interest being appraised would have been offered on the market prior to the hypothetical
consummation of a sale at market value on the effective date of the appraisal; a retrospective
estimated based upon an analysis of past events assuming a competitive and open market.
Exposure time is always presumed to occur prior to the effective date of the appraisal. The
overall concept of reasonable exposure encompasses not only adequate, sufficient and
3
8330	RESEDA	BLVD.																																																																																					COMMERCIAL	APPRAISAL	
GROUP 3	 					16


reasonable time, but also adequate, sufficient and reasonable effort. Exposure time is different
for various types of real estate and value ranges and under various market conditions.”
According to the Dictionary of Real Estate Appraisal, Third Edition, published by the
Appraisal Institute, marketing period* is defined as:
" The time is takes an interest in real property to sell on the market subsequent to the
date of an appraisal. It is an estimate of the amount of time it might take to sell an interest in
real property at its estimated market value during the period immediately after the effective date
of appraisal; the anticipated time required to expose the property to a pool of prospective
purchasers and to allow appropriate time for negotiation, the exercise of due diligence, and the
consummation of a sale at a price supportable by concurrent market conditions.”
Glossary of Terms
Assessed Value- Assessed value applies in ad valorem taxation and refers to the value of a
property according to the tax rolls. Assessed value may not conform to market value, but it is
usually calculated in relation to a market value base4
Effective Rent- The rental rate net of financial concessions such as periods of no rent during the
lease term; may be calculated on a discounted basis, reflecting the time value of money, or on a
simple, straight-line basis.5
Extraordinary assumption- An assumption directly related to a specific assignment, which, if
found to be false, could alter the appraiser’s opinions or conclusions. Extraordinary assumptions
presume as fact otherwise uncertain information about physical, legal, or economic
4
The	Property	(Ad	Valorem)	Tax	-	FindLaw."	Findlaw.	N.p.,	n.d.	Web.	15	May	201	
5
	TheFreeDictionary.com.	N.p.,	n.d.	Web.	15	May	2016.
8330	RESEDA	BLVD.																																																																																					COMMERCIAL	APPRAISAL	
GROUP 3	 					17


characteristics of the subject property; or about conditions external to the property such as
market conditions or trends; or about the integrity of data used in an analysis
Fee simple estate - Absolute ownership unencumbered by any other interest or estate, subject
only to the limitations imposed by the governmental powers of taxation, eminent domain, police
power, and escheat.6
Going Concern Value- Going concern value is the value of a proven property operation. It
includes the incremental value associated with the business concern, which is distinct from the
value of the real estate only. Going concern value includes an intangible enhancement of the
value of an operating business enterprise, which is produced by the assemblage of the land,
building, labor, equipment, and marketing operation. This process creates an economically viable
business that is expected to continue. Going concern value refers to the total value of a property,
including both real property and intangible personal property attributed to the business value.7
Hypothetical Condition - That which is contrary to what exists but is supposed for the purpose
of analysis. Hypothetical conditions assume conditions contrary to known facts about physical,
legal, or economic characteristics of the subject property; or about conditions external to the
property, such as market conditions or trends; or about the integrity of data used in an analysis.
See also extraordinary assumption.8
Investment Value- the value of an investment to a particular investor based on his or her
investment requirements. In contrast to market value, investment value is. Value to an individual,
6
	TheFreeDictionary.com.	N.p.,	n.d.	Web.	15	May	2016.	
7
	Real	Estate	Terms,	Definitions	and	Dictionary."	In	Plain	English.	N.p.,	n.d.	Web.	15	May	2016.	
8
	Real	Estate	Terms,	Definitions	and	Dictionary."	In	Plain	English.	N.p.,	n.d.	Web.	15	May	2016.
8330	RESEDA	BLVD.																																																																																					COMMERCIAL	APPRAISAL	
GROUP 3	 					18


not value in the marketplace. Investment value reflects the subjective relationship between a
particular investor and a given investment.9
Leased fee estate - An ownership interest held by a landlord with the right of use and occupancy
conveyed by lease to others. The rights of the lessor (the leased fee owner) and the leased fee are
specified by contract terms contained within the lease.10
Market Rent - The most probable rent that a property should bring in a competitive and open
market reflecting all conditions and restrictions of the specified lease agreement including term,
rental adjustment and revaluation, permitted uses, use restrictions, and expense obligations.11
Market Value - Market value is differentiated from other types of value in that it is created by
the collective patterns of the market. Market value means the most probable price which a
property should bring in a competitive and open market under all conditions requisite to a fair
sale, the buyer and seller each acting prudently and knowledgeably, and assuming the price is not
affected by undue stimulus.12
Use Value - Use value is a concept based on the productivity of an economic good. Use value is
the value a specific property has for a specific use. Use value focuses on the value the real estate
contributes to the enterprise of which it is a part, without regard to the property’s highest and
best use or the monetary amount that might be realized upon its sale.13
9
	Rattermann,	Mark.	The	Student	Handbook	to	the	Appraisal	of	Real	Estate,	13th	Edition.	Chicago:	Appraisal	Institute,	2009.	
Print.	
10
	Rattermann,	Mark.	The	Student	Handbook	to	the	Appraisal	of	Real	Estate,	13th	Edition.	Chicago:	Appraisal	Institute,	2009.	
Print.	
11
	TheFreeDictionary.com.	N.p.,	n.d.	Web.	15	May	2016.	
12
	Real	Estate	Terms,	Definitions	and	Dictionary."	In	Plain	English.	N.p.,	n.d.	Web.	15	May	2016.	
13
	The	Property	(Ad	Valorem)	Tax	-	FindLaw."	Findlaw.	N.p.,	n.d.	Web.	15	May	201
8330	RESEDA	BLVD.																																																																																					COMMERCIAL	APPRAISAL	
GROUP 3	 					19


LA County Overview
Los Angeles County spans over 4,000 square miles and is home to over 10 million people. Over
the past years LA County has experienced an increase in population, mean income, migration,
number of college graduates, and a decrease in its unemployment rate.
Population
Los Angeles County over the past years has had on average a population size of about 10 million
individuals. With an average population change of about 0.73 percent year over year. Spanning
over 4,000 miles in size this gives LA County a population density of around 2,500 individuals
per square mile.14
14
	"Census.gov."	Census.gov.	N.p.,	n.d.	Web.	13	Mar.	2016.
8330	RESEDA	BLVD.																																																																																					COMMERCIAL	APPRAISAL	
GROUP 3	 					20


The preceding chart illustrates the trend in population for LA County. The chart describes an
upward trend in population numbers for LA County. From the beginning point of the year 2000
LA County population stood at 9.54 million individuals. At the end year of 2014 the population
stood at 10.12 million individuals, an overall 6 percent change from 2000 to 2014. Taking into
account that populations are not static and move from place to place the net migration of the LA
County population was taken into consideration and the following was found.
On average over a six-year period, from 2010-2015, a net migration of 5,312 individuals left LA
County. Of those who left, the vast majority moved to neighboring Counties such as San
Bernardino and Ventura County. From 2010 to 2015 a total of 40,819 individuals left LA county.
LA County has seen an influx of migrants from 2013-2015, totaling 8,948 individuals.15
To
better represent these findings the following is offered:
15
	"Census.gov."	Census.gov.	N.p.,	n.d.	Web.	13	Mar.	2016.	
	
9.5	
9.6	
9.7	
9.8	
9.9	
10	
10.1	
10.2	
1998	 2000	 2002	 2004	 2006	 2008	 2010	 2012	 2014	 2016	
Popula[on	in	Millions	
Year	
LA	County	Popula[on
8330	RESEDA	BLVD.																																																																																					COMMERCIAL	APPRAISAL	
GROUP 3	 					21


To better understand this net migration during its peak in 2006 (not represented in the date
above) about 141,000 individuals opted to leave LA County during the height of the real estate
market collapse. The goal here is to show the recovery or the positive influx of individuals into
LA County, signifying a steady recovery.
Education
LA County is dense with institutions dedicated to higher learning. Out of the 10 million
individuals residing in LA County the median age is 35 years old and has been steadily
increasing over the past five years. In terms of education, the vast majority of individuals that
hold a bachelor’s degree or higher tend to be around the age of 25-44; Accounting for about 66
percent of the total bachelor degrees or higher. Indicating that most of the young individuals that
reside within the county hold a degree of higher education. Establishing a base for highly skilled
and qualified individuals, from which to build a labor force from.
2010	 2011	 2012	 2013	 2014	 2015	
Net	Migra[on	 (18,621)	 (14,447)	 (7,751)	 1,671		 3,305		 3,972		
	(20,000)	
	(15,000)	
	(10,000)	
	(5,000)	
	-				
	5,000		
	10,000		
Number	of	Migrants	
Net	Migra1on
8330	RESEDA	BLVD.																																																																																					COMMERCIAL	APPRAISAL	
GROUP 3	 					22


Employment Statistics
LA County consists of a vast geographical area that can accommodate a diverse set of industries.
Since 2010 the health care industry has been one of the largest employers in LA County,
followed by government agencies, and leisure and hospitality. The health care industry from
2010-2014 has accounted for an average employment number of about 564,000 individuals and
had an increase of 4.09 percent in employment numbers during that time. Government workers
have accounted for 560,000 individuals of the total workforce from 2010-2014, but the
government sector has experienced a 1.4 percent decrease in its employment numbers over the
same time period. Leisure and Hospitality has employed an average of 416,000 workers over
2010-2014 and has experienced a 3.8 percent increase in employment rate during that period of
time.16
16
	Los	Angeles."	U.S.	Bureau	of	Labor	Statistics.	U.S.	Bureau	of	Labor	Statistics,	n.d.	Web.	10	Mar.	2016.	
	
0.0%	
5.0%	
10.0%	
15.0%	
20.0%	
25.0%	
30.0%	
35.0%	
40.0%	
18-24	 25-34	 35-44	 44-64	 65<	
	Percent	Scale	
Age	Group	
4	Year	Degree	or	Higher	
percentage
8330	RESEDA	BLVD.																																																																																					COMMERCIAL	APPRAISAL	
GROUP 3	 					23


Throughout 2010 and 2014, LA County has experienced both gains and losses in employment
numbers in its major industries. The chart above illustrates the trend among the largest
employers in LA County.
The construction sector saw the largest gain in employment during the 2010-2014-time period,
increasing an average of 4.55 percent. The second largest growth in employment was in the
admin & support sector, which saw an increase of 4.35 percent. Lastly the natural resources
sector increased its employment rate by 4.1 percent. Manufacturing nondurable, government, and
manufacturing saw the largest decreases in employment rates. During the 2010-2014-time period
these sectors lost on average 1.77 percent, 1.42 percent, and 1.27 percent in employment rates.17
In terms of unemployment, no are A was left unaffected by the real estate market collapse of
2007-2008. LA County saw its highest unemployment rates and it also saw its highest migration
rates out of LA County. The following chart illustrates the LA County unemployment rate during
this 2000-2014 period:
17
	"U.S.	Bureau	of	Labor	Statistics."	U.S.	Bureau	of	Labor	Statistics.	U.S.	Bureau	of	Labor	Statistics,	n.d.	Web.	13	
Mar.	2016.	
0	
100	
200	
300	
400	
500	
600	
700	
Jobs	in	Thousands	
Industries	
2010	
2011	
2012	
2013	
2014
8330	RESEDA	BLVD.																																																																																					COMMERCIAL	APPRAISAL	
GROUP 3	 					24


From the year 2000 up until 2010 the unemployment rate increased by an average rate of 174
percent. Since its peak, the unemployment rate has exhibited a decreasing trend, with its largest
drop of about 17 percent occurring during 2012-2013.
Household Income Forecast
LA County over the past five years has seen a 0.77 percent increase in household income
annually. The most current figure puts LA County’s average income at around $82,000.
Throughout 2010-2014, LA County has seen an increase of about 3 percent in its mean income.
0	
2	
4	
6	
8	
10	
12	
14	
1998	 2000	 2002	 2004	 2006	 2008	 2010	 2012	 2014	 2016	
Unemployment	Rate	
Year	
Los	Angeles	County		
Unemployment	Rate
8330	RESEDA	BLVD.																																																																																					COMMERCIAL	APPRAISAL	
GROUP 3	 					25


Area Development
When observing residential and nonresident housing permits, a positive trend can be found that
depicts the number of housing permits issued has been on a rise. On average, the number of
housing permits issued has been on a rise with an average increase of 27 percent annually. The
largest increase of housing permits occurring during 2012-2013, with an average increase of
about 57 percent.
During 2013, 16,850 housing permits were issued compared to 10,709 housing permits issued in
2012. Nonresidential building permits have also seen an increase on average of 41 percent
annually. The highest annual increase of about 133 percent occurred during 2012 and 2013.
1,836 nonresidential housing permits were issued in 2012 and over 4,000 nonresidential housing
permits were issued in 2013.18
18
"Los Angeles County Building and Safety." Los Angeles County Building and Safety. N.p.,
n.d. Web. 13 Mar. 2016.
	
$79,500	
$80,000	
$80,500	
$81,000	
$81,500	
$82,000	
$82,500	
2009	 2010	 2011	 2012	 2013	 2014	 2015	
Income	
Year	
LA	County	Mean	Income
8330	RESEDA	BLVD.																																																																																					COMMERCIAL	APPRAISAL	
GROUP 3	 					26


Government Influences
Governmental influences are factors that are used to evaluate governmental controls and
regulations, zoning requirements, and determining the value of a property. The Los Angeles
County was established on February 18, 1850. It is one of the largest in the nation, accounting
for approximately 27% of the California population. A five-member board of Supervisors makes
up the County that was created by the State Legislature in 1852. Voters in Los Angeles County
elect the board as well as an Assessor, District Attorney, and Sheriff. As a Subdivision of the
state, the county is charged with providing numerous services that affects the lives of all the
residents.”19
More than 65% of Los Angeles County is unincorporated with roughly 1 million people living in
those areas. The Board is their city council and the supervisor representing the area is the mayor.
The remaining 35% are incorporated within 88 cities each with its own council20
Crime Report
After more than a decade of decline, violent crime in Los Angeles increased more than 20%
during the first half of 2015, with felony assaults up 26% and robberies up 19%.21
Climate
The Los Angeles area has a Subtropical Mediterranean climate.22
The temperature has increased
over the years, which has led to the current drought California is in. The Los Angeles area, along
with all of California, is facing serious drought issues for the last 5 years. As of April 1, 2015 the
California Governor Jerry Brown imposed a mandatory 25% statewide water reduction and
prohibited water uses.23
19
	“Government.”	Los	Angeles	County.	N.p.,	n.d.	Web	11	Mar.	2016	
20
	“Los	Angeles	County	Department	of	Regional	Planning.”	DRP	Main	RSS.	N.p.,	n.d.	Web	11	Mar.	2016	
21
	“Los	Angeles	Times”	August	27
th
	2015	
22
	“Historical	Weather	for	Los	Angeles,	CA,	United	States	of	America”,	Weatherbase.com.	
23
	“Water	conservation	Portal	–	Emergency	conservation	Regulation.”	State	Water	Resources	Control	Board.	Sept.	
16,	2015
8330	RESEDA	BLVD.																																																																																					COMMERCIAL	APPRAISAL	
GROUP 3	 					27


According to the Western Regional Climate center, the Los Angeles area gets about 15 inches of
rain each year on average.24
The average rainfall is dependent on what happens in the Pacific
Ocean, located on the southern and western part of the Los Angeles area. As an example, if the
Pacific Ocean experiences El Niño conditions, then it has the capability of raining a lot.
However, if it doesn’t experience anything like this, then the Los Angeles area will rarely see
rainfall for the winter. On average, the temperature on the southern part of the Los Angeles area
and at the beach will be 2° to 7° F cooler compared to the city and county.
The highest recorded temperature in Los Angeles was 113° (45°𝐶) on September 27, 2010. The
lowest was 24°𝐹 (−4°C) on December 22, 1944. In 1932, 2 inches (5cm) of snow fell in
downtown LA.25
Los Angeles City/County Energy & GHG
LA County has one of the lowest per-capita energy uses in the nation. Renewable energy comes
primarily from wind (>10%) and geothermal (5%) and utilities serving 98% of the county
population exceeded the 20% renewable energy standard for 2013.
Los Angeles Count GHG emissions are 30% higher than cities with comparable energy use. Coal
energy is still prevalent – Azusa, Pasadena, & LADWP get 42% of their energy from coal and
solar power represents less than 1% of the renewable energy sources for LA County utilities.
Los Angeles County Air Quality
Estimated carcinogenic risk from air toxics has dropped by 65% between 2005-2013. Since
2009, LA County has consistently met air standards for NO2, SO2, CO and lead and air
emissions from Exide (now closed) and Quemetco have been reduced due to enforcement actions
Nearly all areas of LA County experienced ozone standards in 2013. Fine particle pollution
standards were exceeded in downtown LA and the San Fernando Valley in 2013.Highest cancer
24
	Baeder,	Ben.	“History	Shows	California	Subject	to	Extreme	Droughts.”	History	Shows	California	Subject	to	
Extreme	Droughts.	Whittier	Daily	News,	Feb	15,	2014.	
25
	Malloy,	Betsy.	“Los	Angeles	Weather	and	Climate.”	About.com	Travel.	Web	13	Mar.2016
8330	RESEDA	BLVD.																																																																																					COMMERCIAL	APPRAISAL	
GROUP 3	 					28


risk areas from diesel particulate matter are near ports and transportation corridors and emissions
of toxic air contaminants from industrial facilities have increased since 2009.26
Waste Production Analysis
Total municipal waste generated by the County has generally decreased since 2005. All cities in
LA County have successful solid waste diversion programs as required by Cal Recycle. All LA
County jurisdictions appear to have met heir population-based per capita disposal targets for
2013.
Total hazardous waste generated in LA County in 2013 was 2.2 million tons, >2x as much as in
2011. There is a lack of County-level data on actual quantities and final disposition of municipal
waste diverted from landfills. Contaminated soils from site cleanup comprised the majority
(68%) of hazardous waste in 2013.
Los Angeles City/County Ecosystem Health Grade
There are 41,807 acres of marine protected areas in LA County. There are 886,443 acres of
protected lands in LA County. 34% of the total County land area. An additional 8% of County
land is regulated to limit use or development.
Over 35,000 acres of land are at high risk of vegetation type change due to over-burning. LA
County has lost 96% of its total estuarine wetland area from 1850 to the present. Lows in
greenness values since 2013 indicate vegetation is experiencing extreme water stress due to the
drought. Urban streams throughout the County exhibit very poor function and poor biological
condition.
Los Angeles City/County Water
No substantial violations of sewage treatment plant or industrial wastewater permits over the last
5 years. Nearly everyone in Los Angeles County has access to clean drinking water. 90% of
26
"Protecting the Health of Residents." South Coast Air Quality Management District. N.p., n.d.
Web. 13 Mar. 2016.
8330	RESEDA	BLVD.																																																																																					COMMERCIAL	APPRAISAL	
GROUP 3	 					29


beaches received A or B grades for Summer 13 dry weather water quality. Between 2000-2013,
LA County per capita water demand dropped by 16%.
Contamination of groundwater wells is prevalent countywide. One or more pollutants impair
more than 85% of LA County waterways. Los Angeles County imports 58% of its water. 40% of
LA County beaches received on F grade for 2013-14 wet weather water qualities.27
Los Angeles County Conclusion
The Los Angeles County has a population size over 10 million people and is on the incline,
making up 27% of California population. The median age in the Los Angeles County is around
the age 35. Since 2010 the health care industry has been one of the biggest employers in the Los
Angeles County accounting 564,000 individuals. The Los Angeles area is having an incline of
nonresidential distribution of permits going from 1,836 in 2012 to over 4,000 in 2013
Location Analysis
The subject being evaluated is located in the city of Northridge, in Los Angeles County and in
the state of California. It is necessary to examine Los Angeles County and Los Angeles City
economies for a greater understanding of the dynamic impact on the subject property.
27
"Department of Public Health." Department of Public Health. N.p., n.d. Web. 13 Mar. 2016.
8330	RESEDA	BLVD.																																																																																					COMMERCIAL	APPRAISAL	
GROUP 3	 					30


Los Angeles Area
Los Angeles is the second largest city in the United States and has a wide array of industries in
which no one sector dominates the area. Some of the leading industries include business
management services, international trade, motion picture, and technology companies. The
unemployment rate of the Los Angeles metropolitan area was 5.3% in November 2015, which
compares to 7.2% in November 2014 and 8.2% in November of 2013.28
City Household Income
The city of Los Angeles has a large percentage of the population making a household income of
less than 50 thousand per year. The median household income for the City of Los Angeles is
$50,544. This figure is slightly less than the California median household income of $61,514 per
year.29
Los	Angeles."	U.S.	Bureau	of	Labor	Statistics.	U.S.	Bureau	of	Labor	Statistics,	n.d.	Web.	10	Mar.	2016	
29
	"Census.gov."	Census.gov.	N.p.,	n.d.	Web.	13	Mar.	2016.
8330	RESEDA	BLVD.																																																																																					COMMERCIAL	APPRAISAL	
GROUP 3	 					31


Environmental Forces
The Los Angeles City transportation network is dominated by an elaborate freeway system. The
major East and West traveling freeways are the Ventura Freeway 134, Hollywood Freeway US
101, Pomona Freeway 60, Century Freeway Interstate 105 and State Highway 91. The North
and South traveling routes include the San Diego Freeway Interstate 405, Interstate 5,
Pasadena/Harbor Freeway 110, Long Beach Freeway 710 and San Gabriel River Freeway 605.
On average it takes citizens 29.3 minutes to travel to work under normal conditions. The Los
Angeles department of transportation is in the process of completing a 30 year blueprint for
growth related congestion and pollution. The mobility 2035 plan will add 40 miles of bike lanes
along major streets within Los Angeles City limits.30
Public Rail Transportation
Rail freight is provided by numerous carriers and is available throughout Los Angeles County
and City. All commuter rail lines use Union Station Los Angeles as their hub. Los Angeles city
is 3rd
in the nation for public transit usage of cities nationwide. Constant growth will set an
30
	"Los	Angeles	Department	of	Transportation."	Getting	Around	LA	:	Department	of	Transportation	:	City	of	Los	
Angeles.	N10	Mar.	2016.	
49%	
26%	
17%	
7%	
0%	
10%	
20%	
30%	
40%	
50%	
60%	
Under	50K	 50k-100K	 100K-200K	 Over	200K	
Household	Distribuion
8330	RESEDA	BLVD.																																																																																					COMMERCIAL	APPRAISAL	
GROUP 3	 					32


initiative to service 116 Metro Rail stations by 2035. This will lead to an increase of 35% from
the number of stations currently in use in 2016 (86).31
Los Angeles International Airport (LAX)
Los Angeles International Airport (LAX) is one of the largest international airports in the nation
by volume. LAX is a large employer for the city of Los Angeles. Historical LAX Volume
statistics have been categorized below.
LAX Annual
Passenger Volume
Year
Number of
Passengers
Annual %
Change
January 2016 6,051,758.00 8.75%
January 2015 5,522,056.00 1.86%
January 2014 5,419,617.00 6.35%
January 2013 5,075,280.00 3.16%
January 2012 4,914,971.00 5.10%
January 2011 4,664,231.00 1.17%
January 2010 4,609,720.00 7.40%
January 2009 4,268,383.00 -12.71%
January 2008 4,810,815.00
As shown in the chart, passenger volume had strong numbers in January 2008 but had a slight
decline in 2009. This decline was cause by the recession that occurred in 2008. The passenger
volume rebounded directly after 2009 and has continued its growth into 2016.32
Los Angeles International Airport provides air transportation to Los Angeles city and
surrounding areas. The airport is located northwest of the 405 San Diego Freeway and South of
105 highways. Public bus lines provide most of the public transit in the area. An alternative to
31
	"Department	of	City	Planning."	Department	of	City	Planning.	N.p.,	n.d.	Web.	13	Mar.	2016.	
32
	"Los	Angeles	World	Airports	Official	Website."	Los	Angeles	World	Airports	Official	Website.	N.p.,	n.d.	Web.	13	
Mar.	2016.
8330	RESEDA	BLVD.																																																																																					COMMERCIAL	APPRAISAL	
GROUP 3	 					33


public bus use is the rail service provided by Blue Line. Blue line runs between downtown Los
Angeles and Long Beach. The Green Line runs down the center of interstate 105.
8330	RESEDA	BLVD.																																																																																					COMMERCIAL	APPRAISAL	
GROUP 3	 					34


Port Activity
The Ports of Los Angeles and Long Beach are huge contributors to the national and local
economy. The Los Angeles metropolitan area is heavily influenced by the economic activity
generated by the Long Beach and Los Angeles ports. Activities in the ports are projected to
increase new job opportunities for the area.34
Development Trends
Employment in Los Angeles City is still influenced by the aerospace and defense industries;
there is also a growing concentration of high technology, automotive and trade related business.
Residential development in Los Angeles City ranges from low-income apartment complexes to
upper-income single-family residences. The more desirable and expensive residential areas are
located in the Western proximity to the Pacific coastline. Los Angeles metropolitan area has a
diversified retail base with strip malls, as well as freestanding businesses. The most desirable
shopping centers in the metropolitan area are The Grove, Santa Monica Place, Westside Pavilion,
and Beverly Center. The Beverly Center has issued a release stating a mall renovation of $500
33
	TEU	–	Twenty-Foot	equivalent	Units,	Standard	maritime	industry	measurement	
34
	Port	of	Los	Angeles:	America's	Port®."	Port	of	Los	Angeles:	America's	Port®.	Web.	13	Mar.	2016.	
Los Angeles Port
Volume
February
Loaded Inbound
(TEU)33
Loaded Outbound (TEU) Total Loaded (TEU) Annual % Change
2016 372,744.30 146,488.75 519,233.05 34.51%
2015 254,225.30 131,806.50 386,031.80 -31.04%
2014 296,537.10 263,249.25 559,786.35 -8.97%
2013 325,505.25 289,453.50 614,958.75 16.99%
2012 263,458.80 262,194.65 525,653.45 -5.27%
2011 289,163.05 265,749.75 554,912.80 5.61%
2010 274,939.80 250,518.80 525,458.60
8330	RESEDA	BLVD.																																																																																					COMMERCIAL	APPRAISAL	
GROUP 3	 					35


million with a completion date of November 2018. This remodel will bring more restaurants to
the area, as well as create room for several new retail stores.
Demographic Analysis
The Los Angeles Metropolitan area is approximately 468.67 square miles with a population per
square mile of 8,092. According to the Census bureau, the city of Los Angeles sub region had a
population of approximately 3.79 million in 2000 and about 4.12 million in 2008. According to
the City of Los Angeles planning department the forecast from 2008 through 2030 shows an
estimated additional growth of 294,000 persons. This will reflect a population growth of 7.3%.35
35
"Department of City Planning." Department of City Planning. Web. 13 Mar. 2016.
	
3,400,000	
3,500,000	
3,600,000	
3,700,000	
3,800,000	
3,900,000	
4,000,000	
4,100,000	
4,200,000	
4,300,000	
4,400,000	
4,500,000	
2000	 2008	 2010	 2020	 2030	
Popula1on	
Year	
Popula1on	Forecast	for	City	of	Los	Angeles	
Subregion
8330	RESEDA	BLVD.																																																																																					COMMERCIAL	APPRAISAL	
GROUP 3	 					36


Government
The elected government of Los Angeles City is composed of 15 city council districts and the
mayor of Los Angeles. The Mayor operates under mayor-council government. The Mayor Is
elected and holds a 4-year term. Under California Constitution the Mayor can only serve two
terms. City council is composed of 15 members who serve a 4-year term. Councilman can serve
a maximum of 3 terms and these members are elected from single member districts.
City of Los Angeles Conclusion
The population of the city Los Angeles is at 4.12 million as of 2008. The unemployment has
been going in down these past years in Los Angeles is and is at 5.3% as of November 2015. The
median household income for the Los Angeles area is at $50,544 with fewer than 50% living
under less $50,000 a year. Los Angeles has great deal of freeways; they accommodate multiple
interstate highways and the US 101. Los Angeles accommodates one of the busiest airports in the
world with other facets of transportation with bus and public rail systems.
Neighborhood Analysis
Opposite Reseda Blvd. west of the property is a plaza that harbors a law office and dental
groups. Just south of the property on Roscoe Boulevard there is plaza dedicated to medical
facilities that includes Northridge Hospital Medical Center, Dignity Health, and Lab Corp. Other
than the designated hospital area, the corner of Reseda and Roscoe is populated mainly with
different medical care facilities, scattered insurance offices, convenience stores, and restaurants.
Going up Reseda before the train tracks there is a continuation of Class C commercial buildings
that have the same business demographics as stated before.
Property Surroundings
East of the property is Minimum Residential housing to Very Low I Residential. Heading East
for ½ mile from the property the residential briefly turns into a low medium/ Low medium I
8330	RESEDA	BLVD.																																																																																					COMMERCIAL	APPRAISAL	
GROUP 3	 					37


Residential. Two miles from the Reseda and Roscoe heading two miles east there is a Light
Manufacturing with a railroad, which runs through the zone, the Interstate 405 is adjacent to the
Light-manufacturing zone.
Going South from which the property there is a stretch of Low Medium/ Low Medium I
Residential for ¾ of a mile before it returns to General Commercial zoning for 1 ¼ miles with
Reseda and Sherman Way being the epicenter of this commercial zoning. At this intersection of
Reseda and Sherman Way going a ½ mile each direction (north, south east and west) is General
Commercial zoning. Going 3.3 Miles south from the property of 8330 Reseda is the U.S. Route
101 Freeway.
The 8330 Reseda Blvd. property is located at a base where a General Commercial zone starts and
continues to go north for 1-½ miles. Adjacent to the Commercial zoning is California State
University, Northridge that is one mile from the appraised property. The California State Route
118 is 3- ¾ miles from the property. Reseda can get busy during the weekdays when attempting
to get to the 118 State Route. The Interstate 405 connects to the State Route 118 that runs
parallel to Roscoe Boulevard. There is an easy access point to enter the 118 State routes by
taking Roscoe to the I-405 north entrance.
Going East on Roscoe Boulevard there is a range of very Low Residential to Low Medium I
Residential for 3- ¼ of a mile which then goes into a light manufacturing zone that stretches for
6 miles from the City of Chatsworth to the U.S. Route 101 Freeway
Immediate Area Conclusion
The property is located on a commercial zoned intersection of Reseda and Roscoe that connects
to three different freeways. The area around the property is around heavily populated medical
facilities. Right across the street on the corner of Reseda and Roscoe is Northridge Hospital and
Medical Center. Around the area there is a collection of Low Residential housing and
manufacturing zones that include a railroad system.
8330	RESEDA	BLVD.																																																																																					COMMERCIAL	APPRAISAL	
GROUP 3	 					38


Site Analysis
8330	RESEDA	BLVD.																																																																																					COMMERCIAL	APPRAISAL	
GROUP 3	 					39


PLAT diagram found from "ZIMAS." ZIMAS. N.p., n.d. Web. 14 May 2016.
Size and Shape
As indicated earlier in this report, the subject property is comprised of one parcel of land as
shown on the following
table:APN: 27886022026
Net Land Area: 34,278.7 SF
Orientation: Total Frontage
Shape: Rectangular
Topography: Flat
Zoning: C2 and P – 1VL, Commercial District
Utilities: Service to utilities
Flood Zone: C 060137 0043C, dated May 5, 1999
Earthquake Zone: 8.4km away from the Northridge fault line
8330	RESEDA	BLVD.																																																																																					COMMERCIAL	APPRAISAL	
GROUP 3	 					40


Street Access
The subject site has 150 SF of frontage along the Reseda Blvd. There is both an entrance and exit
to the subject property.
Utilities
All the usual and necessary public utilities are available to the subject site.
Zoning
The subject site is subject to the zoning jurisdiction of the City of Los Angeles. The subject site
is zoned C2 and P – 1VL, Commercial District which allows under certain criteria the building
possibilities of some of the following, Art or Antique shop, Bird Store, Carpenter, Plumbing, or
Sheet Metal shop, Restaurant and others.
Topography & Drainage
The topography of the subject sites is generally level and drainage appears to be adequate. The
subject property is located in Flood Zone C 060137 0043C, dated May 5, 1999 by the Flood
Hazard Area Maps, published by the Federal Insurance Administration. Flood Zone C indicates
an area of minimal hazard from principal sources of floods in the area. Although this zone is
outside the 100-year flood zone, buildings in this zone could be flooded by severe, concentrated
rainfall coupled with inadequate drainage systems. The subject site is not located in a flood
hazard area in which mandatory flood insurance requirements apply.
Earthquake Fault Zone
The Earthquake Fault Zone (originally called the Alquist-Priolo Special Studies Zone) was
enacted by the Alquist Priolo Special Studies Act, which was signed into law on December 23,
1972 and went into effect on March 7, 1973. The purpose of this act was to prohibit the location
of most structures for human occupancy across the traces of active faults and to mitigate thereby,
the hazards of fault ruptures. The subject property is not located in an Earthquake Fault Zone.
However, it should be noted that the entire Southern California region is earthquake prone.
8330	RESEDA	BLVD.																																																																																					COMMERCIAL	APPRAISAL	
GROUP 3	 					41


Soils & Geology
We have not reviewed a recent soils report nor geological report for the subject site. However,
based upon our inspection of the subject property and the environmental site report, prepared by
Glenfos Inc. (Dated July 11, 1997), no signs of any potential detrimental hazardous material
were found on the subject site. For the purposes of this appraisal, it is assumed that the soil and
geologic conditions of the subject site are not unfavorable for its current use.
Easements/Encroachments
We have not reviewed a current preliminary title report, for the subject property. However,
based upon our inspection of the subject property, we are of the opinion that there are no
negative encroachments or other special hazards that might adversely affect the utility or
marketability of the subject property. The only encroachments found were normal utility
easements and access easements. The subject is assumed to be free and clear of the same of any
potential encumbrances, which may negatively impact the subject property.
Nuisances & Hazards
As per the Appraisal Institutes’ Guide Note 8 of the Uniform Standards of Professional Appraisal
Practice, the appraiser must note any hazardous substances or materials, which may be present at
the subject property and consider them in the appraisal valuation process. We are not qualified to
detect or measure hazardous materials. The existence of toxic waste hazards resulting from
current or prior uses may or may not be present. While every effort has been made to observe
any potential waste hazards, we are not qualified to make a determination as to their existence. If
such toxic material is believed to impact the subject property in any way, the user of this
appraisal is urged to contact a qualified professional trained to identify such hazards; in addition,
the appraisers reserve the right to re-evaluate the impact of any potential nuisances and hazards
on the final value estimate contained in this report.
REAL ESTATE TAX INFORMATION
We have identified the real estate tax assessments and annual real estate taxes for the previous
tax year. The tax information was obtained for the subject property by its assessor’s parcel
number. The direct assessments are $2,461.51 with an effective tax rate of 1.16%
8330	RESEDA	BLVD.																																																																																					COMMERCIAL	APPRAISAL	
GROUP 3	 					42


The Jarvis/Gann tax initiative was passed in 1978 and limited taxes to 1% of the market value of
the property. Although the assessments can be increased 2% per year, no major change in the
assessment can be made unless the property transfers ownership. At that time the property may
be re-assessed at the then existing fair market value.
Improvement Description
Description of Improvements
The subject property consists of a multi-tenant office building, built in 1986. The improvements
are two-stories in height and total 12,860 gross and 12,860 rentable square feet; the
improvements are situated on 34,279 SF of commercial land with 62 on-site parking spaces (4.82
spaces per 1,000 SF of building area).
Building Components
The subject property is built-out as conventional office spaces with the exception of the dentist’s
offices. The dentist’s offices have waiting areas and specialized x-ray machines and chairs
utilized by the dentists. The remaining offices and common areas are conventional and have the
following characteristics:
Building Height:
The subject property is two-stories in height, with ground level parking.
Foundation:
The foundation of the property consists of reinforced concrete slab on grade with continuous
wall footings and spread column footings.
Roof Covering:
Built-up composition and plywood.
Construction:
Steel beam and concrete with brick facing.
8330	RESEDA	BLVD.																																																																																					COMMERCIAL	APPRAISAL	
GROUP 3	 					43


Interior:
The interior spaces consist of partitions constructed with wood studs covered with drywall and
finished with paint. The ceilings consist of acoustic fissure panels suspended in a T-bar grid
system, with recessed fluorescent and single-bulb incandescent light fixtures. The first floor
bank area has a high (20 foot) ceiling with recessed can lights and wooden light soffits around
the perimeter walls.
Flooring:
The interior flooring includes high quality vinyl tile and/¬or commercial grade carpeting.
Common areas are carpeted with restrooms tiled.
Elevator/Staircase:
Two hydraulic elevators and two enclosed staircases.
HVAC:
The subject building includes a roof mounted package unit system.
Common Area:
Parking, restrooms and common walkways.
Lighting:
Most of the units include fluorescent and incandescent light fixtures.
Landscaping:
The landscaping consists of shrubbery and few trees in a planter that follows the walls of the
building and site.
Parking:
There are 62 on-site parking spaces or 4.82 spaces per 1,000 SF of building area.
Condition:
Overall, the subject improvements are in good condition.
8330	RESEDA	BLVD.																																																																																					COMMERCIAL	APPRAISAL	
GROUP 3	 					44


Effective Age/Economic Life
The subject improvements were constructed in 1986. Based upon our inspection of the property,
and a review of the Marshall & Swift Valuation Guide, we are of the opinion, that the subject
improvements have an economic life of 50 years. According to the Dictionary of Real Estate
Appraisal, published by the Appraisal Institute, the “Economic Life” of the building
improvements is defined as:
“The period over which the improvements to real property contribute property value.”
The economic life of a structure is often not the same as the physical life and will vary due to
changes in architectural styles and standards. According to the Dictionary of Real Estate
Appraisal, published by the Appraisal Institute, the “Effective Age” of the building
improvements is defined as:
“The age indicated by the condition and utility of a structure.”
The effective age of a building can be more or less than its actual or chronological age,
depending upon the maintenance and care of the improvements, in addition, to the conformity of
the improvements to the surrounding land uses. Based upon the property’s present condition, the
property has an effective age of 10 years, with a remaining life of 40 years.
8330	RESEDA	BLVD.																																																																																					COMMERCIAL	APPRAISAL	
GROUP 3	 					45


Analysis of Data
Highest and Best Use
According to the Dictionary of Real Estate Appraisal, a publication of the Appraisal Institute, the
highest and best use may be defined as:
• The reasonable and probable use that supports the highest present value of vacant land or
improved property, as defined, as of the date of appraisal.
• The reasonable, probable and legal use of land or sites as though vacant, found to by
physically possible, appropriately supported, financially feasible and that results in highest
present land value.
• The most profitable use.
The highest and best use of a specific parcel of land does not depend on subjective analysis by the
property owner, the developer, or the appraiser. Rather, the highest and best use is shaped by the
competitive forces within the market where the property is located. Therefore, the analysis and
interpretation of highest and best use is an economic study of market forces focused on the subject
property. Implied within this definition is a recognition of the contribution of that specific use to the
community environment or to the community's development goals, in addition to wealth maximization
of individual property owners. In appraisal practice, the concept of highest and best use represents the
premise upon which value is based.
In the analysis of the highest and best use of a property, consideration is given to the physically possible
uses of the site, the legally permissible uses, the financially feasible uses and the maximally productive
alternatives that would provide the greatest net return to the owner under the current or projected market
conditions. The first issue pertains to the physical characteristics of the site, such as size, dimensions,
topography, the availability of utilities and soil conditions. The lack or impairment of any of these facts
may make certain types of developments impossible. The second issue relates to the legality of an
intended use. As indicated above, the community's environmental or development goals may prevent
certain forms of use. The third issue pertains to the notion of economic viability. The fourth issue asks
whether a proposed or existing use produces the greatest net return to the land.
8330	RESEDA	BLVD.																																																																																					COMMERCIAL	APPRAISAL	
GROUP 3	 					46


Highest and Best Use As Vacant
According to the Dictionary of Real Estate Appraisal, published by the Appraisal Institute, the highest
and best use of a site, as if vacant is:
“among all reasonable, alternative uses, the use that yields the highest present land value, after
payments are made for labor, capital and coordination. The use of a property is based on the
assumption that the parcel of land is vacant or can be made vacant by demolishing any
improvements.”
As Vacant
Physically Possible
The subject property sits on a lot 300ft long and 114.26ft wide. Giving the property a total area
of 34,278.7 sq. ft. The property has a total frontage are of 114.26ft facing Reseda Blvd. The lots
access points are located on the front of the lot facing Reseda Blvd. The lot is flat throughout,
rectangular in shape, and sits 8.4 km away from the Northridge fault line. The subject has service
to utilities and sufficient access to roadways. With a lot this size a multitude of uses can placed
upon it. The following will list those possible uses:
• Warehouse
• Storage Facility (Storage units)
• Manufacturing/ Industrial use
• Apartment complex
• Hotel
• Retail Space (Single/Multi story)
• Office building (Single/Multi story)
• Automobile Service Area
• Car Dealership
• Medical use building (Single/Multi story)
8330	RESEDA	BLVD.																																																																																					COMMERCIAL	APPRAISAL	
GROUP 3	 					47


Legal Permissibility
The legally permissible requirement of the property, as though it were vacant, is restricted by the
C2 and P-1VL, Commercial District, zoning ordinance of Northridge zoning classification of
“Business Improvement District” encourages the use of the parcel (34,278 sq. ft.). These
restrictions permit the parcel to be used for, warehouse, storage facility (storage units),
manufacturing/Industrial use, apartment complex, hotel, retail space (single/multi story), office
building (single/multi story), automobile service area, car dealership, medical use building
(singe/multi story) listed in section 12.14.36
Financially Feasible
The determination of financially feasible is dependent on the market demand and legally
probable uses of the land. As mentioned in the market analysis the single family and multi family
markets are stable. Developments of new retail and multi-tenant properties have been active in
the past 3 years in the County of Los Angeles. Within the City of Los Angeles there are proposed
multi-tenant, residential, offices and manufacturing in the market. Current construction activity
in the area is the renovation of a 60,000 SF Class B office building at 6464 Canoga Ave in
Woodland Hills. These factors indicate that it would be financially feasible to complete an office,
retail or multi-tenant building on the vacant land assuming building expenses were low enough
to allow a satisfactory profit for the developer.
Maximum profitability
The final test of highest and best use determines which use produces the maximum amount of
profit. Sublet market has the highest asking rent in San Fernando Valley with signs of future
growth. Office building market is also growing but low absorption rates hinder revenues with a
large amount of space currently available in the market.
36
	"City	Charter,	Rules,	and	Codes."	City	Charter,	Rules,	and	Codes.	N.p.,	n.d.	Web.	04	Apr.	2016.
8330	RESEDA	BLVD.																																																																																					COMMERCIAL	APPRAISAL	
GROUP 3	 					48


Conclusion
According to the market analysis, the rental rates per square foot for sublet office buildings are
going up and vacancy is going down. As vacant, the subject property should be used as a multi
tenant office building that will be constructed immediately. Potential buyers will be an investors
or developers.
Highest and Best Use As Improved
According to the Dictionary of Real Estate Appraisal, published by the Appraisal Institute, the
highest and best use of a site, as improved is:
“The use that should be made of a property as it exists. An existing property should be
renovated or retained as is, so long as it continues to contribute to the total market value
of the property, or until the return from a new improvement would more than offset the
cost of demolishing the existing building and constructing a new one.”
As Improved
Physical Characteristics
The subject property’s lot is 34,278.7 sq. ft. Currently a 2 story building of 12,860 sq. ft. split
between 2 floors. Comprising 18.75% of the total available space within the entirety of the lot.
The building sits on the western most side of the lot, facing Reseda Blvd. flanked by an entrance
and exit. The building is two stories tall and is currently used as a Medical/ Dental building with
no vacancies.
The eastern side of the lot is currently used as parking space with a total of 62 spaces to satisfy
what is legally required for the size of the building. The positioning of the improvements is
considered functional for its current use. Improvements “as is” would not fit the needs of new
8330	RESEDA	BLVD.																																																																																					COMMERCIAL	APPRAISAL	
GROUP 3	 					49


retail users. If it is legally permissible an automotive dealership may be able to use the
improvement.
Legal Permissibility
As detailed in the Zoning Section of this report, the subject property is zoned C2 and P-1VL,
restricted Business Improvement District, by the Northridge Generalized Land Use.37
The
subject property, as improved, meets the various requirements as defined for the C2 and P-1VL
District.
The subject property allows a lot area with the requirements of the R4 Zone (Section 12.11-C.4),
shall apply to all portions of buildings used for residential purposes.
Financial Feasibility
The financial feasibility of the improvement will be derived from its perceived market value
against the lands market value as vacant. If the improvements at market value exceed the value
of the land then the subject improvements could be seen as financially feasible.
The improvements have an effective age of 30 years. The improvement does not need to be
renovated in order to be financially feasible in its current use as: Multi-Tenant office building.
The existing building is within current zoning laws and legally allowed to be on the lot for its
current use. Modifications to the property beyond building maintenance for habitability do not
substantially increase market value and should not be performed.
The use of improvements meets the criteria for financially feasible. The value the building
provides is more than the value of the land as vacant. Demolition of the building to construct the
ideal improvement would not be financially feasible.
37
"ZIMAS." ZIMAS. N.p., n.d. Web. 04 Apr. 2016.
8330	RESEDA	BLVD.																																																																																					COMMERCIAL	APPRAISAL	
GROUP 3	 					50


Conclusion
The highest and best use of the site as improved is its current use. The current use meets all the
zoning regulations and is psychically adapted for the size of the lot. The current use is capable of
producing a competitive return on capital invested.
Highest and best use as improved is its current state as a multi-tenant office building for the
benefit of an investor.
Overall Highest and Best Use
The highest and best use for the subject property is the current use as improved. The highest and
best use for the property as vacant is to build multi tenant office buildings immediately. As of the
date of evaluation the building is 100% occupied. There is a demand in the immediate area for
multi tenant office space and the current use fulfills that need.
Appraisal Methodology
In theory, there are three approaches to value, the Cost Approach, the Sales Comparison
Approach and the Income Approach.
The Cost Approach initially involves the valuation of the subject site, as if vacant. The Sales
Comparison Approach is utilized to determine the market value of the subject site, based on a
comparison of vacant land parcels. The Cost Approach also involves estimating the replacement
cost new for the improvements, deducting an estimated dollar amount for accrued depreciation
and adding the estimated land value. As previously indicated in this report, the Cost Approach
was not utilized for the following reasons:
8330	RESEDA	BLVD.																																																																																					COMMERCIAL	APPRAISAL	
GROUP 3	 					51


• The Cost Approach is predicated on the assumption that the market value of the subject
property is equivalent to the land value plus current construction costs less depreciation,
which is not always reliable, since the estimation of depreciation is subjective.
• There has been very little, if any, new office development in the City of Simi Valley; this
has resulted in a scarcity of new land sales in the area, from which to determine the land
value of the subject sites.
• The Cost Approach is not intrinsically suited to render an opinion of value for investment
properties, since construction costs plus land are not always equivalent to market value.
• The omission of the Cost Approach, when appraising an investment property such as the
subject property, does not result in a misleading value estimate. The Cost Approach is
typically not relied upon by investors and buyers in the marketplace; the Sales
Comparison Approach and the Income Capitalization Approach are the traditional
approaches utilized in the marketplace.
The Sales Comparison Approach involves direct comparison of similar properties that have sold
and/or are available for sale in the marketplace. The data from these comparable are converted to
pertinent units of comparison that are analyzed and adjusted for differences, which are
considered significant, leading to a value indication for the subject property. The pertinent units
of comparison used in this analysis were the price per square foot indicator.
The Income Capitalization Approach is based on the principle of anticipation of future benefits.
In this analysis, the subject was valued on an income basis via a stabilized income analysis
which involved projections of income, vacancy and collection loss, operating expenses and the
capitalization of the net operating income by a market derived overall capitalization rate. Rentals
of competing buildings and/or spaces in the general area of the subject were collected through
discussions with leasing agents and compared to the subject. The projected market rates were
utilized for the all of the subject’s units with leases that expire prior to the end of 2004, while
contract rents were utilized for space with leases that expire in 2005 and beyond, with the
projected vacancy and collection loss derived from an examination of the comparable properties.
Operating expenses were derived from industry averages. By applying a market derived overall
capitalization rate, an indicated value was concluded via a stabilized analysis.
8330	RESEDA	BLVD.																																																																																					COMMERCIAL	APPRAISAL	
GROUP 3	 					52


SALES COMPARISON APPROACH
The Sales Comparison Approach to value involves comparing the subject property to similar
office buildings, which have sold and/or are available for sale and have the same general
characteristics. According to the Appraisal Institute, the Sales Comparison Approach is defined
as:
"A method of estimating market value whereby a subject property is compared with comparable
properties that have sold recently. One premise of the Sales Comparison Approach is that the
market will determine a price for the property being appraised in the same manner that it
determines the prices of comparable, competitive properties."
Price Per Square Foot - The most common unit of comparison in appraising office
buildings like the subject property is the price per square foot of building area. The price per
square foot derived by dividing the sales price of the property by the square feet of the
improvements.
Market Analysis
The Sales Comparison Approach reflects actual market behavior of typical purchasers and sellers
under current market conditions, in addition, meaningful data from which to compare similar
properties to the subject property. In order to find comparable sales, our investigative efforts
included searching sales through CoStar, Acxiom, First American/Dataquick, discussions with
knowledgeable brokers and owners in the area, and an inspection of the subject property's
general market area for comparables available for sale.
Comparison
The sales comparison approach utilizes sales of comparable properties adjusted for the
differences to find the value of the subject property. Valuation is found using psychical units of
comparison such as price per floor, price per parking sport ratio and materials used for
construction. Adjustments are applied to the psychical units of comparison found on the
information given about the comparable sales. The units of comparison chosen for the subject are
8330	RESEDA	BLVD.																																																																																					COMMERCIAL	APPRAISAL	
GROUP 3	 					53


Then used to find an adjusted approximate value of the subject property.
The above sales comparisons are comprised solely of medical purpose buildings. There was a
wide range of per square foot sales prices. In some sales comparisons this was due to differing
land prices in each area. Sales comparisons were selected using criteria like proximity to subject
property, square feet and age of improvements.
Subject
Property Comp 1 Comp 2 Comp 3 Comp 4 Comp 5
7220
Woodman
Ave. Van
Nuys, CA
91405
8940
Reseda
Blvd.
Northridge
CA, 91324
8771 Van
Nuys
Blvd.
Panaroma
City Ca,
91402
11260
Wilbur
Ave.
Northridge,
CA 91326
12992
Victory
Blvd.
North
Hollywood
Ca 91606
Sales Price $2,600,000 $2,150,030 $1,490,000 $4,925,000 $2,700,000
Sales Price/ SF $230.09 $293.72 $266.07 $354.42 $306.99
Date of Sale 11/24/15 10/30/15 9/11/15 8/7/15 6/19/15
Age of Property 29 34 59 55 30 25
Location
Middle
Block Middle Block
Middle
Block
Middle
Block Corner
Middle
Block
Net Land Area 34279 19349 19502 14527 42698 14815
Building use Medical Medical Medical Medical Medical Medical
Market/ Sub-
Market LA/SFV LA/SFV LA/SFV LA/SFV LA/SFV LA/SFV
Visibility Frontage Frontage Frontage Frontage Frontage Frontage
Building Area/ SF 12860 11300 7320 5600 13896 8795
Condition/Quality Masonry Wood Frame Masonry Masonry Wood frame Masonry
Number of
Stories 2 2 1 1 2 1
Parking Spaces
(1000 SF) 4.82 3.01 5.46 3.75 5.00 1.14
8330	RESEDA	BLVD.																																																																																					COMMERCIAL	APPRAISAL	
GROUP 3	 					54


QUALITATIVE ANALYSIS
Qualitative Adjustments Comp 1 Comp 2 Comp 3 Comp 4 Comp 5
Sales Price/SF $230.09 $293.72 $266.07 $354.42 $306.99
Age of Property Inferior Inferior Inferior Inferior Superior
Location Access -- - - Superior -
Building Area (SF) Inferior Inferior Inferior Superior Inferior
Condition/Quality Inferior - - Inferior -
Number of Stories - Inferior Inferior - Inferior
Parking (Spaces/1,000SF) Inferior Superior Inferior Superior Inferior
Overall Inferior Inferior Inferior Superior Inferior
QUANTITATIVE ANALYSIS
Quantitative Adjustments Comp 1 Comp 2 Comp 3 Comp 4 Comp 5
Sales Price/SF $230.09 $293.72 $266.07 $354.42 $306.99
Age of Property 5.00% 5.00% 5.00% 5.00% -5.00%
Location Access - -- -- -5.00% --
Building Area (SF) 10.00% 10.00% 10.00% -10.00% 10.00%
Condition Quality 5% -- -- 5% --
Number of Stories -- 5.00% 5.00% -- 5.00%
Parking (Spaces/1,000SF) 5.00% -5.00% 5.00% -5.00% 5.00%
Overall Adjustments 25.00% 15.00% 25.00% -10.00% 15.00%
Adjusted Value per/SF $287.61 337.78 $332.59 $389.86 $353.04
Overall Inferior Inferior Inferior Superior Inferior
Compared sales Analysis
The sales comparable to the subject property are sales comparison 2 and sales comparison 4. Sale
comparison 2 requires an overall upward adjustment. This comparison had inferior square feet,
inferior number of floors in the building and inferior age of building. These differences required
8330	RESEDA	BLVD.																																																																																					COMMERCIAL	APPRAISAL	
GROUP 3	 					55


an upward adjustment. Comparison 2 had more parking spots, than the subject and will have a
downward adjustment.
Sale comparison 4 required an overall downward adjustment. This sale had a better location,
more parking spots per 1000 SF and also had more building area measured in Square feet. All
three will require a downward adjustment to the comparison. The construction materials used in
the building of comparison 4 are inferior to the subject property and will bring an upward
adjustment to the comparison.
Sale comparison 1 3 and 5 are inferior to the subject property and will see an overall upward
adjustment. This property had less building square feet, number of floors and parking spots than
the subject property. Sale comparison 2 is older and will have an upward adjustment. Sale
comparison 3 is newer than the subject property and will be adjusted downward.
The unadjusted range of comparable sales is $230.09 per square foot to $354.42 per square foot.
These values will dictate an overall value close to $3,800,000. This figure is unadjusted for
inferior and superiorities of the 5 comparable sales. When adjusted for differences in the
comparable sales the range changes with 287.61 as the low and 389.86 as the high.
Conclusion of Sales Comparison Approach
The sales range from a low of $287.61 per square foot to a high of $389.86 per square foot of
building area. Based on this analysis the subject property adjusted price per square foot should be
more than comparison 5 at $353.04 but should be less than $389.86 of comparison 4. We found
that a price per square foot of $360.00 per square foot should be used because of the
comparable age to comparison 5 but added parking spots and square footage that the subject
property has.
8330	RESEDA	BLVD.																																																																																					COMMERCIAL	APPRAISAL	
GROUP 3	 					56


Based on the subject’s square footage this would indicate an estimated “As is” market value as of
May 15, 2016 of:
Building Area in Square Feet Value Indicator Building Value
12860 SF $360.00 / SF $4,629,600
"As is" Value $4,650,000
Income Capitalization Approach
Introduction
The Income Capitalization Approach is defined by the Appraisal Institute, as:
"That procedure in appraisal analysis which converts anticipated benefits (dollar income or
amenities) to be derived from the ownership of property into a value estimate... Anticipated
future income and/or reversions are discounted to a present worth figure through the
capitalization process."
The Income Capitalization Approach or Investment Approach is generally the preferred method
for valuing income-producing properties because it most closely reflects the investment rationale
and strategies of typical buyers. Under this Income Capitalization Approach to value, this annual
net operating income (NOI) is derived by a reliable estimate of the gross scheduled income, less
an estimate of vacancies and collection loss, less an estimate of operating expenses for the
subject property. In preparing this Income Capitalization Approach, we undertook several steps,
as follows:
• We surveyed competing office buildings in the general area in order to determine current
rent levels.
• We reviewed data pertaining to office buildings which have currently leased or are
available for lease. (In most cases, the analysis of the actual rental income becomes a
paramount value consideration).
• Based upon our analysis of the various rental information, we have forecasted annual
rents for the subject property.
8330	RESEDA	BLVD.																																																																																					COMMERCIAL	APPRAISAL	
GROUP 3	 					57


• We have prepared an income analysis of the subject property, including an estimate of
vacancy and expenses and the capitalization of the estimated net operating income at an
appropriate capitalization rate.
Rental Survey
In order to arrive at a reasonable estimate of annual rental income for the subject property, we
have gathered and analyzed information pertaining to office properties in the Reseda-Sherman
Oaks area.
Rent Comparable No. 1 7220 Woodman Avenue Van Nuys, CA 91405
PROPERTY INFORMATION
Property Type: multi-tenant Office Building
Building Area: 11,300 SF
Improvements: Wood-frame and Stucco, built in 1981
Condition/Quality: Poor / Average
Leased Area: 11,068 SF
Occupancy: 100%
On-Site Parking: 34 shared
RENTAL SUMMARY: This property located at 7220 Woodman Avenue is a thirty-four year
old two-story wood framed medical building that was last sold on November 24th
2015. The
multi-tenant building is located is the Los Angeles San Fernando Valley region sold at
$2,600,000. The property is located in the middle of the block and has frontage view on
Woodman that extends 129 feet. The building area is 11,300 square feet with a net land area of
19,349 and a ratio of 3.01 parking spaces per 1000 SF.
Overall Comparison: Inferior
Rent Comparable No. 2 8940 Reseda Boulevard Northridge, CA 91324
PROPERTY INFORMATION
Property Type: Multi-Tenant Office Building
8330	RESEDA	BLVD.																																																																																					COMMERCIAL	APPRAISAL	
GROUP 3	 					58


Building Area:7,320 SF
Improvements: Masonry, built in 1956
Condition/Quality: Average / Average
Leased Area: 7320 SF
Occupancy: 100%
On-Site Parking: 40 Shared
RENTAL SUMMARY: The property located on Reseda Boulevard is a fifty-nine year old
masonry medical building that was last sold on October 30th
2015 at $2,150,030. It is located in
the Los Angeles San Fernando Valley region. This one story building has a building area 7320
SF, a net land area of 19,502 SF with a ratio of 5.46 parking spaces/1000 SF. This is a multi-
tenant building locate in the middle of the block with a frontage view.
Overall Comparison: Similar
Rent Comparable No. 3: 8771 Van Nuys Blvd Panorama City CA, 91402
PROPERTY INFORMATION
Property Type: Multi-Tenant Office Building
Building Area: 5,600 SF
Improvements: Masonry, built in 1960
Condition/Quality: Poor / Poor
Leased Area: 5,600 SF
Occupancy: 100%
On-Site Parking: 21 Shared
RENTAL SUMMARY: This one story medical building located on Van Nuys Blvd is a fifty-
five year old masonry building sold at $1,490,000 on September 11 2015. Its building size is
5,600 SF with a net land area of 14,527 SF and a parking ratio of 3.75 parking spaces/1000 SF.
This property is located in the Los Angeles San Fernando Valley region. It is located in the
middle of the block with 91 feet worth of street frontage on Van Nuys Blvd.
Overall Comparison: Inferior
8330	RESEDA	BLVD.																																																																																					COMMERCIAL	APPRAISAL	
GROUP 3	 					59


Rent Comparable No. 4: 11260 Wilbur Avenue Northridge CA, 91326
PROPERTY INFORMATION
Property Type: Multi-tenant Office Building
Building Area: 13,896 SF
Improvements: Wood Frame, Built in 1985
Condition/Quality: Good / Good
Leased Area: 13,896 SF
Occupancy: 91.7%
On-Site Parking: 68 Shared
RENTAL SUMMARY: This property located at 7220 Woodman Avenue is a thirty-four year
old two-story wood framed medical building that was last sold on November 24th
2015. The
multi-tenant building is located is the Los Angeles San Fernando Valley region sold at
$2,600,000. The property is located in the middle of the block and has frontage view on
Woodman that extends 129 feet. The building area is 11,300 square feet with a net land area of
19,349 and a ratio of 3.01 parking spaces per 1000 SF.
Overall Comparison: Superior
Rent Comparable No. 5: 12992 Victory Boulevard North Hollywood CA, 91606
PROPERTY INFORMATION
Property Type: Multi-Tenant Building
Building Area: 8.795 SF
Improvements: Masonry, built in 1990
Condition/Quality: Great / Good
Leased Area: 8,795 SF
Occupancy: 100 %
On-Site Parking: 10 Shared
RENTAL SUMMARY: This twenty-five year old multi tenant office building was last sold on
June 19th
2015 at $2,700,000. This property is located in the middle of the block on Victory
Blvd. The one story masonry building has a net land area of 14,815 SF with a building area of
8330	RESEDA	BLVD.																																																																																					COMMERCIAL	APPRAISAL	
GROUP 3	 					60


8,795 SF and a ratio of 1.14 parking spaces/1000 SF. It is located in the Los Angeles San
Fernando Valley region.
Overall Comparison: Inferior
Potential Gross Income
Based upon the analysis of the rent comparables, we have forecasted potential gross income at
$324,000 per year. This is based on the average of $2.10 per square feet per month of the rent
comparables. Asking rent per square feet ranged from $2.10 to $2.60.
Vacancy & Collection Loss
As of the date of inspection, the subject property was 100% occupied. According to Office
Market Overview, the overall vacancy rate for office space in San Fernando Valley was between
11% and 21%. Vacancy rates for the sale comparable in this appraisal ranged from 97.1% to
100%, while vacancy rates for the rent comparable in this appraisal ranged from 0% to 25%.
The subject property has remained 100% occupied for the past few years. This is due to the
willingness of the management to work with tenants and desire to maintain high occupancy
levels. For purposes of this analysis, we have utilized a 17.7% vacancy factor. This vacancy
factor was determined through discussions with market participants, such as brokers and owners,
and through market rates obtained from the comparable sales.
Operating Expense Conclusion
After a review of the operating expenses being incurred by comparable investment properties in
the subject’s market area, historical operating statements and a reference of the IREM Operating
Expense Guideline for office buildings, we are of the opinion that our expense estimates are
appropriate, given that the subject’s historical trend, and current lease terms. A summary table
of the subject property’s historical expenses is provided below.
8330	RESEDA	BLVD.																																																																																					COMMERCIAL	APPRAISAL	
GROUP 3	 					61


Overall Capitalization Rate
The final step in the Income Capitalization Approach to value is to determine the appropriate
capitalization rate to convert the anticipated net operating income to an indicated value.
• Initial year strip capitalization rates of 5.00% - 11.00%, with an average of 7.46% for
suburban office buildings in the Los Angeles were shown in the last quarter “Korpacz
Real Estate Investor Survey”, a quarterly survey of investment bankers, domestic pension
fund advisors, REIT’s and real estate investors.
• The office building sales utilized in the sales comparison approach indicated overall
capitalization rates from 5.00% to 6.00%.
Based upon the preceding information and a review of market statistics provided from general
data sources, we have utilized an 4.25% overall capitalization rate for the subject property.
Reconciliation
The reconciliation process consists of reviewing the various independent derived valuation
methods, weighing their respective merits, and correlating the data into a final value estimate.
The following is a summary of the value indicators by two approaches to value, utilized in our
valuation analysis of the subject property.
Operating	Expenses	 Methodology	 Proforma	
Property	Taxes	 Tax	rate	applied	to	market	value,	plus	direct	assessments	 $47,663	
Property	Insurance	 Estimated	at	$0.92/SF	based	on	historic	costs	 $11,831	
Repairs	&	
Maintenance		
Estimated	at	$1.64/SF	based	on	historic	costs	 $21,090	
Janitorial	 Estimated	at	$0.75/SF	based	on	industry	standards	 $9,645	
Trash	Removal	 Estimated	at	$0.23/SF	based	on	industry	standards	 $2,958	
Utilities	 Estimated	at	$3.12/SF	based	on	historic	costs	 $40,123	
Management	 Estimated	at	3.0%	of	Effective	Gross	Income	 $8,001	
Reserves	 Estimated	at	2.0%	of	Effective	Gross	Income	 $5,334	
Total	Expenses		 		 $146,646	
Total	Expenses	Per	SF	 		
$11.40	
/SF
8330	RESEDA	BLVD.																																																																																					COMMERCIAL	APPRAISAL	
GROUP 3	 					62


To conclude the Sales Comparison Analysis Approach and based on our Sales Comparison
Analysis, we concluded a value of $360. Per square feet, with a value of $4,650,000 for the
subject property.
The sales comparison approach was ultimately used to determine the appraised value of the
property. The sales comparison approach was used as the basis of the appraisal for the following.
One, the sales comparison approach allowed us to determine market value based on recent sales
of similar properties with similar uses. Two, this worked to determine a fair market value based
on what other individuals have paid for similar properties. Three, we found this approach to best
reflect market behavior and is most widely used and understood by buyers. Four, the value
derived from the sales comparison approach resulted from the availability of recent sales, and
quality data on comparable properties.
The income capitalization approach was also used in this appraisal to determine an appropriate
market value for the property. This calculated value is $2,825,061. The value derived from this
approach relies solely on direct information from the subject property. It takes market values in
instances where information on the subject property cannot be found. For instance a market
vacancy of 17.7% was used to determine a vacancy allowance for the subject property. This rate
came from a market average in the general are of the subject property. The appraisers are of the
belief that this approach fails to adequately incorporate market conditions in determining a final
value for the subject property. For this, the income capitalization approach was disregarded.
Direct	Capitalization		
Rental	Income		 		 $324,072		
Other	Income	 		 $0		
Potential	Gross	Income	(PGI)	 		 $324,072		
Vacancy	(less)	 		 $57,361		
Effective	Gross	Income	(EGI)	 		 $266,711		
Expenses	 		 		
Taxes	 		 $47,663		
Insurance	 		 $11,831		
Repairs	&	Maintenance	 		 $21,090		
Janitorial		 		 $9,645		
Trash	Removal	 		 $2,958		
Utilities		 		 $40,123		
Management	 		 $8,001		
Reserves	 		 $5,334		
Total	Expenses	 		 $146,646		
Net	Operating	Income	 		 $120,065		
		 		 		
Value	Conclusion		 		 $2,825,061
8330	RESEDA	BLVD.																																																																																					COMMERCIAL	APPRAISAL	
GROUP 3	 					63


Methodology Estimated Value
Sales Comparison $4,650,000
Income Capitalization $2,825,061
8330	RESEDA	BLVD.																																																																																					COMMERCIAL	APPRAISAL	
GROUP 3	 					64


ADDENDA
8330	RESEDA	BLVD.																																																																																					COMMERCIAL	APPRAISAL	
GROUP 3	 					65


Left side view of Subject Property
8330	RESEDA	BLVD.																																																																																					COMMERCIAL	APPRAISAL	
GROUP 3	 					66


Front view of Subject Property
8330	RESEDA	BLVD.																																																																																					COMMERCIAL	APPRAISAL	
GROUP 3	 					67


Right side view of subject property
8330	RESEDA	BLVD.																																																																																					COMMERCIAL	APPRAISAL	
GROUP 3	 					68


Nathan Newman
9227 Reseda #118 Northridge, CA 91324
Phone: (559) 940-4183 E-Mail: nathanhnewman@gmail.com
Objective
To obtain a sales position within the Real Estate industry
Experience
Cellucor August 2014 – Current
Manager of Sales Development
Los Angeles, California
! Increased customer base for franchise GNCs
! Business to Business health supplement sales
! Worked with GNC Franchise owners to create weekly events
! Trained staff on products and sales procedures
GNC Health Supplement Retailer April 2012 – August 2014
Sales Manager
Clovis, California
! Merchandized store regularly
! Balanced accounting ledgers for store weekly
! Handled cash and deposits every morning and evening
! Communicate with customers to find what they need
! Trained staff on product health benefits
! Generated sales growth using sales expertise
Education
California State University, Northridge August 2014 –
May 2016 (Expected)
! Bachelors of Science in Finance
! Bachelors of Science in Real Estate
! Dean’s List recipient
Fresno City College Fall 2012 –
May 2014
! Associate of Science in Business Administration Degree
! Cumulative G.P.A. (3.7)
! Dean’s List recipient
! Honors Program member
8330	RESEDA	BLVD.																																																																																					COMMERCIAL	APPRAISAL	
GROUP 3	 					69


Clovis High School August 2008 –
May 2012
! G.E.D. Degree
! Cumulative G.P.A. (3.5)
! Principals Honor
! Cougar Foundation Scholarship Recipient
Skills Summary
Computer Capability
! Strong knowledge of Microsoft Word, Access, Excel, and PowerPoint
! Ability to work with several operating systems including Windows, Mac OSX and Linux
Business Communication
! Over two years of retail communication experience
! Served in numerous direct sales and sales management roles for a supplement retailer
! Skilled in delegating tasks and motivating team players to achieve their best goals
Business Management
! Extensive work in merchandizing
! Handled and maintained large amounts of inventory
! Prepared income, revenue, and royalty reports
! Prepared store inventory orders
8330	RESEDA	BLVD.																																																																																					COMMERCIAL	APPRAISAL	
GROUP 3	 					70


Damani Lenore
8915 Nestle Ave., Northridge, CA 91325
*Cell: 714-333-7634
damani.lenore.623@my.csun.edu
Work Experience
Papa johns Pizza,
Cashier, June – August 2012
Answered phones for foods ordered and for mangers, cleaned kitchen and assembly line, prepped
food, and worked behind cash register
Apprenticeships – July- August 2013
Rode along with a residential real estate appraiser, using unique approaches on finding property
value.
Education
Cal State Northridge, Northridge, CA
Emphasis: Business Real Estate
2014 – present Expected graduation 2016 under Business real estate
Volunteer Experience
Took part in Friendship Baptist church feeding the homeless as a food server 2012-2013
Participated in the elderly care program socializing with the elderly and helped feed them during
breakfast and lunch 2011
Prom layout model for Friars Tux
Interests / Activities
Member and captain of the NCAA Division 1 Cal State Northridge volleyball team
Past member of Yorba Linda High volleyball team
Past member of student body in high school
Computer Skills
Proficient with Microsoft Word, knowledge of Excel, Power Point, and Access and working
keyboard operated cash registers
8330	RESEDA	BLVD.																																																																																					COMMERCIAL	APPRAISAL	
GROUP 3	 					71


Luis D. Morales
18400 Prairie Street Apt 210 Northridge, CA 91325
661-575-7017 ◦ colldm1990@yahoo.com
Skills
-Fluent Spanish speaker
Certifications
-Excel 2013 Essential Training
Work History
-(2011-2013) AV Car Wash Inc. / Mobil 1 Lube Express
Position: Sales/Technician
Duties: Advising customer on products offered, sales, performing
service work orders as need
-(2014-Present) AutoZone
Position: Commercial Sales Representative (CSR)
Duties: Advising customers on products offered, sales, and delivery of part orders to
commercial accounts.
Education
-2012-2014
Antelope Valley College (AVC)
- Major: Accounting
- Dean’s List Spring 2014
-2014-Present
California State University Northridge (CSUN)
- Major: Finance
8330	RESEDA	BLVD.																																																																																					COMMERCIAL	APPRAISAL	
GROUP 3	 					72


Tamus J. Glunz
PO Box 2022 Lompoc, CA 93438
Email: gdayluv@juno.com Phone: (805) 588-6113
Objective: To obtain as an intern in the Real Estate field of Appraisal or Commercial Real
Estate.
Education:
California State University Northridge (CSUN), Northridge, CA
Bachelor of Science Degree in Business Administration May
2016
• Major in Real Estate and Minor in Business Law
Allan Hancock College, Lompoc and Santa Maria, CA
65 units in Business Administration 2006 to 2013
• Certificate of Achievement CSU General Education Breadth
• Certificate Transfer Recognition Award
Santa Barbara City College, Santa Barbara, CA 1983
to 1985
51 units in Engineering/Electronic Technology
Fresno City College, Fresno, CA 1975 to 1978
62 units in Liberal Arts
Experience:
Financial Specialist Jan. 2008 to Dec.
2008
Mission Oaks Mortgage, Lampoc, CA
• Analyzed data to advise and recommend solutions, utilizing knowledge of theory,
principles and field of specialization
• Consulted with Brokers, Appraisers, Underwriters, and Real Estate Agents
• Advised and consulted clients on alternate methods of solving needs/problems and
recommended specific solutions
Owner 1988 to 2009
Gypsy Property Management, Lompoc, CA
• Managed residential real estate properties for clients
• Discussed and drafted agreements/terms for providing management services including
negotiating costs for services
• Prepared leases/rental agreements for clients and collected specified rents and impounds
• Arranged for alterations, maintenance, upkeep, and reconditioning of property
• Employed services from security, maintenance and grounds keeping personnel as needed
• Trained staff for various job duties
• Assisted with eviction of tenants
8330	RESEDA	BLVD.																																																																																					COMMERCIAL	APPRAISAL	
GROUP 3	 					73


Director of Sales 2004 to 2006
McNall's Ceiling Pro & Painting, Santa Barbara, CA
• Created marketing and advertising designs by using photography, computer and
telephone programs
• Provided professional painting services for city, state, and federal organizations as well as
home owners and private corporations
• Joined Santa Barbara Chamber of Commerce and Contractors Association to create a
stronger network for wider-based clientele
Census Enumerator 2000 to 2005
United States Census, Santa Maria, CA
• Read maps, processed paperwork, and performed door-to-door census of private
information for funding distribution
• Promoted to crew leader assistant to handle special assignments
• Operated and mastered special federal computerized machinery and applications
Letter Sorting Machine Clerk 1988 to 2006
United States Postal Service, Goleta, CA
• Trained new and existing coworkers
• Performed computer research and trained in various computer programs
• Provided customer service over the phone and in person
Skills and Extra-curricular Activities:
• President/Founder of Matador Food Bank (CSUN) 2013 to present
• Student of Educational Opportunity Program/TRIO (CSUN) 2013
to 2016

Commercial Building Appraisal

  • 1.
    APPRAISAL OF REALPROPERTY LOCATED AT: 8330 Reseda Blvd. Northridge CA, 91324 FOR: Professor Calnan & Associates BY: Nathan Newman Tamus Glunz Luis Morales Damani Lenore DATE OF VALUTATION: May 15, 2016 DATE OF INSPECTION: May 15, 206 DATE OF REPORT: May 15, 2016
  • 2.
    Xi May 15, 2016 DearMr. Calnan and Associates: At your request and authorization, Group 3 has prepared an appraisal of the market value of the referenced property. Our analysis is presented in the following report. The subject property is located along the Reseda Blvd. just North of Roscoe Blvd. and South of Chase St. The 405 freeways are 2 miles to the East and the 101 Freeway entrance is 4 miles South of the subject property. The subject is a .787-acre, or 34,282 square foot rectangular shaped, unit of land containing one parcel. The parcel is improved with 12, 860 square feet of frame, stucco masonry block consisting of small offices and storage rooms. The improvements were constructed in 1986. The improvements square footage has been taken from records in the Los Angeles County Assessor’s office. The subject is currently zoned general commercial (C-2). The subject property is further described legally and psychically within the enclosed report. Based on the analysis contained in the following report, the market value of the subject is as follows: Market Value Conclusion Appraisal Premise Interest Appraised Date of Value Value Conclusion " As Is" Fee Simple Estate May 15th 2016 $4,650,000 Data, information and the calculations leading to this value are incorporated in the following letter. The report, including all assumptions is inseparable from this letter. Group 3 Appraisal Firm, Nathan Newman Luis Morales Damani Lenore Tamus Glunz
  • 3.
    Xii Table of Contents Letterof Transmittal………………………………………………………………Xi Table of Contents………………………………………………………………...Xii Summary of Salient Data and Conclusion…………………………………………4 Certification………………………………………………………………………..6 Assumptions and Limiting Conditions Introduction……………………………....8 Overview of General Area- Los Angeles City……………………………………19 Overview of Immediate Area……………………………………………………..29 Overview of Market……………………………………………………………….36 Site Analysis……………………………………………………………………....38 Analysis and Data…………………………………………………………………45 Addenda…………………………………………………………………………...66
  • 4.
    8330 RESEDA BLVD. GROUP3 4 SUMMARY OF SALIENT DATA AND CONCLUSIONS Property Type: Multi-Tenant Office Building Property Location: 8330 Reseda Boulevard, Reseda, CA Property Type: Two-story office building with two elevators Purpose of Appraisal: Market Value Estimate Property Rights: Leased Fee Estate Date of Valuation: May 15, 2016 Date of Inspection: May 15, 2016 Date of Report: May 15, 2016 Owner of Record: 8330 Reseda Blvd, Northridge LLC Land Description: APN: 2786022026 Net Land Area: 34,278.7 SF Orientation: Total Frontage Shape: Rectangular Topography: Flat Zoning: C2 and P – 1VL, Commercial District Utilities: Service to utilities Flood Zone: C 060137 0043C, dated May 5, 1999 Earthquake Zone: 8.4km away from the Northridge fault line Buildings Description: Building Area: 12,860 Gross SF / 12,860 Rentable SF Construction: Steel beam and concrete with brick facing Building Height: Two-Story Building Year Built: 1986 Quality/Condition: Good / Good On-Site Parking: 62 Spaces (4.82 spaces/1,000SF) Elevator/Staircases: Two Elevators / Two Staircases Common Area: Parking, Restrooms, and Walkways
  • 5.
    8330 RESEDA BLVD. COMMERCIAL APPRAISAL GROUP 3 5 Highest & Best Use: As If Vacant: Multi Tenant Office Building As Improved:Multi Tenant Office Building Exposure Time: 7. 5 months To find the estimated exposure time of the subject property we first identified what the market exposure time was. An exposure time is the number of days a property has been on the market before it was sold. We found 27 comparable properties in the Los Angles country area and identified the number of days they were on market. We found the average exposure time of these 27 comparable sales to be 222.37 days on market. Based on these findings we believe it will take about 7 and one half months to sell the subject property. Extraordinary Assumptions The Los Angeles County Assessor’s office estimates the gross site area to be .787 acres or 34281.72 square feet. We reserve the right to amend this valuation if subsequent land area survey indicates a different land area than that which is utilized in this report.1 Hypothetical Conditions None noted 1 "ZIMAS." ZIMAS. N.p., n.d. Web. 15 May 2016.
  • 6.
    8330 RESEDA BLVD. COMMERCIAL APPRAISAL GROUP 3 6 Certification of the Appraisers We certify: That we have performed an inspection of the subject property on May 15, 2016 and have considered all of the pertinent facts affecting the value represented in this appraisal report. That all market data pertaining to the value estimates has been accumulated from various sources, where possible, personally examined and verified as to the details, motivations and validity. That we have no present or contemplated future interest in the property appraised and neither is there any personal interest or bias with respect to the subject matter or to the principals involved. That our analyses, opinions and conclusions were developed, and this report was prepared, in conformity with the Uniform Standards of Professional Appraisal Practice ("USPAP") and in accordance with the regulations developed by the Lender's Federal Regulatory Agency as required by FIRREA. That our compensation is not contingent upon the reporting of predetermined values or direction in value that favors the cause of the client, the amount of the value estimate, the attainment of a stipulated result, or the occurrence of a subsequent event. That this appraisal assignment was not based on a requested minimum valuation, a specific valuation or the approval of a loan. That to the best of our knowledge and beliefs, the statements of fact contained in this report, upon which the analyses, opinions and conclusions are based, are true and correct, subject to the Statement of Basic Assumptions and Limiting Conditions herein set forth. That this appraisal report sets forth all limiting conditions (imposed by the terms of our assignment of by the undersigned) affecting the analyses, opinions and conclusions expressed. No one other than the undersigned persons has provided assistance in preparing the report.
  • 7.
    8330 RESEDA BLVD. COMMERCIAL APPRAISAL GROUP 3 7 That our analyses, opinions and conclusions were developed, and this report has been prepared, in conformity with the requirements of the Code of Professional Ethics and the Standards of Professional Practice of the Appraisal Institute. This appraisal report has been prepared in its entirety and without bias, in conformity with and subject to the requirements of the Code of Ethics of the Appraisal Institute. The appraisers are competent to complete this report in accordance with the competency provision in USPAP. The use of this appraisal report is subject to the requirements of the Appraisal Institute relating to review by its duly authorized representatives. The appraiser has not given consideration to any on-site personal property either owned or leased by the tenants and/or the owner of the subject property. This appraisal is a summary report, which is intended to comply with the reporting requirements set forth under Standards Rule 2-2 (b) of the Uniform Standards of Professional Appraisal Practice. As such, this report contains summarized documentation and discussion required to identify and describe the real estate being appraised, as well as a summary description of the physical and functional characteristics of the property. Disclosure of the contents of the appraisal report is governed by the bylaws and regulations of the Appraisal Institute. In furtherance of the arms of the Institute to members, we may be required to submit authorized committees of said Institute, copies of this report and any subsequent changes or modifications thereof. In our opinion, the estimated the Leased Fee “As Is” Market Value of the subject property, which represents a multi-tenant office building, built in 1986, totaling 12,860 gross square feet, and 12,860 rentable square feet, situated on 34,279 square feet of land, situated at 8330 Reseda Boulevard in Reseda, as of May 15, 2016 is as follows: Market Value Conclusion Appraisal Premise Interest Appraised Date of Value Value Conclusion " As Is" Fee Simple Estate May 15th 2016 $4,650,000
  • 8.
    8330 RESEDA BLVD. COMMERCIAL APPRAISAL GROUP 3 8 Assumptions and Limiting Conditions 1. No responsibility is assumed for legal descriptions or for matters including legal or title consideration. Title to the property is assumed to be good and marketable unless otherwise stated. 2. The property is appraised as though free and clear of any or all liens or encumbrances unless otherwise stated. 3. Unless otherwise stated in this report, the existence of hazardous material, which may or may not be present on the property, was not observed by the appraisers. The appraiser is not qualified to detect such substances. The presence of substances, such as asbestos, urea-formaldehyde foam insulation, or other potentially hazardous materials may affect the value of the property. The value estimates are predicated on the assumption that there is no hazardous materials on or in the property exist that would cause a loss in value. The subject site is assumed to be free and clear of the same. 4. Please understand that we are not experts in the toxic/hazardous substance field. While every effort has been made to observe and potential toxic waste hazards, we are not qualified to make a determination as to their existence. If any hazards exist and the costs to cure these toxic problems have been estimated, these costs should be deducted from the final value estimate in this report. We have appraised the subject site free of any toxic/hazardous materials. 5. Rentable square footage information for the subject property improvements is based on information provided by the property owner via a current rent roll. Land and gross building square footage information is based upon information obtained in public records from the Los Angeles County Assessor. We have deemed all information with regards to the physical measurements as accurate and correct. 6. Responsible ownership and competent property management are assumed. 7. It is assumed that there is full compliance with all-applicable federal, state and local environmental regulations and laws unless noncompliance is stated, defined and considered in the appraisal report.
  • 9.
    8330 RESEDA BLVD. COMMERCIAL APPRAISAL GROUP 3 9 8. It is assumed that all applicable zoning and use regulations and restrictions have been complied with, unless nonconformity has been stated, defined and considered in the appraisal report. 9. It is assumed that all required licenses, certificates of occupancy, consents, or other legislative or administrative authority from any local, state or national government or private entity or organization have been or can be obtained or renewed for any use on which the value estimate contained in this report is based. 10. The information furnished by others is believed to be reliable. No warranty is expressed or implied as to its accuracy. 11. The allocations of the total valuation between land and improvements (if any), applies only under the program of utilization stated in this report. Our reported market value is for the total property as appraised and no attempt has been made to evaluate any fractional interests, should they exist. 12. All engineering is assumed to be correct. The plot plans and illustrative material in this report are included only to assist the reader in visualizing the property. 13. It is assumed that there are no hidden or unapparent conditions of the property, subsoil, or structures that render it more or less valuable. No responsibility is assumed for such conditions or for arranging engineering studies that may be required to discover them. 14. It is assumed that the utilization of land and improvements is within the boundaries of property lines of the property described and that there is no encroachment or trespass unless noted in the report. 15. Statement of Policy - The following statement represents official policy of the Appraisal Institute with respect to neighborhood analysis and the appraisal of real estate: a. It is improper to base a conclusion or opinion of value upon the premise that the racial, ethnic or religious homogeneity of the inhabitants of an area or of a property is necessary for maximum value. b. Racial, religious, and ethnic factors are deemed unreliable predictors of value trends or price variance. c. It is improper to base a conclusion or opinion of value, or a conclusion with respect to neighborhood trends, upon stereotyped or biased presumptions relating to race, color, religion, sex, or national origin or upon unsupported presumptions
  • 10.
    8330 RESEDA BLVD. COMMERCIAL APPRAISAL GROUP 3 10 relating to the effective age or remaining life of the property or the life expectancy of the neighborhood in which it is located. 16. We have not reviewed a current preliminary title report, for the subject property. However, based upon our inspection of the subject property, we are of the opinion that there are no negative encroachments or other special hazards that might adversely affect the utility or marketability of the subject property. The only encroachments found were normal utility easements and access easements. The subject is assumed to be free and clear of the same of any potential encumbrances, which may negatively impact the subject property. 17. Flood maps used by the appraisers are issued by the National Flood Insurance Program; the appraisers have no responsibility as to the accuracy of these maps. The owner or lender should be aware of the potential for flooding in low lying areas and the responsibility to purchase flood insurance if needed for the protection of the property. 18. The subject site lies in an area of very frequent geological activity, particularly earthquakes, along with an overwhelming majority of Southern California. As such, earthquakes can occur at the subject's location at any time. The possible future effect of earthquake damage to the subject property has not been considered in the values set forth in this report, except as measured by comparable sales of properties that may be subject to the same hazard. 19. This report assumes the condition of the subject property has not changed from the date of inspection to the date of our valuation. 20. This appraisal report has been made with the following general limiting conditions: a. The distribution, if any, of the total valuation in this report between land and improvements applies only under the stated program of utilization. The separate allocations for land and buildings must not be used in conjunction with any other appraisal and are invalid if so used. b. Possession of this report, or a copy thereof, does not carry with it the right to publication. It may not be used for any purpose by any person other than the party to whom it is addressed without the consent of the appraiser, and in any event only with proper written qualification and only its entirety.
  • 11.
    8330 RESEDA BLVD. COMMERCIAL APPRAISAL GROUP 3 11 c. The appraisers herein by reason of this appraisal are not required to give further consultation, testimony, or be in attendance in court with reference to the property in question unless arrangements have been previously made. d. Neither all of any part of the contents of this report (especially any conclusions as to value or the identity of the appraiser) shall be disseminated to the public through advertising, public relations, news, sales, or other media without the prior written consent and approval of the appraiser. e. The liability of the appraisers is limited to the client only and to the fee actually received by the appraiser. Further, there is no accountability, obligation or liability to any third party. If this report is placed in the hands of anyone other than the client, the client shall make such party aware of all limiting conditions and assumptions of the assignment and related discussion. The appraisers are in no way to be responsible for any costs incurred to discover or correct any deficiencies of any type present, physically, financially and/or legally. 21. The Americans with Disabilities Act (ADA) became effective January 26, 1992. We have not made a specific compliance survey and analysis of the subject property to determine whether or not they are in conformity with the various detailed requirements of the ADA. It is possible that a compliance survey of the properties, together with a detailed analysis of the requirements of the act, could reveal that the properties are not in compliance with one or more of the requirements of this act. The appraisers, however, are not qualified to determine such requirements or conditions. The value estimates provided in this appraisal report are predicated on the assumption that there are no characteristics of the properties, which would cause a loss in value due to a failure or comply with the Americans with Disabilities Act (ADA). No responsibility is assumed for any such conditions, or any expertise or engineering/architectural knowledge, which may be required to discover them. 22. In this appraisal report, we have utilized two of the three traditional approaches to value, the Sales Comparison Approach and the Income Capitalization Approach. The Cost Approach was not utilized for the following reasons: a. The Cost Approach is predicated on the assumption that the market value of the subject property is equivalent to the land value plus current construction costs less
  • 12.
    8330 RESEDA BLVD. COMMERCIAL APPRAISAL GROUP 3 12 depreciation, which is not always reliable, since the estimation of depreciation is subjective. b. The Cost Approach is not intrinsically suited to render an opinion of value for investment properties, since construction costs plus land are not always equivalent to market value. c. The omission of the Cost Approach, when appraising an investment property such as the subject property, does not result in a misleading value estimate. The Cost Approach is typically not relied upon by investors and buyers in the marketplace; the Sales Comparison Approach and the Income Capitalization Approach are the traditional approaches utilized in the marketplace. Introduction Identification of the Property The subject property represents a multi-tenant office building, situated at 8330 Reseda Boulevard in Reseda, California. The subject property includes a multi-tenant office building, built in 1986. The improvements are two-stories in height and total 12,860 gross and 12,860 rentable square feet; the improvements are situated on 34,279 SF of commercial land with 62 on-site parking spaces (4.82 spaces per 1,000 SF of building area). As of the date of valuation, the subject property was 100% occupied. Purpose of the Report The purpose of this report is to estimate the “As is” market value, as of May 15, 2016. Intended Users The appraisal is for the use of Professor Calnan and his partners. The purpose of this appraisal is to determine the true market value of this property in pursuit of a real estate loan. The appraisal will calculate the market value of the property located at 8330 Reseda Blvd. Northridge, CA
  • 13.
    8330 RESEDA BLVD. COMMERCIAL APPRAISAL GROUP 3 13 91324. The intended use of this property is multiple tenant offices. The appraisal date is the same day of inspection, May 10th 2016. Property Rights Appraised The property rights appraised in the context of this appraisal will be the leased fee estate. Leased Fee Estate defined as the full ownership interest held by the lessor regardless of the duration of the lease or of the specified rent.2 Historic Ownership Information The subject property is currently held by 8330 Reseda Blvd LLC. The property is not available for sale and has not been sold or transferred within the last five years. 8330 Reseda Blvd. LLC acquired this property in 1986 Scope of the Report The scope of this report included the process of data gathering, data analysis and valuation. Data Gathering The data-gathering phase of this assignment included interviews with employees with the Planning and Building & Safety Departments of the City of Los Angeles, real estate brokers and developers specializing in office buildings and investment properties in the region. Documents pertaining to the appraisal assignment such as a site plan, grant deeds, assessor plat maps, existing rent roll and other pertinent documentation related to the subject property were also gathered and analyzed. The subject property was inspected on May 15, 2016 to gather data concerning the physical features, as well as surrounding neighborhood influences. Rentable square footage information for the subject property improvements is based on information provided by the property owner 2 The Appraisal of Real Estate. 13th ed. N.p.: Appraisal Institute, n.d. Print.
  • 14.
    8330 RESEDA BLVD. COMMERCIAL APPRAISAL GROUP 3 14 via a current rent roll. Land and gross building square footage information is based upon information obtained in public records from the Los Angeles County Assessor. We have deemed all information with regards to the physical measurements as accurate and correct. Discussions with agents and property owners in the immediate area were conducted to obtain positive and negative influences, market trends, land, sales and rent comparables. Such comparables were also gathered from sources such as Costar Group Inc., Axiom, First American and real estate agents active in the general area. Those comparables considered most appropriate were identified and verified by discussions with individuals involved in the transaction (owner, buyer, seller, or broker). Hence, information regarding the subject, the general area, and its neighborhood have been collected and analyzed to determine the subject's highest and best use as if vacant, and as improved. Data Analysis: Initially, overall factors relating to interest rates, employment and demographics were explored and encompasses in the overall valuation process. Market data, sales, and rentals were adjusted for physical and locational equivalence to the subject thereby developing indications for market value via the Sales Comparison and Income Capitalization Approaches. Valuation This appraisal report utilizes the two of the three traditional approaches to value, which are summarized below, but also discussed in greater detail in the Appraisal Methodology section of this report. The Cost Approach was not utilized for the following reasons: • The Cost Approach is predicated on the assumption that the market value of the subject property is equivalent to the land value plus current construction costs less depreciation, which is not always reliable, since the estimation of depreciation is subjective. • The Cost Approach is not intrinsically suited to render an opinion of value for investment properties, since construction costs plus land are not always equivalent to market value. • The omission of the Cost Approach, when appraising an investment property such as the subject property, does not result in a misleading value estimate. The Cost Approach is typically not relied upon by investors and buyers in the marketplace; the Sales Comparison Approach and the Income Capitalization Approach are the traditional approaches utilized in the marketplace.
  • 15.
    8330 RESEDA BLVD. COMMERCIAL APPRAISAL GROUP 3 15 Sales Approach: Includes the valuation of the subject property, via an analysis of comparable buildings, which have sold in the subject’s general area. Income Approach: Valuation of the subject property based on the existing improvements through direct capitalization analysis. This analysis includes estimates of annual rents, vacancy and collection loss rate, operating expenses, and the capitalization of the property’s annual operating income by a market derived overall capitalization rate. We have also performed a discounted cash flow analysis on the subject property. Property Rights Appraised The property rights appraised consist of the Leased Fee Estate of the subject property. A leased Fee Estate3 is defined as an estate in which the owner of the building has given up the right to occupy. A Leased Fee Interest represents the landlord’s rights. These rights are affected by the lease rate, term, and any other conditions stipulated in the lease document. Historic and Current Ownership 8330 Reseda Blvd, Northridge LLC, owns the subject property. To our best knowledge, the subject property is not available for sale and has not been sold or transferred within the past five years. Exposure Time / Marketing Period The Uniform Standards of Professional Appraisal Practice requires an analysis of exposure period. According to the Dictionary of Real Estate Appraisal, Third Edition, published by the Appraisal Institute, exposure time* is defined as: " The time a property remains on the market. The estimated length of time the property interest being appraised would have been offered on the market prior to the hypothetical consummation of a sale at market value on the effective date of the appraisal; a retrospective estimated based upon an analysis of past events assuming a competitive and open market. Exposure time is always presumed to occur prior to the effective date of the appraisal. The overall concept of reasonable exposure encompasses not only adequate, sufficient and 3
  • 16.
    8330 RESEDA BLVD. COMMERCIAL APPRAISAL GROUP 3 16 reasonable time, but also adequate, sufficient and reasonable effort. Exposure time is different for various types of real estate and value ranges and under various market conditions.” According to the Dictionary of Real Estate Appraisal, Third Edition, published by the Appraisal Institute, marketing period* is defined as: " The time is takes an interest in real property to sell on the market subsequent to the date of an appraisal. It is an estimate of the amount of time it might take to sell an interest in real property at its estimated market value during the period immediately after the effective date of appraisal; the anticipated time required to expose the property to a pool of prospective purchasers and to allow appropriate time for negotiation, the exercise of due diligence, and the consummation of a sale at a price supportable by concurrent market conditions.” Glossary of Terms Assessed Value- Assessed value applies in ad valorem taxation and refers to the value of a property according to the tax rolls. Assessed value may not conform to market value, but it is usually calculated in relation to a market value base4 Effective Rent- The rental rate net of financial concessions such as periods of no rent during the lease term; may be calculated on a discounted basis, reflecting the time value of money, or on a simple, straight-line basis.5 Extraordinary assumption- An assumption directly related to a specific assignment, which, if found to be false, could alter the appraiser’s opinions or conclusions. Extraordinary assumptions presume as fact otherwise uncertain information about physical, legal, or economic 4 The Property (Ad Valorem) Tax - FindLaw." Findlaw. N.p., n.d. Web. 15 May 201 5 TheFreeDictionary.com. N.p., n.d. Web. 15 May 2016.
  • 17.
    8330 RESEDA BLVD. COMMERCIAL APPRAISAL GROUP 3 17 characteristics of the subject property; or about conditions external to the property such as market conditions or trends; or about the integrity of data used in an analysis Fee simple estate - Absolute ownership unencumbered by any other interest or estate, subject only to the limitations imposed by the governmental powers of taxation, eminent domain, police power, and escheat.6 Going Concern Value- Going concern value is the value of a proven property operation. It includes the incremental value associated with the business concern, which is distinct from the value of the real estate only. Going concern value includes an intangible enhancement of the value of an operating business enterprise, which is produced by the assemblage of the land, building, labor, equipment, and marketing operation. This process creates an economically viable business that is expected to continue. Going concern value refers to the total value of a property, including both real property and intangible personal property attributed to the business value.7 Hypothetical Condition - That which is contrary to what exists but is supposed for the purpose of analysis. Hypothetical conditions assume conditions contrary to known facts about physical, legal, or economic characteristics of the subject property; or about conditions external to the property, such as market conditions or trends; or about the integrity of data used in an analysis. See also extraordinary assumption.8 Investment Value- the value of an investment to a particular investor based on his or her investment requirements. In contrast to market value, investment value is. Value to an individual, 6 TheFreeDictionary.com. N.p., n.d. Web. 15 May 2016. 7 Real Estate Terms, Definitions and Dictionary." In Plain English. N.p., n.d. Web. 15 May 2016. 8 Real Estate Terms, Definitions and Dictionary." In Plain English. N.p., n.d. Web. 15 May 2016.
  • 18.
    8330 RESEDA BLVD. COMMERCIAL APPRAISAL GROUP 3 18 not value in the marketplace. Investment value reflects the subjective relationship between a particular investor and a given investment.9 Leased fee estate - An ownership interest held by a landlord with the right of use and occupancy conveyed by lease to others. The rights of the lessor (the leased fee owner) and the leased fee are specified by contract terms contained within the lease.10 Market Rent - The most probable rent that a property should bring in a competitive and open market reflecting all conditions and restrictions of the specified lease agreement including term, rental adjustment and revaluation, permitted uses, use restrictions, and expense obligations.11 Market Value - Market value is differentiated from other types of value in that it is created by the collective patterns of the market. Market value means the most probable price which a property should bring in a competitive and open market under all conditions requisite to a fair sale, the buyer and seller each acting prudently and knowledgeably, and assuming the price is not affected by undue stimulus.12 Use Value - Use value is a concept based on the productivity of an economic good. Use value is the value a specific property has for a specific use. Use value focuses on the value the real estate contributes to the enterprise of which it is a part, without regard to the property’s highest and best use or the monetary amount that might be realized upon its sale.13 9 Rattermann, Mark. The Student Handbook to the Appraisal of Real Estate, 13th Edition. Chicago: Appraisal Institute, 2009. Print. 10 Rattermann, Mark. The Student Handbook to the Appraisal of Real Estate, 13th Edition. Chicago: Appraisal Institute, 2009. Print. 11 TheFreeDictionary.com. N.p., n.d. Web. 15 May 2016. 12 Real Estate Terms, Definitions and Dictionary." In Plain English. N.p., n.d. Web. 15 May 2016. 13 The Property (Ad Valorem) Tax - FindLaw." Findlaw. N.p., n.d. Web. 15 May 201
  • 19.
    8330 RESEDA BLVD. COMMERCIAL APPRAISAL GROUP 3 19 LA County Overview Los Angeles County spans over 4,000 square miles and is home to over 10 million people. Over the past years LA County has experienced an increase in population, mean income, migration, number of college graduates, and a decrease in its unemployment rate. Population Los Angeles County over the past years has had on average a population size of about 10 million individuals. With an average population change of about 0.73 percent year over year. Spanning over 4,000 miles in size this gives LA County a population density of around 2,500 individuals per square mile.14 14 "Census.gov." Census.gov. N.p., n.d. Web. 13 Mar. 2016.
  • 20.
    8330 RESEDA BLVD. COMMERCIAL APPRAISAL GROUP 3 20 The preceding chart illustrates the trend in population for LA County. The chart describes an upward trend in population numbers for LA County. From the beginning point of the year 2000 LA County population stood at 9.54 million individuals. At the end year of 2014 the population stood at 10.12 million individuals, an overall 6 percent change from 2000 to 2014. Taking into account that populations are not static and move from place to place the net migration of the LA County population was taken into consideration and the following was found. On average over a six-year period, from 2010-2015, a net migration of 5,312 individuals left LA County. Of those who left, the vast majority moved to neighboring Counties such as San Bernardino and Ventura County. From 2010 to 2015 a total of 40,819 individuals left LA county. LA County has seen an influx of migrants from 2013-2015, totaling 8,948 individuals.15 To better represent these findings the following is offered: 15 "Census.gov." Census.gov. N.p., n.d. Web. 13 Mar. 2016. 9.5 9.6 9.7 9.8 9.9 10 10.1 10.2 1998 2000 2002 2004 2006 2008 2010 2012 2014 2016 Popula[on in Millions Year LA County Popula[on
  • 21.
    8330 RESEDA BLVD. COMMERCIAL APPRAISAL GROUP 3 21 To better understand this net migration during its peak in 2006 (not represented in the date above) about 141,000 individuals opted to leave LA County during the height of the real estate market collapse. The goal here is to show the recovery or the positive influx of individuals into LA County, signifying a steady recovery. Education LA County is dense with institutions dedicated to higher learning. Out of the 10 million individuals residing in LA County the median age is 35 years old and has been steadily increasing over the past five years. In terms of education, the vast majority of individuals that hold a bachelor’s degree or higher tend to be around the age of 25-44; Accounting for about 66 percent of the total bachelor degrees or higher. Indicating that most of the young individuals that reside within the county hold a degree of higher education. Establishing a base for highly skilled and qualified individuals, from which to build a labor force from. 2010 2011 2012 2013 2014 2015 Net Migra[on (18,621) (14,447) (7,751) 1,671 3,305 3,972 (20,000) (15,000) (10,000) (5,000) - 5,000 10,000 Number of Migrants Net Migra1on
  • 22.
    8330 RESEDA BLVD. COMMERCIAL APPRAISAL GROUP 3 22 Employment Statistics LA County consists of a vast geographical area that can accommodate a diverse set of industries. Since 2010 the health care industry has been one of the largest employers in LA County, followed by government agencies, and leisure and hospitality. The health care industry from 2010-2014 has accounted for an average employment number of about 564,000 individuals and had an increase of 4.09 percent in employment numbers during that time. Government workers have accounted for 560,000 individuals of the total workforce from 2010-2014, but the government sector has experienced a 1.4 percent decrease in its employment numbers over the same time period. Leisure and Hospitality has employed an average of 416,000 workers over 2010-2014 and has experienced a 3.8 percent increase in employment rate during that period of time.16 16 Los Angeles." U.S. Bureau of Labor Statistics. U.S. Bureau of Labor Statistics, n.d. Web. 10 Mar. 2016. 0.0% 5.0% 10.0% 15.0% 20.0% 25.0% 30.0% 35.0% 40.0% 18-24 25-34 35-44 44-64 65< Percent Scale Age Group 4 Year Degree or Higher percentage
  • 23.
    8330 RESEDA BLVD. COMMERCIAL APPRAISAL GROUP 3 23 Throughout 2010 and 2014, LA County has experienced both gains and losses in employment numbers in its major industries. The chart above illustrates the trend among the largest employers in LA County. The construction sector saw the largest gain in employment during the 2010-2014-time period, increasing an average of 4.55 percent. The second largest growth in employment was in the admin & support sector, which saw an increase of 4.35 percent. Lastly the natural resources sector increased its employment rate by 4.1 percent. Manufacturing nondurable, government, and manufacturing saw the largest decreases in employment rates. During the 2010-2014-time period these sectors lost on average 1.77 percent, 1.42 percent, and 1.27 percent in employment rates.17 In terms of unemployment, no are A was left unaffected by the real estate market collapse of 2007-2008. LA County saw its highest unemployment rates and it also saw its highest migration rates out of LA County. The following chart illustrates the LA County unemployment rate during this 2000-2014 period: 17 "U.S. Bureau of Labor Statistics." U.S. Bureau of Labor Statistics. U.S. Bureau of Labor Statistics, n.d. Web. 13 Mar. 2016. 0 100 200 300 400 500 600 700 Jobs in Thousands Industries 2010 2011 2012 2013 2014
  • 24.
    8330 RESEDA BLVD. COMMERCIAL APPRAISAL GROUP 3 24 From the year 2000 up until 2010 the unemployment rate increased by an average rate of 174 percent. Since its peak, the unemployment rate has exhibited a decreasing trend, with its largest drop of about 17 percent occurring during 2012-2013. Household Income Forecast LA County over the past five years has seen a 0.77 percent increase in household income annually. The most current figure puts LA County’s average income at around $82,000. Throughout 2010-2014, LA County has seen an increase of about 3 percent in its mean income. 0 2 4 6 8 10 12 14 1998 2000 2002 2004 2006 2008 2010 2012 2014 2016 Unemployment Rate Year Los Angeles County Unemployment Rate
  • 25.
    8330 RESEDA BLVD. COMMERCIAL APPRAISAL GROUP 3 25 Area Development When observing residential and nonresident housing permits, a positive trend can be found that depicts the number of housing permits issued has been on a rise. On average, the number of housing permits issued has been on a rise with an average increase of 27 percent annually. The largest increase of housing permits occurring during 2012-2013, with an average increase of about 57 percent. During 2013, 16,850 housing permits were issued compared to 10,709 housing permits issued in 2012. Nonresidential building permits have also seen an increase on average of 41 percent annually. The highest annual increase of about 133 percent occurred during 2012 and 2013. 1,836 nonresidential housing permits were issued in 2012 and over 4,000 nonresidential housing permits were issued in 2013.18 18 "Los Angeles County Building and Safety." Los Angeles County Building and Safety. N.p., n.d. Web. 13 Mar. 2016. $79,500 $80,000 $80,500 $81,000 $81,500 $82,000 $82,500 2009 2010 2011 2012 2013 2014 2015 Income Year LA County Mean Income
  • 26.
    8330 RESEDA BLVD. COMMERCIAL APPRAISAL GROUP 3 26 Government Influences Governmental influences are factors that are used to evaluate governmental controls and regulations, zoning requirements, and determining the value of a property. The Los Angeles County was established on February 18, 1850. It is one of the largest in the nation, accounting for approximately 27% of the California population. A five-member board of Supervisors makes up the County that was created by the State Legislature in 1852. Voters in Los Angeles County elect the board as well as an Assessor, District Attorney, and Sheriff. As a Subdivision of the state, the county is charged with providing numerous services that affects the lives of all the residents.”19 More than 65% of Los Angeles County is unincorporated with roughly 1 million people living in those areas. The Board is their city council and the supervisor representing the area is the mayor. The remaining 35% are incorporated within 88 cities each with its own council20 Crime Report After more than a decade of decline, violent crime in Los Angeles increased more than 20% during the first half of 2015, with felony assaults up 26% and robberies up 19%.21 Climate The Los Angeles area has a Subtropical Mediterranean climate.22 The temperature has increased over the years, which has led to the current drought California is in. The Los Angeles area, along with all of California, is facing serious drought issues for the last 5 years. As of April 1, 2015 the California Governor Jerry Brown imposed a mandatory 25% statewide water reduction and prohibited water uses.23 19 “Government.” Los Angeles County. N.p., n.d. Web 11 Mar. 2016 20 “Los Angeles County Department of Regional Planning.” DRP Main RSS. N.p., n.d. Web 11 Mar. 2016 21 “Los Angeles Times” August 27 th 2015 22 “Historical Weather for Los Angeles, CA, United States of America”, Weatherbase.com. 23 “Water conservation Portal – Emergency conservation Regulation.” State Water Resources Control Board. Sept. 16, 2015
  • 27.
    8330 RESEDA BLVD. COMMERCIAL APPRAISAL GROUP 3 27 According to the Western Regional Climate center, the Los Angeles area gets about 15 inches of rain each year on average.24 The average rainfall is dependent on what happens in the Pacific Ocean, located on the southern and western part of the Los Angeles area. As an example, if the Pacific Ocean experiences El Niño conditions, then it has the capability of raining a lot. However, if it doesn’t experience anything like this, then the Los Angeles area will rarely see rainfall for the winter. On average, the temperature on the southern part of the Los Angeles area and at the beach will be 2° to 7° F cooler compared to the city and county. The highest recorded temperature in Los Angeles was 113° (45°𝐶) on September 27, 2010. The lowest was 24°𝐹 (−4°C) on December 22, 1944. In 1932, 2 inches (5cm) of snow fell in downtown LA.25 Los Angeles City/County Energy & GHG LA County has one of the lowest per-capita energy uses in the nation. Renewable energy comes primarily from wind (>10%) and geothermal (5%) and utilities serving 98% of the county population exceeded the 20% renewable energy standard for 2013. Los Angeles Count GHG emissions are 30% higher than cities with comparable energy use. Coal energy is still prevalent – Azusa, Pasadena, & LADWP get 42% of their energy from coal and solar power represents less than 1% of the renewable energy sources for LA County utilities. Los Angeles County Air Quality Estimated carcinogenic risk from air toxics has dropped by 65% between 2005-2013. Since 2009, LA County has consistently met air standards for NO2, SO2, CO and lead and air emissions from Exide (now closed) and Quemetco have been reduced due to enforcement actions Nearly all areas of LA County experienced ozone standards in 2013. Fine particle pollution standards were exceeded in downtown LA and the San Fernando Valley in 2013.Highest cancer 24 Baeder, Ben. “History Shows California Subject to Extreme Droughts.” History Shows California Subject to Extreme Droughts. Whittier Daily News, Feb 15, 2014. 25 Malloy, Betsy. “Los Angeles Weather and Climate.” About.com Travel. Web 13 Mar.2016
  • 28.
    8330 RESEDA BLVD. COMMERCIAL APPRAISAL GROUP 3 28 risk areas from diesel particulate matter are near ports and transportation corridors and emissions of toxic air contaminants from industrial facilities have increased since 2009.26 Waste Production Analysis Total municipal waste generated by the County has generally decreased since 2005. All cities in LA County have successful solid waste diversion programs as required by Cal Recycle. All LA County jurisdictions appear to have met heir population-based per capita disposal targets for 2013. Total hazardous waste generated in LA County in 2013 was 2.2 million tons, >2x as much as in 2011. There is a lack of County-level data on actual quantities and final disposition of municipal waste diverted from landfills. Contaminated soils from site cleanup comprised the majority (68%) of hazardous waste in 2013. Los Angeles City/County Ecosystem Health Grade There are 41,807 acres of marine protected areas in LA County. There are 886,443 acres of protected lands in LA County. 34% of the total County land area. An additional 8% of County land is regulated to limit use or development. Over 35,000 acres of land are at high risk of vegetation type change due to over-burning. LA County has lost 96% of its total estuarine wetland area from 1850 to the present. Lows in greenness values since 2013 indicate vegetation is experiencing extreme water stress due to the drought. Urban streams throughout the County exhibit very poor function and poor biological condition. Los Angeles City/County Water No substantial violations of sewage treatment plant or industrial wastewater permits over the last 5 years. Nearly everyone in Los Angeles County has access to clean drinking water. 90% of 26 "Protecting the Health of Residents." South Coast Air Quality Management District. N.p., n.d. Web. 13 Mar. 2016.
  • 29.
    8330 RESEDA BLVD. COMMERCIAL APPRAISAL GROUP 3 29 beaches received A or B grades for Summer 13 dry weather water quality. Between 2000-2013, LA County per capita water demand dropped by 16%. Contamination of groundwater wells is prevalent countywide. One or more pollutants impair more than 85% of LA County waterways. Los Angeles County imports 58% of its water. 40% of LA County beaches received on F grade for 2013-14 wet weather water qualities.27 Los Angeles County Conclusion The Los Angeles County has a population size over 10 million people and is on the incline, making up 27% of California population. The median age in the Los Angeles County is around the age 35. Since 2010 the health care industry has been one of the biggest employers in the Los Angeles County accounting 564,000 individuals. The Los Angeles area is having an incline of nonresidential distribution of permits going from 1,836 in 2012 to over 4,000 in 2013 Location Analysis The subject being evaluated is located in the city of Northridge, in Los Angeles County and in the state of California. It is necessary to examine Los Angeles County and Los Angeles City economies for a greater understanding of the dynamic impact on the subject property. 27 "Department of Public Health." Department of Public Health. N.p., n.d. Web. 13 Mar. 2016.
  • 30.
    8330 RESEDA BLVD. COMMERCIAL APPRAISAL GROUP 3 30 Los Angeles Area Los Angeles is the second largest city in the United States and has a wide array of industries in which no one sector dominates the area. Some of the leading industries include business management services, international trade, motion picture, and technology companies. The unemployment rate of the Los Angeles metropolitan area was 5.3% in November 2015, which compares to 7.2% in November 2014 and 8.2% in November of 2013.28 City Household Income The city of Los Angeles has a large percentage of the population making a household income of less than 50 thousand per year. The median household income for the City of Los Angeles is $50,544. This figure is slightly less than the California median household income of $61,514 per year.29 Los Angeles." U.S. Bureau of Labor Statistics. U.S. Bureau of Labor Statistics, n.d. Web. 10 Mar. 2016 29 "Census.gov." Census.gov. N.p., n.d. Web. 13 Mar. 2016.
  • 31.
    8330 RESEDA BLVD. COMMERCIAL APPRAISAL GROUP 3 31 Environmental Forces The Los Angeles City transportation network is dominated by an elaborate freeway system. The major East and West traveling freeways are the Ventura Freeway 134, Hollywood Freeway US 101, Pomona Freeway 60, Century Freeway Interstate 105 and State Highway 91. The North and South traveling routes include the San Diego Freeway Interstate 405, Interstate 5, Pasadena/Harbor Freeway 110, Long Beach Freeway 710 and San Gabriel River Freeway 605. On average it takes citizens 29.3 minutes to travel to work under normal conditions. The Los Angeles department of transportation is in the process of completing a 30 year blueprint for growth related congestion and pollution. The mobility 2035 plan will add 40 miles of bike lanes along major streets within Los Angeles City limits.30 Public Rail Transportation Rail freight is provided by numerous carriers and is available throughout Los Angeles County and City. All commuter rail lines use Union Station Los Angeles as their hub. Los Angeles city is 3rd in the nation for public transit usage of cities nationwide. Constant growth will set an 30 "Los Angeles Department of Transportation." Getting Around LA : Department of Transportation : City of Los Angeles. N10 Mar. 2016. 49% 26% 17% 7% 0% 10% 20% 30% 40% 50% 60% Under 50K 50k-100K 100K-200K Over 200K Household Distribuion
  • 32.
    8330 RESEDA BLVD. COMMERCIAL APPRAISAL GROUP 3 32 initiative to service 116 Metro Rail stations by 2035. This will lead to an increase of 35% from the number of stations currently in use in 2016 (86).31 Los Angeles International Airport (LAX) Los Angeles International Airport (LAX) is one of the largest international airports in the nation by volume. LAX is a large employer for the city of Los Angeles. Historical LAX Volume statistics have been categorized below. LAX Annual Passenger Volume Year Number of Passengers Annual % Change January 2016 6,051,758.00 8.75% January 2015 5,522,056.00 1.86% January 2014 5,419,617.00 6.35% January 2013 5,075,280.00 3.16% January 2012 4,914,971.00 5.10% January 2011 4,664,231.00 1.17% January 2010 4,609,720.00 7.40% January 2009 4,268,383.00 -12.71% January 2008 4,810,815.00 As shown in the chart, passenger volume had strong numbers in January 2008 but had a slight decline in 2009. This decline was cause by the recession that occurred in 2008. The passenger volume rebounded directly after 2009 and has continued its growth into 2016.32 Los Angeles International Airport provides air transportation to Los Angeles city and surrounding areas. The airport is located northwest of the 405 San Diego Freeway and South of 105 highways. Public bus lines provide most of the public transit in the area. An alternative to 31 "Department of City Planning." Department of City Planning. N.p., n.d. Web. 13 Mar. 2016. 32 "Los Angeles World Airports Official Website." Los Angeles World Airports Official Website. N.p., n.d. Web. 13 Mar. 2016.
  • 33.
    8330 RESEDA BLVD. COMMERCIAL APPRAISAL GROUP 3 33 public bus use is the rail service provided by Blue Line. Blue line runs between downtown Los Angeles and Long Beach. The Green Line runs down the center of interstate 105.
  • 34.
    8330 RESEDA BLVD. COMMERCIAL APPRAISAL GROUP 3 34 Port Activity The Ports of Los Angeles and Long Beach are huge contributors to the national and local economy. The Los Angeles metropolitan area is heavily influenced by the economic activity generated by the Long Beach and Los Angeles ports. Activities in the ports are projected to increase new job opportunities for the area.34 Development Trends Employment in Los Angeles City is still influenced by the aerospace and defense industries; there is also a growing concentration of high technology, automotive and trade related business. Residential development in Los Angeles City ranges from low-income apartment complexes to upper-income single-family residences. The more desirable and expensive residential areas are located in the Western proximity to the Pacific coastline. Los Angeles metropolitan area has a diversified retail base with strip malls, as well as freestanding businesses. The most desirable shopping centers in the metropolitan area are The Grove, Santa Monica Place, Westside Pavilion, and Beverly Center. The Beverly Center has issued a release stating a mall renovation of $500 33 TEU – Twenty-Foot equivalent Units, Standard maritime industry measurement 34 Port of Los Angeles: America's Port®." Port of Los Angeles: America's Port®. Web. 13 Mar. 2016. Los Angeles Port Volume February Loaded Inbound (TEU)33 Loaded Outbound (TEU) Total Loaded (TEU) Annual % Change 2016 372,744.30 146,488.75 519,233.05 34.51% 2015 254,225.30 131,806.50 386,031.80 -31.04% 2014 296,537.10 263,249.25 559,786.35 -8.97% 2013 325,505.25 289,453.50 614,958.75 16.99% 2012 263,458.80 262,194.65 525,653.45 -5.27% 2011 289,163.05 265,749.75 554,912.80 5.61% 2010 274,939.80 250,518.80 525,458.60
  • 35.
    8330 RESEDA BLVD. COMMERCIAL APPRAISAL GROUP 3 35 million with a completion date of November 2018. This remodel will bring more restaurants to the area, as well as create room for several new retail stores. Demographic Analysis The Los Angeles Metropolitan area is approximately 468.67 square miles with a population per square mile of 8,092. According to the Census bureau, the city of Los Angeles sub region had a population of approximately 3.79 million in 2000 and about 4.12 million in 2008. According to the City of Los Angeles planning department the forecast from 2008 through 2030 shows an estimated additional growth of 294,000 persons. This will reflect a population growth of 7.3%.35 35 "Department of City Planning." Department of City Planning. Web. 13 Mar. 2016. 3,400,000 3,500,000 3,600,000 3,700,000 3,800,000 3,900,000 4,000,000 4,100,000 4,200,000 4,300,000 4,400,000 4,500,000 2000 2008 2010 2020 2030 Popula1on Year Popula1on Forecast for City of Los Angeles Subregion
  • 36.
    8330 RESEDA BLVD. COMMERCIAL APPRAISAL GROUP 3 36 Government The elected government of Los Angeles City is composed of 15 city council districts and the mayor of Los Angeles. The Mayor operates under mayor-council government. The Mayor Is elected and holds a 4-year term. Under California Constitution the Mayor can only serve two terms. City council is composed of 15 members who serve a 4-year term. Councilman can serve a maximum of 3 terms and these members are elected from single member districts. City of Los Angeles Conclusion The population of the city Los Angeles is at 4.12 million as of 2008. The unemployment has been going in down these past years in Los Angeles is and is at 5.3% as of November 2015. The median household income for the Los Angeles area is at $50,544 with fewer than 50% living under less $50,000 a year. Los Angeles has great deal of freeways; they accommodate multiple interstate highways and the US 101. Los Angeles accommodates one of the busiest airports in the world with other facets of transportation with bus and public rail systems. Neighborhood Analysis Opposite Reseda Blvd. west of the property is a plaza that harbors a law office and dental groups. Just south of the property on Roscoe Boulevard there is plaza dedicated to medical facilities that includes Northridge Hospital Medical Center, Dignity Health, and Lab Corp. Other than the designated hospital area, the corner of Reseda and Roscoe is populated mainly with different medical care facilities, scattered insurance offices, convenience stores, and restaurants. Going up Reseda before the train tracks there is a continuation of Class C commercial buildings that have the same business demographics as stated before. Property Surroundings East of the property is Minimum Residential housing to Very Low I Residential. Heading East for ½ mile from the property the residential briefly turns into a low medium/ Low medium I
  • 37.
    8330 RESEDA BLVD. COMMERCIAL APPRAISAL GROUP 3 37 Residential. Two miles from the Reseda and Roscoe heading two miles east there is a Light Manufacturing with a railroad, which runs through the zone, the Interstate 405 is adjacent to the Light-manufacturing zone. Going South from which the property there is a stretch of Low Medium/ Low Medium I Residential for ¾ of a mile before it returns to General Commercial zoning for 1 ¼ miles with Reseda and Sherman Way being the epicenter of this commercial zoning. At this intersection of Reseda and Sherman Way going a ½ mile each direction (north, south east and west) is General Commercial zoning. Going 3.3 Miles south from the property of 8330 Reseda is the U.S. Route 101 Freeway. The 8330 Reseda Blvd. property is located at a base where a General Commercial zone starts and continues to go north for 1-½ miles. Adjacent to the Commercial zoning is California State University, Northridge that is one mile from the appraised property. The California State Route 118 is 3- ¾ miles from the property. Reseda can get busy during the weekdays when attempting to get to the 118 State Route. The Interstate 405 connects to the State Route 118 that runs parallel to Roscoe Boulevard. There is an easy access point to enter the 118 State routes by taking Roscoe to the I-405 north entrance. Going East on Roscoe Boulevard there is a range of very Low Residential to Low Medium I Residential for 3- ¼ of a mile which then goes into a light manufacturing zone that stretches for 6 miles from the City of Chatsworth to the U.S. Route 101 Freeway Immediate Area Conclusion The property is located on a commercial zoned intersection of Reseda and Roscoe that connects to three different freeways. The area around the property is around heavily populated medical facilities. Right across the street on the corner of Reseda and Roscoe is Northridge Hospital and Medical Center. Around the area there is a collection of Low Residential housing and manufacturing zones that include a railroad system.
  • 38.
  • 39.
    8330 RESEDA BLVD. COMMERCIAL APPRAISAL GROUP 3 39 PLAT diagram found from "ZIMAS." ZIMAS. N.p., n.d. Web. 14 May 2016. Size and Shape As indicated earlier in this report, the subject property is comprised of one parcel of land as shown on the following table:APN: 27886022026 Net Land Area: 34,278.7 SF Orientation: Total Frontage Shape: Rectangular Topography: Flat Zoning: C2 and P – 1VL, Commercial District Utilities: Service to utilities Flood Zone: C 060137 0043C, dated May 5, 1999 Earthquake Zone: 8.4km away from the Northridge fault line
  • 40.
    8330 RESEDA BLVD. COMMERCIAL APPRAISAL GROUP 3 40 Street Access The subject site has 150 SF of frontage along the Reseda Blvd. There is both an entrance and exit to the subject property. Utilities All the usual and necessary public utilities are available to the subject site. Zoning The subject site is subject to the zoning jurisdiction of the City of Los Angeles. The subject site is zoned C2 and P – 1VL, Commercial District which allows under certain criteria the building possibilities of some of the following, Art or Antique shop, Bird Store, Carpenter, Plumbing, or Sheet Metal shop, Restaurant and others. Topography & Drainage The topography of the subject sites is generally level and drainage appears to be adequate. The subject property is located in Flood Zone C 060137 0043C, dated May 5, 1999 by the Flood Hazard Area Maps, published by the Federal Insurance Administration. Flood Zone C indicates an area of minimal hazard from principal sources of floods in the area. Although this zone is outside the 100-year flood zone, buildings in this zone could be flooded by severe, concentrated rainfall coupled with inadequate drainage systems. The subject site is not located in a flood hazard area in which mandatory flood insurance requirements apply. Earthquake Fault Zone The Earthquake Fault Zone (originally called the Alquist-Priolo Special Studies Zone) was enacted by the Alquist Priolo Special Studies Act, which was signed into law on December 23, 1972 and went into effect on March 7, 1973. The purpose of this act was to prohibit the location of most structures for human occupancy across the traces of active faults and to mitigate thereby, the hazards of fault ruptures. The subject property is not located in an Earthquake Fault Zone. However, it should be noted that the entire Southern California region is earthquake prone.
  • 41.
    8330 RESEDA BLVD. COMMERCIAL APPRAISAL GROUP 3 41 Soils & Geology We have not reviewed a recent soils report nor geological report for the subject site. However, based upon our inspection of the subject property and the environmental site report, prepared by Glenfos Inc. (Dated July 11, 1997), no signs of any potential detrimental hazardous material were found on the subject site. For the purposes of this appraisal, it is assumed that the soil and geologic conditions of the subject site are not unfavorable for its current use. Easements/Encroachments We have not reviewed a current preliminary title report, for the subject property. However, based upon our inspection of the subject property, we are of the opinion that there are no negative encroachments or other special hazards that might adversely affect the utility or marketability of the subject property. The only encroachments found were normal utility easements and access easements. The subject is assumed to be free and clear of the same of any potential encumbrances, which may negatively impact the subject property. Nuisances & Hazards As per the Appraisal Institutes’ Guide Note 8 of the Uniform Standards of Professional Appraisal Practice, the appraiser must note any hazardous substances or materials, which may be present at the subject property and consider them in the appraisal valuation process. We are not qualified to detect or measure hazardous materials. The existence of toxic waste hazards resulting from current or prior uses may or may not be present. While every effort has been made to observe any potential waste hazards, we are not qualified to make a determination as to their existence. If such toxic material is believed to impact the subject property in any way, the user of this appraisal is urged to contact a qualified professional trained to identify such hazards; in addition, the appraisers reserve the right to re-evaluate the impact of any potential nuisances and hazards on the final value estimate contained in this report. REAL ESTATE TAX INFORMATION We have identified the real estate tax assessments and annual real estate taxes for the previous tax year. The tax information was obtained for the subject property by its assessor’s parcel number. The direct assessments are $2,461.51 with an effective tax rate of 1.16%
  • 42.
    8330 RESEDA BLVD. COMMERCIAL APPRAISAL GROUP 3 42 The Jarvis/Gann tax initiative was passed in 1978 and limited taxes to 1% of the market value of the property. Although the assessments can be increased 2% per year, no major change in the assessment can be made unless the property transfers ownership. At that time the property may be re-assessed at the then existing fair market value. Improvement Description Description of Improvements The subject property consists of a multi-tenant office building, built in 1986. The improvements are two-stories in height and total 12,860 gross and 12,860 rentable square feet; the improvements are situated on 34,279 SF of commercial land with 62 on-site parking spaces (4.82 spaces per 1,000 SF of building area). Building Components The subject property is built-out as conventional office spaces with the exception of the dentist’s offices. The dentist’s offices have waiting areas and specialized x-ray machines and chairs utilized by the dentists. The remaining offices and common areas are conventional and have the following characteristics: Building Height: The subject property is two-stories in height, with ground level parking. Foundation: The foundation of the property consists of reinforced concrete slab on grade with continuous wall footings and spread column footings. Roof Covering: Built-up composition and plywood. Construction: Steel beam and concrete with brick facing.
  • 43.
    8330 RESEDA BLVD. COMMERCIAL APPRAISAL GROUP 3 43 Interior: The interior spaces consist of partitions constructed with wood studs covered with drywall and finished with paint. The ceilings consist of acoustic fissure panels suspended in a T-bar grid system, with recessed fluorescent and single-bulb incandescent light fixtures. The first floor bank area has a high (20 foot) ceiling with recessed can lights and wooden light soffits around the perimeter walls. Flooring: The interior flooring includes high quality vinyl tile and/¬or commercial grade carpeting. Common areas are carpeted with restrooms tiled. Elevator/Staircase: Two hydraulic elevators and two enclosed staircases. HVAC: The subject building includes a roof mounted package unit system. Common Area: Parking, restrooms and common walkways. Lighting: Most of the units include fluorescent and incandescent light fixtures. Landscaping: The landscaping consists of shrubbery and few trees in a planter that follows the walls of the building and site. Parking: There are 62 on-site parking spaces or 4.82 spaces per 1,000 SF of building area. Condition: Overall, the subject improvements are in good condition.
  • 44.
    8330 RESEDA BLVD. COMMERCIAL APPRAISAL GROUP 3 44 Effective Age/Economic Life The subject improvements were constructed in 1986. Based upon our inspection of the property, and a review of the Marshall & Swift Valuation Guide, we are of the opinion, that the subject improvements have an economic life of 50 years. According to the Dictionary of Real Estate Appraisal, published by the Appraisal Institute, the “Economic Life” of the building improvements is defined as: “The period over which the improvements to real property contribute property value.” The economic life of a structure is often not the same as the physical life and will vary due to changes in architectural styles and standards. According to the Dictionary of Real Estate Appraisal, published by the Appraisal Institute, the “Effective Age” of the building improvements is defined as: “The age indicated by the condition and utility of a structure.” The effective age of a building can be more or less than its actual or chronological age, depending upon the maintenance and care of the improvements, in addition, to the conformity of the improvements to the surrounding land uses. Based upon the property’s present condition, the property has an effective age of 10 years, with a remaining life of 40 years.
  • 45.
    8330 RESEDA BLVD. COMMERCIAL APPRAISAL GROUP 3 45 Analysis of Data Highest and Best Use According to the Dictionary of Real Estate Appraisal, a publication of the Appraisal Institute, the highest and best use may be defined as: • The reasonable and probable use that supports the highest present value of vacant land or improved property, as defined, as of the date of appraisal. • The reasonable, probable and legal use of land or sites as though vacant, found to by physically possible, appropriately supported, financially feasible and that results in highest present land value. • The most profitable use. The highest and best use of a specific parcel of land does not depend on subjective analysis by the property owner, the developer, or the appraiser. Rather, the highest and best use is shaped by the competitive forces within the market where the property is located. Therefore, the analysis and interpretation of highest and best use is an economic study of market forces focused on the subject property. Implied within this definition is a recognition of the contribution of that specific use to the community environment or to the community's development goals, in addition to wealth maximization of individual property owners. In appraisal practice, the concept of highest and best use represents the premise upon which value is based. In the analysis of the highest and best use of a property, consideration is given to the physically possible uses of the site, the legally permissible uses, the financially feasible uses and the maximally productive alternatives that would provide the greatest net return to the owner under the current or projected market conditions. The first issue pertains to the physical characteristics of the site, such as size, dimensions, topography, the availability of utilities and soil conditions. The lack or impairment of any of these facts may make certain types of developments impossible. The second issue relates to the legality of an intended use. As indicated above, the community's environmental or development goals may prevent certain forms of use. The third issue pertains to the notion of economic viability. The fourth issue asks whether a proposed or existing use produces the greatest net return to the land.
  • 46.
    8330 RESEDA BLVD. COMMERCIAL APPRAISAL GROUP 3 46 Highest and Best Use As Vacant According to the Dictionary of Real Estate Appraisal, published by the Appraisal Institute, the highest and best use of a site, as if vacant is: “among all reasonable, alternative uses, the use that yields the highest present land value, after payments are made for labor, capital and coordination. The use of a property is based on the assumption that the parcel of land is vacant or can be made vacant by demolishing any improvements.” As Vacant Physically Possible The subject property sits on a lot 300ft long and 114.26ft wide. Giving the property a total area of 34,278.7 sq. ft. The property has a total frontage are of 114.26ft facing Reseda Blvd. The lots access points are located on the front of the lot facing Reseda Blvd. The lot is flat throughout, rectangular in shape, and sits 8.4 km away from the Northridge fault line. The subject has service to utilities and sufficient access to roadways. With a lot this size a multitude of uses can placed upon it. The following will list those possible uses: • Warehouse • Storage Facility (Storage units) • Manufacturing/ Industrial use • Apartment complex • Hotel • Retail Space (Single/Multi story) • Office building (Single/Multi story) • Automobile Service Area • Car Dealership • Medical use building (Single/Multi story)
  • 47.
    8330 RESEDA BLVD. COMMERCIAL APPRAISAL GROUP 3 47 Legal Permissibility The legally permissible requirement of the property, as though it were vacant, is restricted by the C2 and P-1VL, Commercial District, zoning ordinance of Northridge zoning classification of “Business Improvement District” encourages the use of the parcel (34,278 sq. ft.). These restrictions permit the parcel to be used for, warehouse, storage facility (storage units), manufacturing/Industrial use, apartment complex, hotel, retail space (single/multi story), office building (single/multi story), automobile service area, car dealership, medical use building (singe/multi story) listed in section 12.14.36 Financially Feasible The determination of financially feasible is dependent on the market demand and legally probable uses of the land. As mentioned in the market analysis the single family and multi family markets are stable. Developments of new retail and multi-tenant properties have been active in the past 3 years in the County of Los Angeles. Within the City of Los Angeles there are proposed multi-tenant, residential, offices and manufacturing in the market. Current construction activity in the area is the renovation of a 60,000 SF Class B office building at 6464 Canoga Ave in Woodland Hills. These factors indicate that it would be financially feasible to complete an office, retail or multi-tenant building on the vacant land assuming building expenses were low enough to allow a satisfactory profit for the developer. Maximum profitability The final test of highest and best use determines which use produces the maximum amount of profit. Sublet market has the highest asking rent in San Fernando Valley with signs of future growth. Office building market is also growing but low absorption rates hinder revenues with a large amount of space currently available in the market. 36 "City Charter, Rules, and Codes." City Charter, Rules, and Codes. N.p., n.d. Web. 04 Apr. 2016.
  • 48.
    8330 RESEDA BLVD. COMMERCIAL APPRAISAL GROUP 3 48 Conclusion According to the market analysis, the rental rates per square foot for sublet office buildings are going up and vacancy is going down. As vacant, the subject property should be used as a multi tenant office building that will be constructed immediately. Potential buyers will be an investors or developers. Highest and Best Use As Improved According to the Dictionary of Real Estate Appraisal, published by the Appraisal Institute, the highest and best use of a site, as improved is: “The use that should be made of a property as it exists. An existing property should be renovated or retained as is, so long as it continues to contribute to the total market value of the property, or until the return from a new improvement would more than offset the cost of demolishing the existing building and constructing a new one.” As Improved Physical Characteristics The subject property’s lot is 34,278.7 sq. ft. Currently a 2 story building of 12,860 sq. ft. split between 2 floors. Comprising 18.75% of the total available space within the entirety of the lot. The building sits on the western most side of the lot, facing Reseda Blvd. flanked by an entrance and exit. The building is two stories tall and is currently used as a Medical/ Dental building with no vacancies. The eastern side of the lot is currently used as parking space with a total of 62 spaces to satisfy what is legally required for the size of the building. The positioning of the improvements is considered functional for its current use. Improvements “as is” would not fit the needs of new
  • 49.
    8330 RESEDA BLVD. COMMERCIAL APPRAISAL GROUP 3 49 retail users. If it is legally permissible an automotive dealership may be able to use the improvement. Legal Permissibility As detailed in the Zoning Section of this report, the subject property is zoned C2 and P-1VL, restricted Business Improvement District, by the Northridge Generalized Land Use.37 The subject property, as improved, meets the various requirements as defined for the C2 and P-1VL District. The subject property allows a lot area with the requirements of the R4 Zone (Section 12.11-C.4), shall apply to all portions of buildings used for residential purposes. Financial Feasibility The financial feasibility of the improvement will be derived from its perceived market value against the lands market value as vacant. If the improvements at market value exceed the value of the land then the subject improvements could be seen as financially feasible. The improvements have an effective age of 30 years. The improvement does not need to be renovated in order to be financially feasible in its current use as: Multi-Tenant office building. The existing building is within current zoning laws and legally allowed to be on the lot for its current use. Modifications to the property beyond building maintenance for habitability do not substantially increase market value and should not be performed. The use of improvements meets the criteria for financially feasible. The value the building provides is more than the value of the land as vacant. Demolition of the building to construct the ideal improvement would not be financially feasible. 37 "ZIMAS." ZIMAS. N.p., n.d. Web. 04 Apr. 2016.
  • 50.
    8330 RESEDA BLVD. COMMERCIAL APPRAISAL GROUP 3 50 Conclusion The highest and best use of the site as improved is its current use. The current use meets all the zoning regulations and is psychically adapted for the size of the lot. The current use is capable of producing a competitive return on capital invested. Highest and best use as improved is its current state as a multi-tenant office building for the benefit of an investor. Overall Highest and Best Use The highest and best use for the subject property is the current use as improved. The highest and best use for the property as vacant is to build multi tenant office buildings immediately. As of the date of evaluation the building is 100% occupied. There is a demand in the immediate area for multi tenant office space and the current use fulfills that need. Appraisal Methodology In theory, there are three approaches to value, the Cost Approach, the Sales Comparison Approach and the Income Approach. The Cost Approach initially involves the valuation of the subject site, as if vacant. The Sales Comparison Approach is utilized to determine the market value of the subject site, based on a comparison of vacant land parcels. The Cost Approach also involves estimating the replacement cost new for the improvements, deducting an estimated dollar amount for accrued depreciation and adding the estimated land value. As previously indicated in this report, the Cost Approach was not utilized for the following reasons:
  • 51.
    8330 RESEDA BLVD. COMMERCIAL APPRAISAL GROUP 3 51 • The Cost Approach is predicated on the assumption that the market value of the subject property is equivalent to the land value plus current construction costs less depreciation, which is not always reliable, since the estimation of depreciation is subjective. • There has been very little, if any, new office development in the City of Simi Valley; this has resulted in a scarcity of new land sales in the area, from which to determine the land value of the subject sites. • The Cost Approach is not intrinsically suited to render an opinion of value for investment properties, since construction costs plus land are not always equivalent to market value. • The omission of the Cost Approach, when appraising an investment property such as the subject property, does not result in a misleading value estimate. The Cost Approach is typically not relied upon by investors and buyers in the marketplace; the Sales Comparison Approach and the Income Capitalization Approach are the traditional approaches utilized in the marketplace. The Sales Comparison Approach involves direct comparison of similar properties that have sold and/or are available for sale in the marketplace. The data from these comparable are converted to pertinent units of comparison that are analyzed and adjusted for differences, which are considered significant, leading to a value indication for the subject property. The pertinent units of comparison used in this analysis were the price per square foot indicator. The Income Capitalization Approach is based on the principle of anticipation of future benefits. In this analysis, the subject was valued on an income basis via a stabilized income analysis which involved projections of income, vacancy and collection loss, operating expenses and the capitalization of the net operating income by a market derived overall capitalization rate. Rentals of competing buildings and/or spaces in the general area of the subject were collected through discussions with leasing agents and compared to the subject. The projected market rates were utilized for the all of the subject’s units with leases that expire prior to the end of 2004, while contract rents were utilized for space with leases that expire in 2005 and beyond, with the projected vacancy and collection loss derived from an examination of the comparable properties. Operating expenses were derived from industry averages. By applying a market derived overall capitalization rate, an indicated value was concluded via a stabilized analysis.
  • 52.
    8330 RESEDA BLVD. COMMERCIAL APPRAISAL GROUP 3 52 SALES COMPARISON APPROACH The Sales Comparison Approach to value involves comparing the subject property to similar office buildings, which have sold and/or are available for sale and have the same general characteristics. According to the Appraisal Institute, the Sales Comparison Approach is defined as: "A method of estimating market value whereby a subject property is compared with comparable properties that have sold recently. One premise of the Sales Comparison Approach is that the market will determine a price for the property being appraised in the same manner that it determines the prices of comparable, competitive properties." Price Per Square Foot - The most common unit of comparison in appraising office buildings like the subject property is the price per square foot of building area. The price per square foot derived by dividing the sales price of the property by the square feet of the improvements. Market Analysis The Sales Comparison Approach reflects actual market behavior of typical purchasers and sellers under current market conditions, in addition, meaningful data from which to compare similar properties to the subject property. In order to find comparable sales, our investigative efforts included searching sales through CoStar, Acxiom, First American/Dataquick, discussions with knowledgeable brokers and owners in the area, and an inspection of the subject property's general market area for comparables available for sale. Comparison The sales comparison approach utilizes sales of comparable properties adjusted for the differences to find the value of the subject property. Valuation is found using psychical units of comparison such as price per floor, price per parking sport ratio and materials used for construction. Adjustments are applied to the psychical units of comparison found on the information given about the comparable sales. The units of comparison chosen for the subject are
  • 53.
    8330 RESEDA BLVD. COMMERCIAL APPRAISAL GROUP 3 53 Then used to find an adjusted approximate value of the subject property. The above sales comparisons are comprised solely of medical purpose buildings. There was a wide range of per square foot sales prices. In some sales comparisons this was due to differing land prices in each area. Sales comparisons were selected using criteria like proximity to subject property, square feet and age of improvements. Subject Property Comp 1 Comp 2 Comp 3 Comp 4 Comp 5 7220 Woodman Ave. Van Nuys, CA 91405 8940 Reseda Blvd. Northridge CA, 91324 8771 Van Nuys Blvd. Panaroma City Ca, 91402 11260 Wilbur Ave. Northridge, CA 91326 12992 Victory Blvd. North Hollywood Ca 91606 Sales Price $2,600,000 $2,150,030 $1,490,000 $4,925,000 $2,700,000 Sales Price/ SF $230.09 $293.72 $266.07 $354.42 $306.99 Date of Sale 11/24/15 10/30/15 9/11/15 8/7/15 6/19/15 Age of Property 29 34 59 55 30 25 Location Middle Block Middle Block Middle Block Middle Block Corner Middle Block Net Land Area 34279 19349 19502 14527 42698 14815 Building use Medical Medical Medical Medical Medical Medical Market/ Sub- Market LA/SFV LA/SFV LA/SFV LA/SFV LA/SFV LA/SFV Visibility Frontage Frontage Frontage Frontage Frontage Frontage Building Area/ SF 12860 11300 7320 5600 13896 8795 Condition/Quality Masonry Wood Frame Masonry Masonry Wood frame Masonry Number of Stories 2 2 1 1 2 1 Parking Spaces (1000 SF) 4.82 3.01 5.46 3.75 5.00 1.14
  • 54.
    8330 RESEDA BLVD. COMMERCIAL APPRAISAL GROUP 3 54 QUALITATIVE ANALYSIS Qualitative Adjustments Comp 1 Comp 2 Comp 3 Comp 4 Comp 5 Sales Price/SF $230.09 $293.72 $266.07 $354.42 $306.99 Age of Property Inferior Inferior Inferior Inferior Superior Location Access -- - - Superior - Building Area (SF) Inferior Inferior Inferior Superior Inferior Condition/Quality Inferior - - Inferior - Number of Stories - Inferior Inferior - Inferior Parking (Spaces/1,000SF) Inferior Superior Inferior Superior Inferior Overall Inferior Inferior Inferior Superior Inferior QUANTITATIVE ANALYSIS Quantitative Adjustments Comp 1 Comp 2 Comp 3 Comp 4 Comp 5 Sales Price/SF $230.09 $293.72 $266.07 $354.42 $306.99 Age of Property 5.00% 5.00% 5.00% 5.00% -5.00% Location Access - -- -- -5.00% -- Building Area (SF) 10.00% 10.00% 10.00% -10.00% 10.00% Condition Quality 5% -- -- 5% -- Number of Stories -- 5.00% 5.00% -- 5.00% Parking (Spaces/1,000SF) 5.00% -5.00% 5.00% -5.00% 5.00% Overall Adjustments 25.00% 15.00% 25.00% -10.00% 15.00% Adjusted Value per/SF $287.61 337.78 $332.59 $389.86 $353.04 Overall Inferior Inferior Inferior Superior Inferior Compared sales Analysis The sales comparable to the subject property are sales comparison 2 and sales comparison 4. Sale comparison 2 requires an overall upward adjustment. This comparison had inferior square feet, inferior number of floors in the building and inferior age of building. These differences required
  • 55.
    8330 RESEDA BLVD. COMMERCIAL APPRAISAL GROUP 3 55 an upward adjustment. Comparison 2 had more parking spots, than the subject and will have a downward adjustment. Sale comparison 4 required an overall downward adjustment. This sale had a better location, more parking spots per 1000 SF and also had more building area measured in Square feet. All three will require a downward adjustment to the comparison. The construction materials used in the building of comparison 4 are inferior to the subject property and will bring an upward adjustment to the comparison. Sale comparison 1 3 and 5 are inferior to the subject property and will see an overall upward adjustment. This property had less building square feet, number of floors and parking spots than the subject property. Sale comparison 2 is older and will have an upward adjustment. Sale comparison 3 is newer than the subject property and will be adjusted downward. The unadjusted range of comparable sales is $230.09 per square foot to $354.42 per square foot. These values will dictate an overall value close to $3,800,000. This figure is unadjusted for inferior and superiorities of the 5 comparable sales. When adjusted for differences in the comparable sales the range changes with 287.61 as the low and 389.86 as the high. Conclusion of Sales Comparison Approach The sales range from a low of $287.61 per square foot to a high of $389.86 per square foot of building area. Based on this analysis the subject property adjusted price per square foot should be more than comparison 5 at $353.04 but should be less than $389.86 of comparison 4. We found that a price per square foot of $360.00 per square foot should be used because of the comparable age to comparison 5 but added parking spots and square footage that the subject property has.
  • 56.
    8330 RESEDA BLVD. COMMERCIAL APPRAISAL GROUP 3 56 Based on the subject’s square footage this would indicate an estimated “As is” market value as of May 15, 2016 of: Building Area in Square Feet Value Indicator Building Value 12860 SF $360.00 / SF $4,629,600 "As is" Value $4,650,000 Income Capitalization Approach Introduction The Income Capitalization Approach is defined by the Appraisal Institute, as: "That procedure in appraisal analysis which converts anticipated benefits (dollar income or amenities) to be derived from the ownership of property into a value estimate... Anticipated future income and/or reversions are discounted to a present worth figure through the capitalization process." The Income Capitalization Approach or Investment Approach is generally the preferred method for valuing income-producing properties because it most closely reflects the investment rationale and strategies of typical buyers. Under this Income Capitalization Approach to value, this annual net operating income (NOI) is derived by a reliable estimate of the gross scheduled income, less an estimate of vacancies and collection loss, less an estimate of operating expenses for the subject property. In preparing this Income Capitalization Approach, we undertook several steps, as follows: • We surveyed competing office buildings in the general area in order to determine current rent levels. • We reviewed data pertaining to office buildings which have currently leased or are available for lease. (In most cases, the analysis of the actual rental income becomes a paramount value consideration). • Based upon our analysis of the various rental information, we have forecasted annual rents for the subject property.
  • 57.
    8330 RESEDA BLVD. COMMERCIAL APPRAISAL GROUP 3 57 • We have prepared an income analysis of the subject property, including an estimate of vacancy and expenses and the capitalization of the estimated net operating income at an appropriate capitalization rate. Rental Survey In order to arrive at a reasonable estimate of annual rental income for the subject property, we have gathered and analyzed information pertaining to office properties in the Reseda-Sherman Oaks area. Rent Comparable No. 1 7220 Woodman Avenue Van Nuys, CA 91405 PROPERTY INFORMATION Property Type: multi-tenant Office Building Building Area: 11,300 SF Improvements: Wood-frame and Stucco, built in 1981 Condition/Quality: Poor / Average Leased Area: 11,068 SF Occupancy: 100% On-Site Parking: 34 shared RENTAL SUMMARY: This property located at 7220 Woodman Avenue is a thirty-four year old two-story wood framed medical building that was last sold on November 24th 2015. The multi-tenant building is located is the Los Angeles San Fernando Valley region sold at $2,600,000. The property is located in the middle of the block and has frontage view on Woodman that extends 129 feet. The building area is 11,300 square feet with a net land area of 19,349 and a ratio of 3.01 parking spaces per 1000 SF. Overall Comparison: Inferior Rent Comparable No. 2 8940 Reseda Boulevard Northridge, CA 91324 PROPERTY INFORMATION Property Type: Multi-Tenant Office Building
  • 58.
    8330 RESEDA BLVD. COMMERCIAL APPRAISAL GROUP 3 58 Building Area:7,320 SF Improvements: Masonry, built in 1956 Condition/Quality: Average / Average Leased Area: 7320 SF Occupancy: 100% On-Site Parking: 40 Shared RENTAL SUMMARY: The property located on Reseda Boulevard is a fifty-nine year old masonry medical building that was last sold on October 30th 2015 at $2,150,030. It is located in the Los Angeles San Fernando Valley region. This one story building has a building area 7320 SF, a net land area of 19,502 SF with a ratio of 5.46 parking spaces/1000 SF. This is a multi- tenant building locate in the middle of the block with a frontage view. Overall Comparison: Similar Rent Comparable No. 3: 8771 Van Nuys Blvd Panorama City CA, 91402 PROPERTY INFORMATION Property Type: Multi-Tenant Office Building Building Area: 5,600 SF Improvements: Masonry, built in 1960 Condition/Quality: Poor / Poor Leased Area: 5,600 SF Occupancy: 100% On-Site Parking: 21 Shared RENTAL SUMMARY: This one story medical building located on Van Nuys Blvd is a fifty- five year old masonry building sold at $1,490,000 on September 11 2015. Its building size is 5,600 SF with a net land area of 14,527 SF and a parking ratio of 3.75 parking spaces/1000 SF. This property is located in the Los Angeles San Fernando Valley region. It is located in the middle of the block with 91 feet worth of street frontage on Van Nuys Blvd. Overall Comparison: Inferior
  • 59.
    8330 RESEDA BLVD. COMMERCIAL APPRAISAL GROUP 3 59 Rent Comparable No. 4: 11260 Wilbur Avenue Northridge CA, 91326 PROPERTY INFORMATION Property Type: Multi-tenant Office Building Building Area: 13,896 SF Improvements: Wood Frame, Built in 1985 Condition/Quality: Good / Good Leased Area: 13,896 SF Occupancy: 91.7% On-Site Parking: 68 Shared RENTAL SUMMARY: This property located at 7220 Woodman Avenue is a thirty-four year old two-story wood framed medical building that was last sold on November 24th 2015. The multi-tenant building is located is the Los Angeles San Fernando Valley region sold at $2,600,000. The property is located in the middle of the block and has frontage view on Woodman that extends 129 feet. The building area is 11,300 square feet with a net land area of 19,349 and a ratio of 3.01 parking spaces per 1000 SF. Overall Comparison: Superior Rent Comparable No. 5: 12992 Victory Boulevard North Hollywood CA, 91606 PROPERTY INFORMATION Property Type: Multi-Tenant Building Building Area: 8.795 SF Improvements: Masonry, built in 1990 Condition/Quality: Great / Good Leased Area: 8,795 SF Occupancy: 100 % On-Site Parking: 10 Shared RENTAL SUMMARY: This twenty-five year old multi tenant office building was last sold on June 19th 2015 at $2,700,000. This property is located in the middle of the block on Victory Blvd. The one story masonry building has a net land area of 14,815 SF with a building area of
  • 60.
    8330 RESEDA BLVD. COMMERCIAL APPRAISAL GROUP 3 60 8,795 SF and a ratio of 1.14 parking spaces/1000 SF. It is located in the Los Angeles San Fernando Valley region. Overall Comparison: Inferior Potential Gross Income Based upon the analysis of the rent comparables, we have forecasted potential gross income at $324,000 per year. This is based on the average of $2.10 per square feet per month of the rent comparables. Asking rent per square feet ranged from $2.10 to $2.60. Vacancy & Collection Loss As of the date of inspection, the subject property was 100% occupied. According to Office Market Overview, the overall vacancy rate for office space in San Fernando Valley was between 11% and 21%. Vacancy rates for the sale comparable in this appraisal ranged from 97.1% to 100%, while vacancy rates for the rent comparable in this appraisal ranged from 0% to 25%. The subject property has remained 100% occupied for the past few years. This is due to the willingness of the management to work with tenants and desire to maintain high occupancy levels. For purposes of this analysis, we have utilized a 17.7% vacancy factor. This vacancy factor was determined through discussions with market participants, such as brokers and owners, and through market rates obtained from the comparable sales. Operating Expense Conclusion After a review of the operating expenses being incurred by comparable investment properties in the subject’s market area, historical operating statements and a reference of the IREM Operating Expense Guideline for office buildings, we are of the opinion that our expense estimates are appropriate, given that the subject’s historical trend, and current lease terms. A summary table of the subject property’s historical expenses is provided below.
  • 61.
    8330 RESEDA BLVD. COMMERCIAL APPRAISAL GROUP 3 61 Overall Capitalization Rate The final step in the Income Capitalization Approach to value is to determine the appropriate capitalization rate to convert the anticipated net operating income to an indicated value. • Initial year strip capitalization rates of 5.00% - 11.00%, with an average of 7.46% for suburban office buildings in the Los Angeles were shown in the last quarter “Korpacz Real Estate Investor Survey”, a quarterly survey of investment bankers, domestic pension fund advisors, REIT’s and real estate investors. • The office building sales utilized in the sales comparison approach indicated overall capitalization rates from 5.00% to 6.00%. Based upon the preceding information and a review of market statistics provided from general data sources, we have utilized an 4.25% overall capitalization rate for the subject property. Reconciliation The reconciliation process consists of reviewing the various independent derived valuation methods, weighing their respective merits, and correlating the data into a final value estimate. The following is a summary of the value indicators by two approaches to value, utilized in our valuation analysis of the subject property. Operating Expenses Methodology Proforma Property Taxes Tax rate applied to market value, plus direct assessments $47,663 Property Insurance Estimated at $0.92/SF based on historic costs $11,831 Repairs & Maintenance Estimated at $1.64/SF based on historic costs $21,090 Janitorial Estimated at $0.75/SF based on industry standards $9,645 Trash Removal Estimated at $0.23/SF based on industry standards $2,958 Utilities Estimated at $3.12/SF based on historic costs $40,123 Management Estimated at 3.0% of Effective Gross Income $8,001 Reserves Estimated at 2.0% of Effective Gross Income $5,334 Total Expenses $146,646 Total Expenses Per SF $11.40 /SF
  • 62.
    8330 RESEDA BLVD. COMMERCIAL APPRAISAL GROUP 3 62 To conclude the Sales Comparison Analysis Approach and based on our Sales Comparison Analysis, we concluded a value of $360. Per square feet, with a value of $4,650,000 for the subject property. The sales comparison approach was ultimately used to determine the appraised value of the property. The sales comparison approach was used as the basis of the appraisal for the following. One, the sales comparison approach allowed us to determine market value based on recent sales of similar properties with similar uses. Two, this worked to determine a fair market value based on what other individuals have paid for similar properties. Three, we found this approach to best reflect market behavior and is most widely used and understood by buyers. Four, the value derived from the sales comparison approach resulted from the availability of recent sales, and quality data on comparable properties. The income capitalization approach was also used in this appraisal to determine an appropriate market value for the property. This calculated value is $2,825,061. The value derived from this approach relies solely on direct information from the subject property. It takes market values in instances where information on the subject property cannot be found. For instance a market vacancy of 17.7% was used to determine a vacancy allowance for the subject property. This rate came from a market average in the general are of the subject property. The appraisers are of the belief that this approach fails to adequately incorporate market conditions in determining a final value for the subject property. For this, the income capitalization approach was disregarded. Direct Capitalization Rental Income $324,072 Other Income $0 Potential Gross Income (PGI) $324,072 Vacancy (less) $57,361 Effective Gross Income (EGI) $266,711 Expenses Taxes $47,663 Insurance $11,831 Repairs & Maintenance $21,090 Janitorial $9,645 Trash Removal $2,958 Utilities $40,123 Management $8,001 Reserves $5,334 Total Expenses $146,646 Net Operating Income $120,065 Value Conclusion $2,825,061
  • 63.
    8330 RESEDA BLVD. COMMERCIAL APPRAISAL GROUP 3 63 Methodology Estimated Value Sales Comparison $4,650,000 Income Capitalization $2,825,061
  • 64.
  • 65.
    8330 RESEDA BLVD. COMMERCIAL APPRAISAL GROUP 3 65 Left side view of Subject Property
  • 66.
  • 67.
    8330 RESEDA BLVD. COMMERCIAL APPRAISAL GROUP 3 67 Right side view of subject property
  • 68.
    8330 RESEDA BLVD. COMMERCIAL APPRAISAL GROUP 3 68 Nathan Newman 9227 Reseda #118 Northridge, CA 91324 Phone: (559) 940-4183 E-Mail: nathanhnewman@gmail.com Objective To obtain a sales position within the Real Estate industry Experience Cellucor August 2014 – Current Manager of Sales Development Los Angeles, California ! Increased customer base for franchise GNCs ! Business to Business health supplement sales ! Worked with GNC Franchise owners to create weekly events ! Trained staff on products and sales procedures GNC Health Supplement Retailer April 2012 – August 2014 Sales Manager Clovis, California ! Merchandized store regularly ! Balanced accounting ledgers for store weekly ! Handled cash and deposits every morning and evening ! Communicate with customers to find what they need ! Trained staff on product health benefits ! Generated sales growth using sales expertise Education California State University, Northridge August 2014 – May 2016 (Expected) ! Bachelors of Science in Finance ! Bachelors of Science in Real Estate ! Dean’s List recipient Fresno City College Fall 2012 – May 2014 ! Associate of Science in Business Administration Degree ! Cumulative G.P.A. (3.7) ! Dean’s List recipient ! Honors Program member
  • 69.
    8330 RESEDA BLVD. COMMERCIAL APPRAISAL GROUP 3 69 Clovis High School August 2008 – May 2012 ! G.E.D. Degree ! Cumulative G.P.A. (3.5) ! Principals Honor ! Cougar Foundation Scholarship Recipient Skills Summary Computer Capability ! Strong knowledge of Microsoft Word, Access, Excel, and PowerPoint ! Ability to work with several operating systems including Windows, Mac OSX and Linux Business Communication ! Over two years of retail communication experience ! Served in numerous direct sales and sales management roles for a supplement retailer ! Skilled in delegating tasks and motivating team players to achieve their best goals Business Management ! Extensive work in merchandizing ! Handled and maintained large amounts of inventory ! Prepared income, revenue, and royalty reports ! Prepared store inventory orders
  • 70.
    8330 RESEDA BLVD. COMMERCIAL APPRAISAL GROUP 3 70 Damani Lenore 8915 Nestle Ave., Northridge, CA 91325 *Cell: 714-333-7634 damani.lenore.623@my.csun.edu Work Experience Papa johns Pizza, Cashier, June – August 2012 Answered phones for foods ordered and for mangers, cleaned kitchen and assembly line, prepped food, and worked behind cash register Apprenticeships – July- August 2013 Rode along with a residential real estate appraiser, using unique approaches on finding property value. Education Cal State Northridge, Northridge, CA Emphasis: Business Real Estate 2014 – present Expected graduation 2016 under Business real estate Volunteer Experience Took part in Friendship Baptist church feeding the homeless as a food server 2012-2013 Participated in the elderly care program socializing with the elderly and helped feed them during breakfast and lunch 2011 Prom layout model for Friars Tux Interests / Activities Member and captain of the NCAA Division 1 Cal State Northridge volleyball team Past member of Yorba Linda High volleyball team Past member of student body in high school Computer Skills Proficient with Microsoft Word, knowledge of Excel, Power Point, and Access and working keyboard operated cash registers
  • 71.
    8330 RESEDA BLVD. COMMERCIAL APPRAISAL GROUP 3 71 Luis D. Morales 18400 Prairie Street Apt 210 Northridge, CA 91325 661-575-7017 ◦ colldm1990@yahoo.com Skills -Fluent Spanish speaker Certifications -Excel 2013 Essential Training Work History -(2011-2013) AV Car Wash Inc. / Mobil 1 Lube Express Position: Sales/Technician Duties: Advising customer on products offered, sales, performing service work orders as need -(2014-Present) AutoZone Position: Commercial Sales Representative (CSR) Duties: Advising customers on products offered, sales, and delivery of part orders to commercial accounts. Education -2012-2014 Antelope Valley College (AVC) - Major: Accounting - Dean’s List Spring 2014 -2014-Present California State University Northridge (CSUN) - Major: Finance
  • 72.
    8330 RESEDA BLVD. COMMERCIAL APPRAISAL GROUP 3 72 Tamus J. Glunz PO Box 2022 Lompoc, CA 93438 Email: gdayluv@juno.com Phone: (805) 588-6113 Objective: To obtain as an intern in the Real Estate field of Appraisal or Commercial Real Estate. Education: California State University Northridge (CSUN), Northridge, CA Bachelor of Science Degree in Business Administration May 2016 • Major in Real Estate and Minor in Business Law Allan Hancock College, Lompoc and Santa Maria, CA 65 units in Business Administration 2006 to 2013 • Certificate of Achievement CSU General Education Breadth • Certificate Transfer Recognition Award Santa Barbara City College, Santa Barbara, CA 1983 to 1985 51 units in Engineering/Electronic Technology Fresno City College, Fresno, CA 1975 to 1978 62 units in Liberal Arts Experience: Financial Specialist Jan. 2008 to Dec. 2008 Mission Oaks Mortgage, Lampoc, CA • Analyzed data to advise and recommend solutions, utilizing knowledge of theory, principles and field of specialization • Consulted with Brokers, Appraisers, Underwriters, and Real Estate Agents • Advised and consulted clients on alternate methods of solving needs/problems and recommended specific solutions Owner 1988 to 2009 Gypsy Property Management, Lompoc, CA • Managed residential real estate properties for clients • Discussed and drafted agreements/terms for providing management services including negotiating costs for services • Prepared leases/rental agreements for clients and collected specified rents and impounds • Arranged for alterations, maintenance, upkeep, and reconditioning of property • Employed services from security, maintenance and grounds keeping personnel as needed • Trained staff for various job duties • Assisted with eviction of tenants
  • 73.
    8330 RESEDA BLVD. COMMERCIAL APPRAISAL GROUP 3 73 Director of Sales 2004 to 2006 McNall's Ceiling Pro & Painting, Santa Barbara, CA • Created marketing and advertising designs by using photography, computer and telephone programs • Provided professional painting services for city, state, and federal organizations as well as home owners and private corporations • Joined Santa Barbara Chamber of Commerce and Contractors Association to create a stronger network for wider-based clientele Census Enumerator 2000 to 2005 United States Census, Santa Maria, CA • Read maps, processed paperwork, and performed door-to-door census of private information for funding distribution • Promoted to crew leader assistant to handle special assignments • Operated and mastered special federal computerized machinery and applications Letter Sorting Machine Clerk 1988 to 2006 United States Postal Service, Goleta, CA • Trained new and existing coworkers • Performed computer research and trained in various computer programs • Provided customer service over the phone and in person Skills and Extra-curricular Activities: • President/Founder of Matador Food Bank (CSUN) 2013 to present • Student of Educational Opportunity Program/TRIO (CSUN) 2013 to 2016