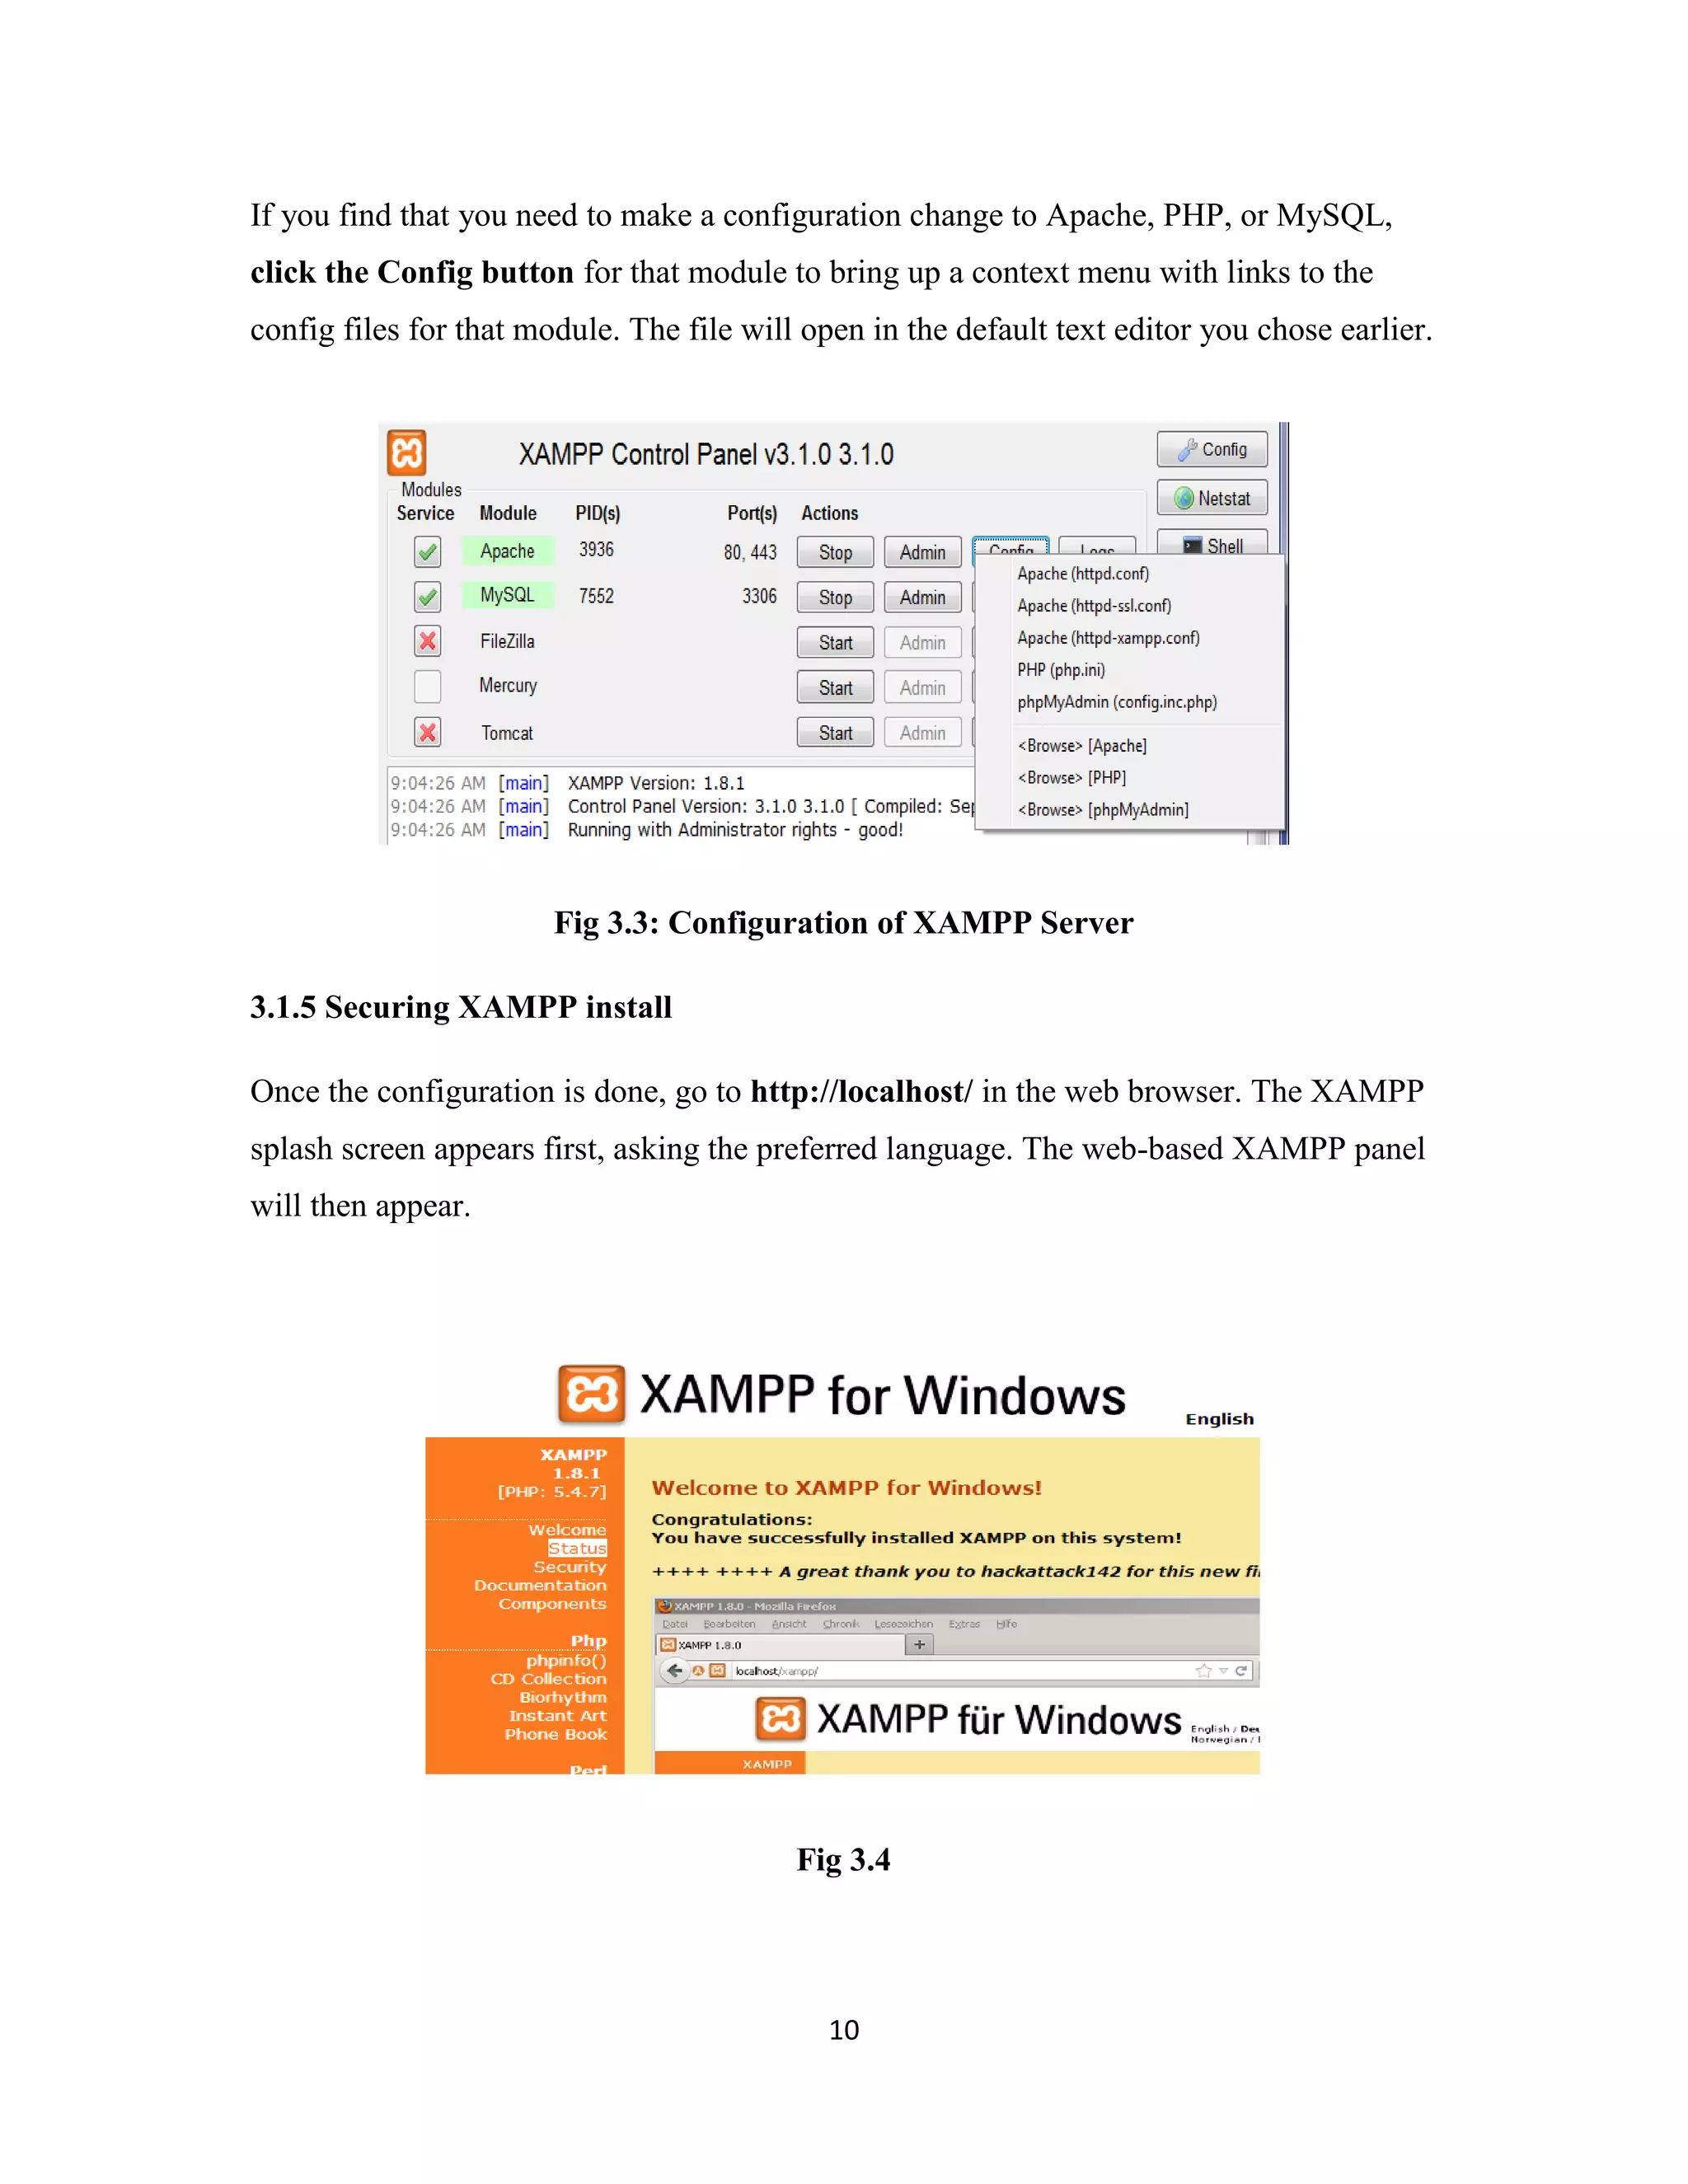
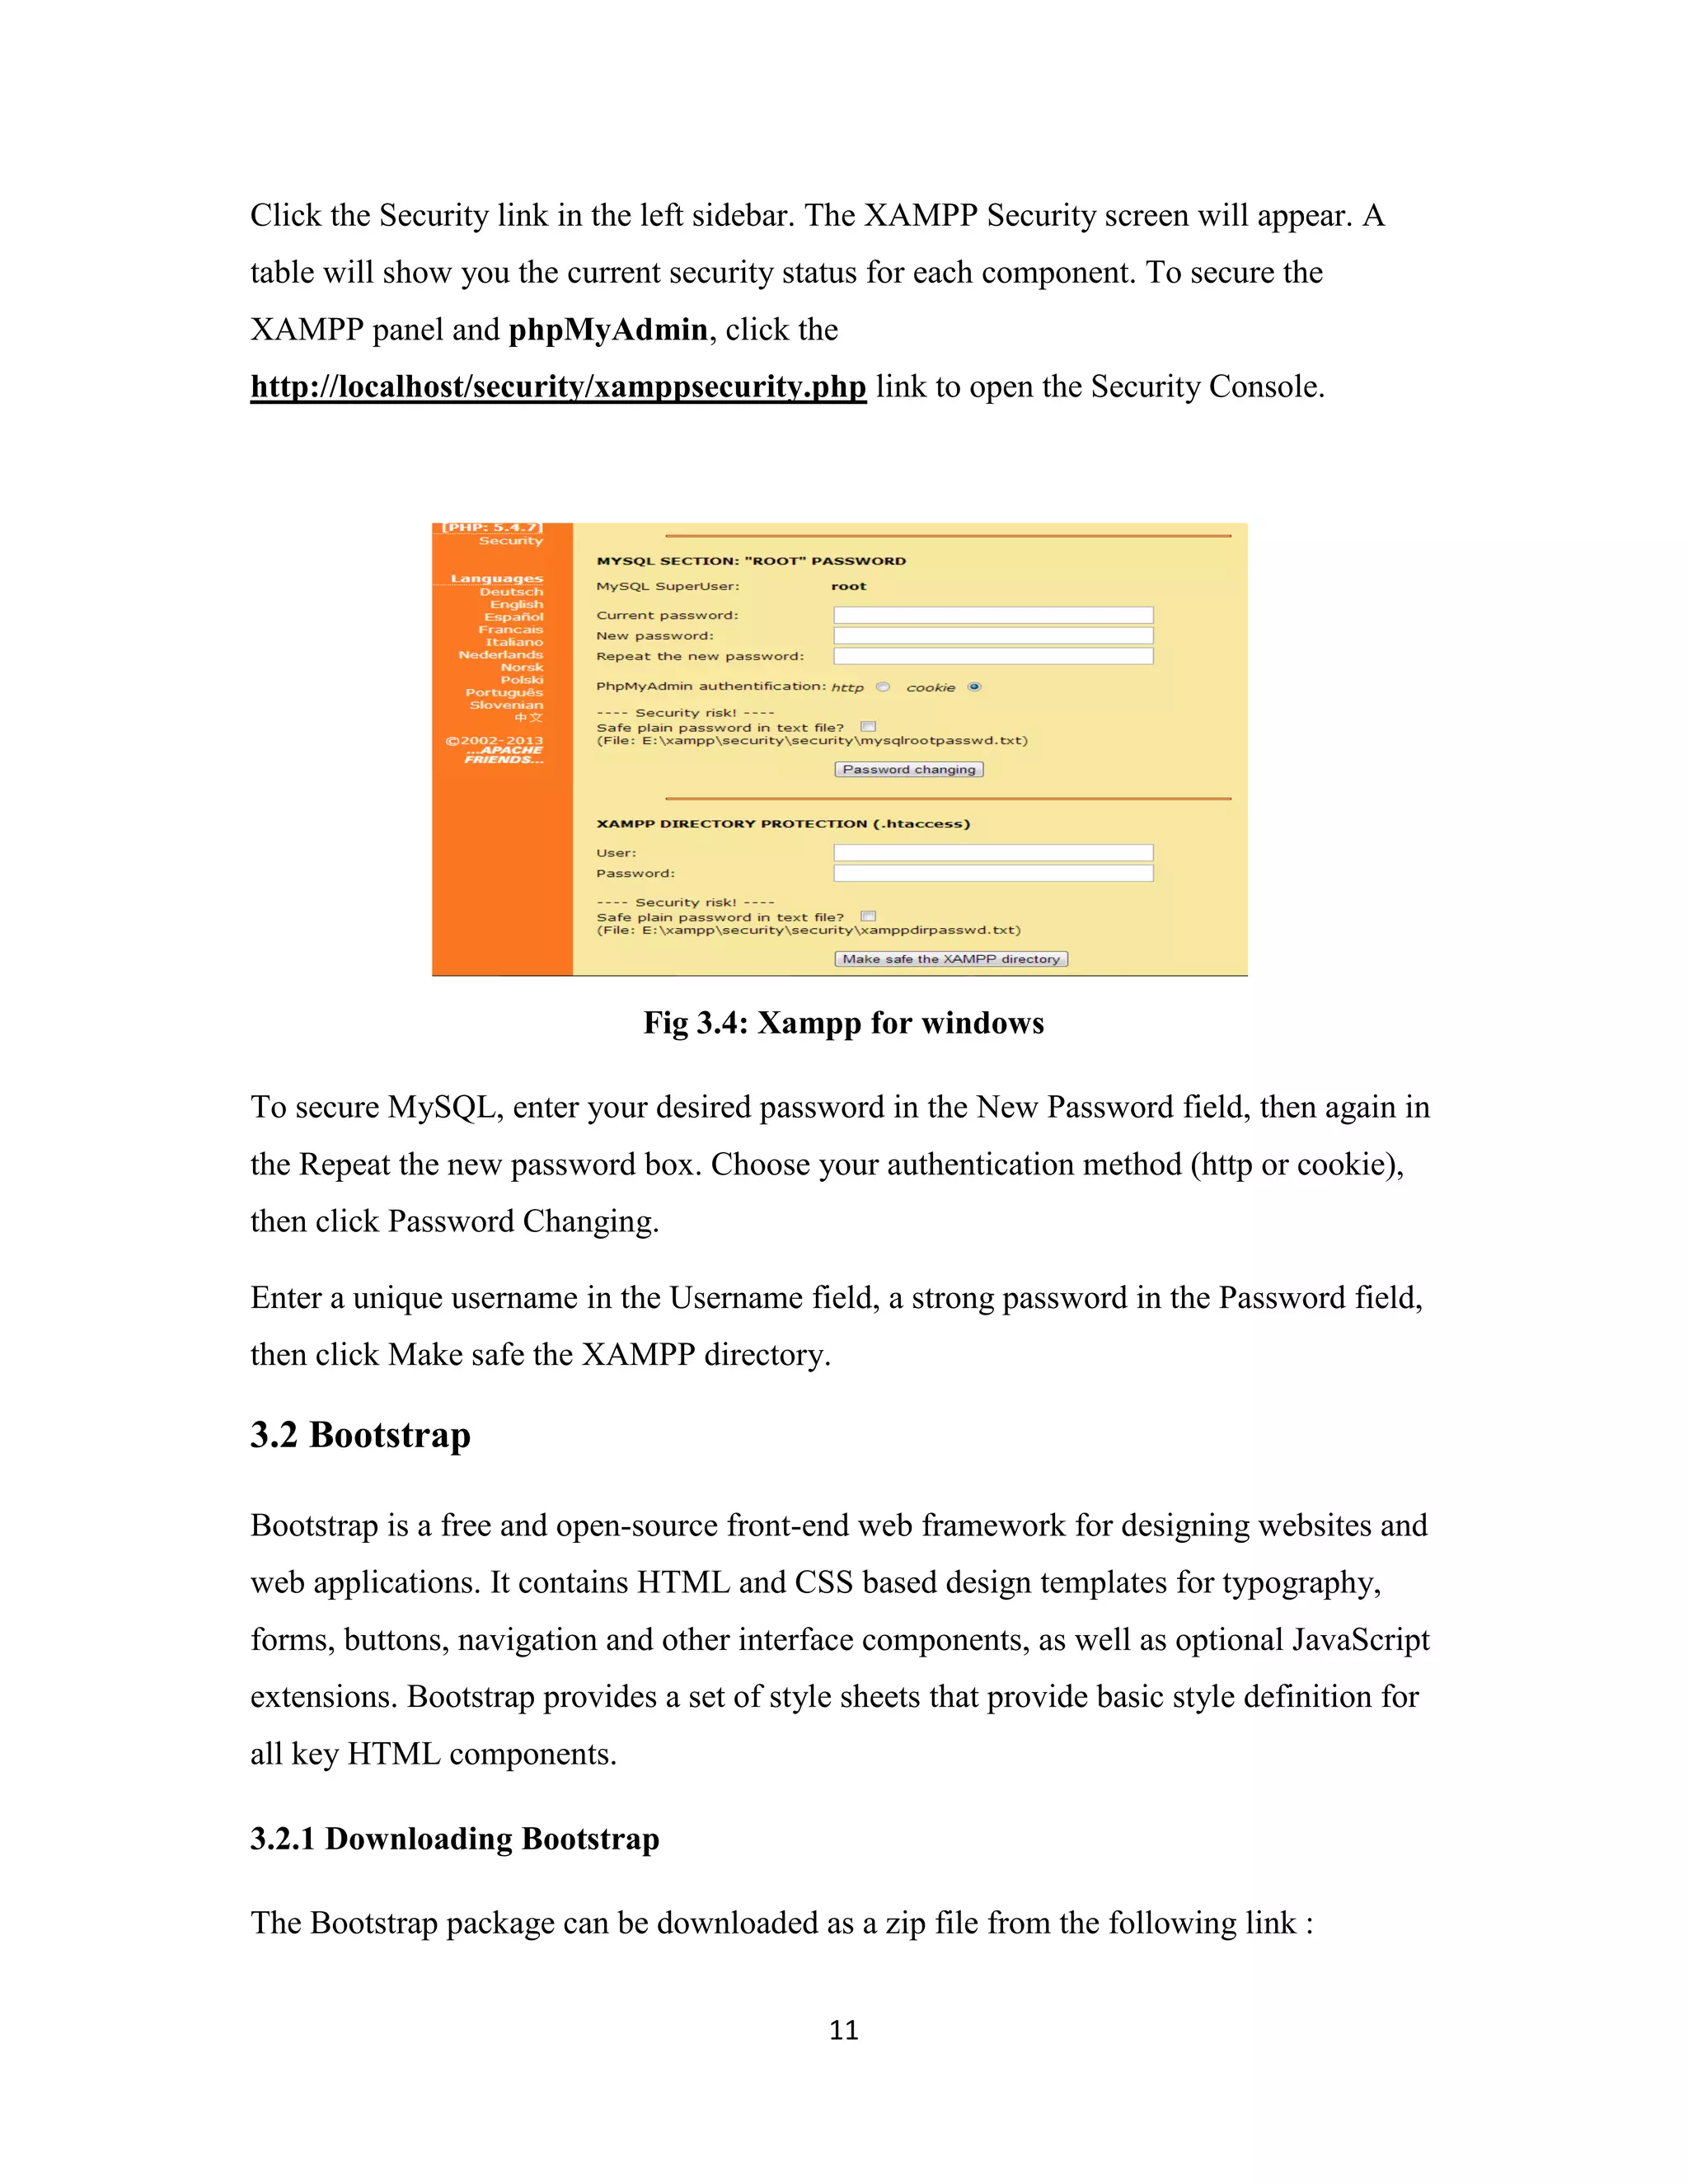
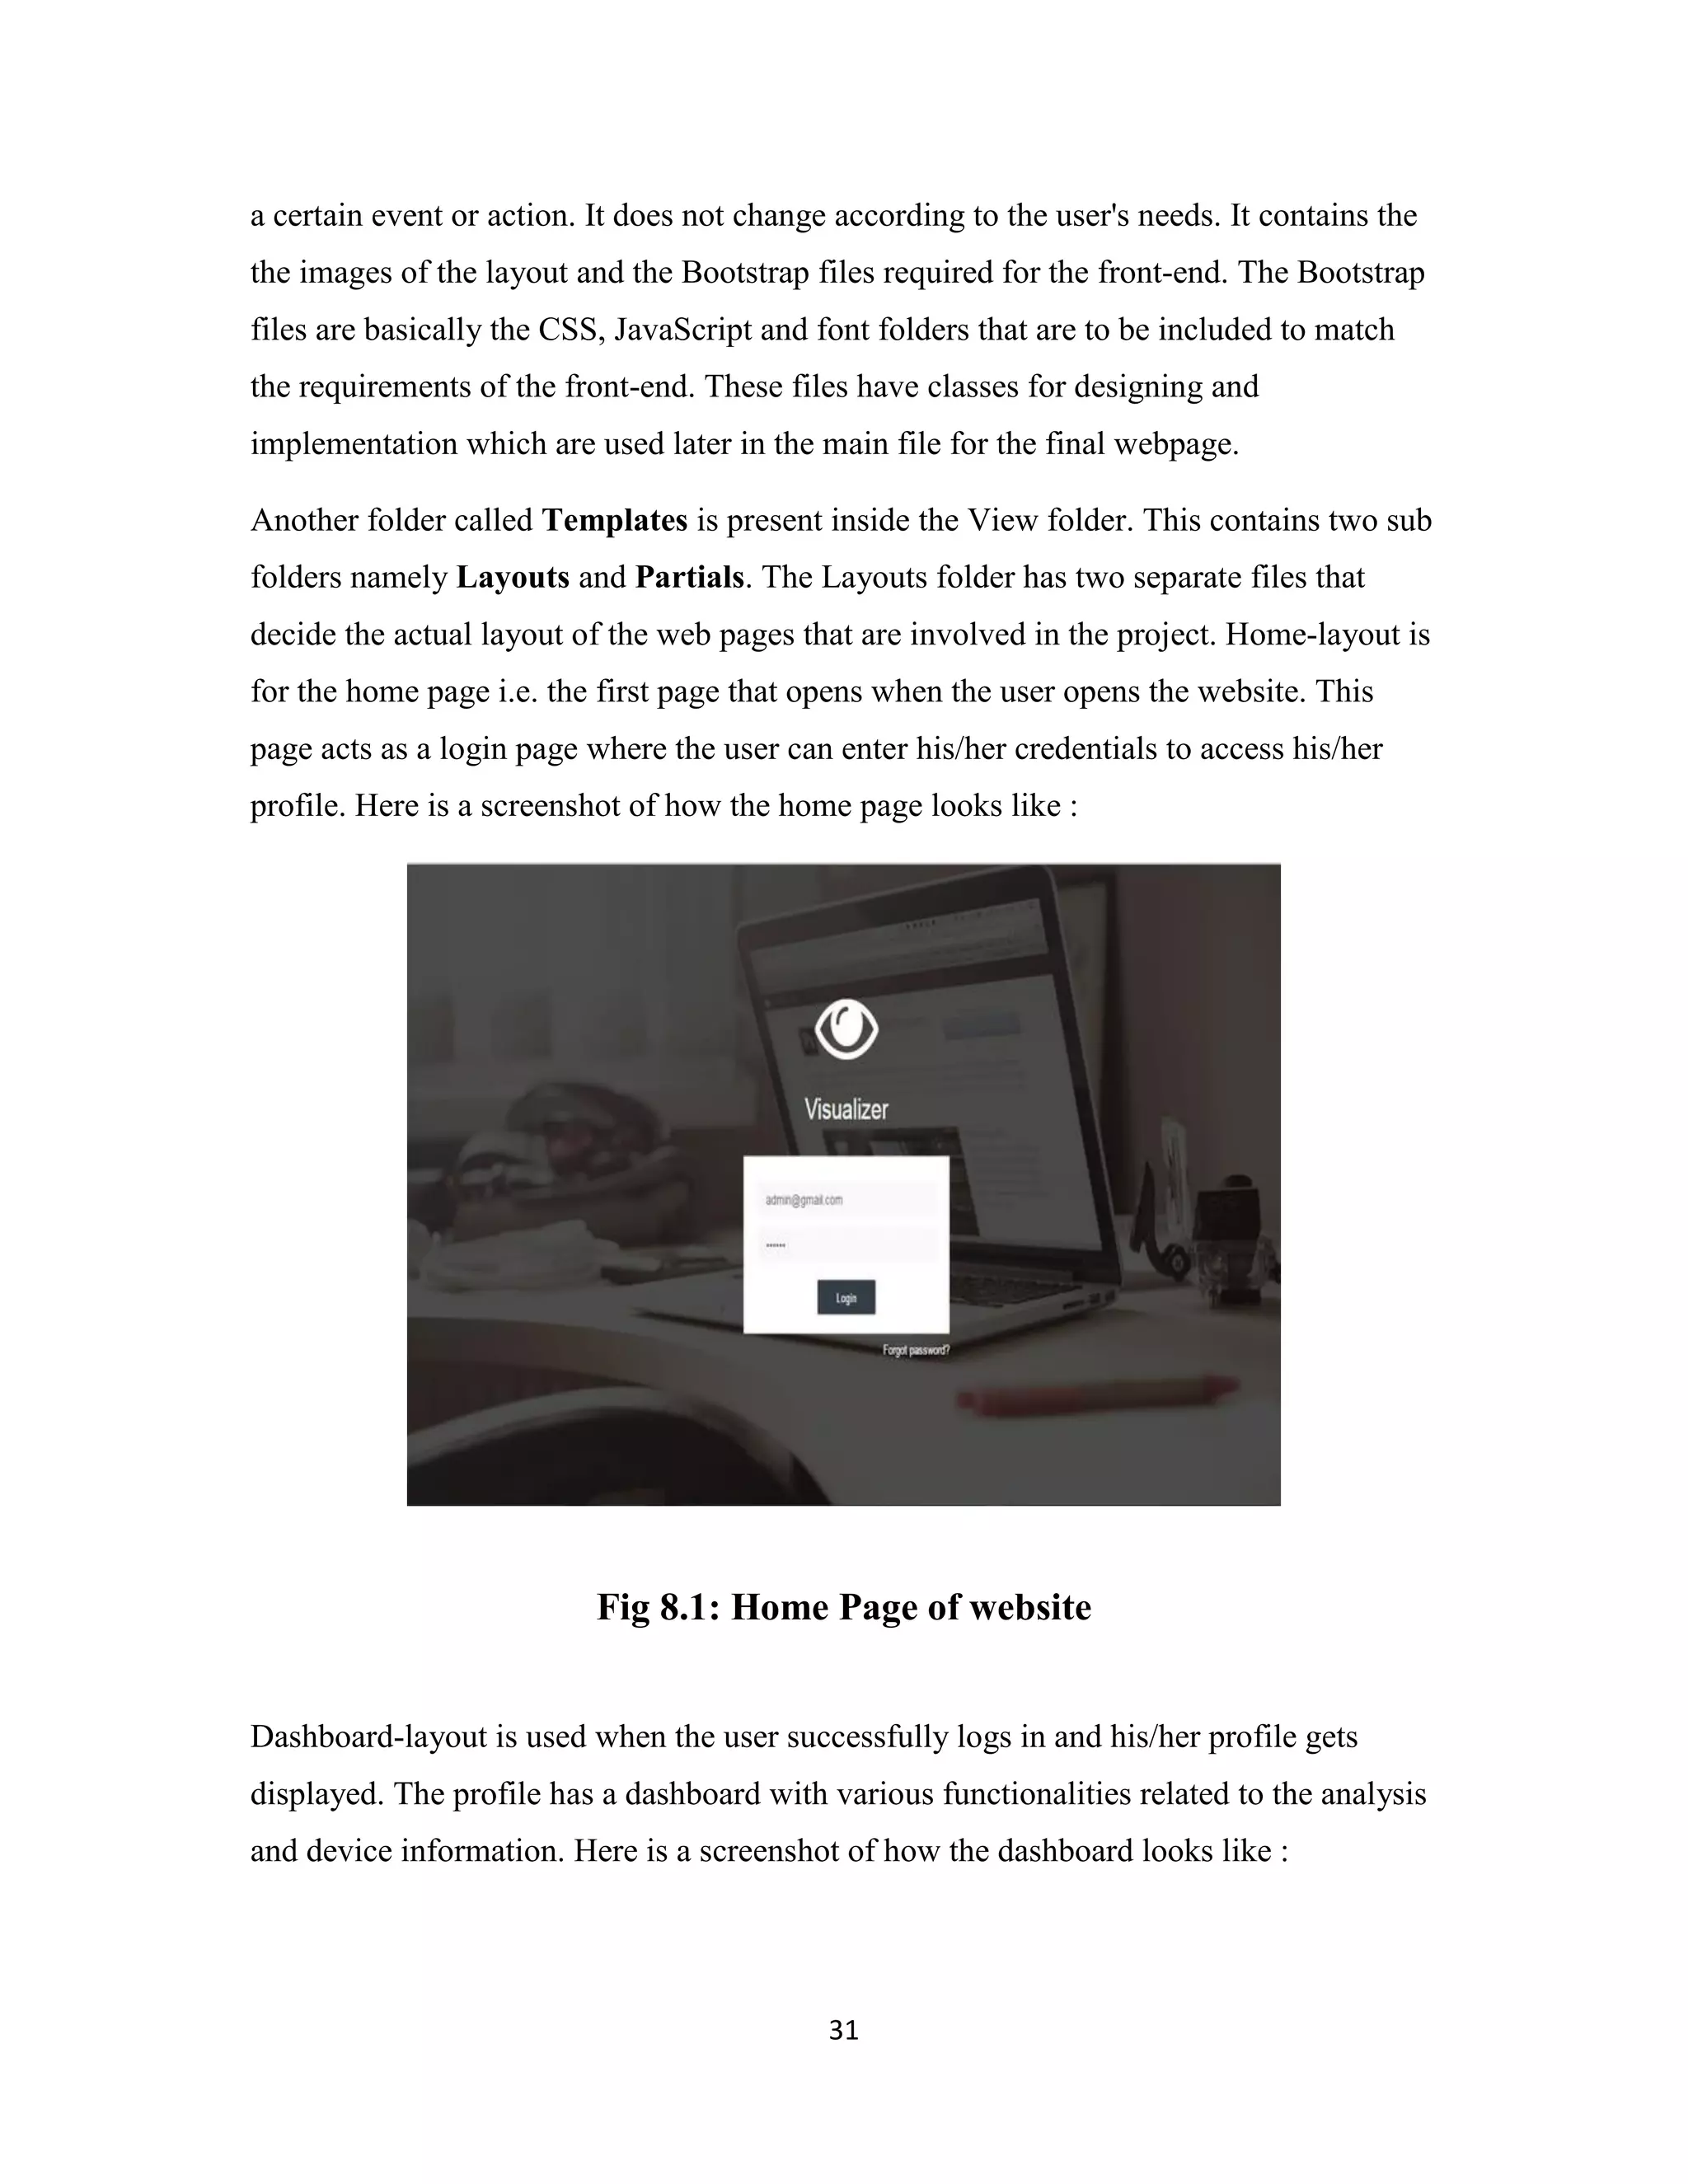
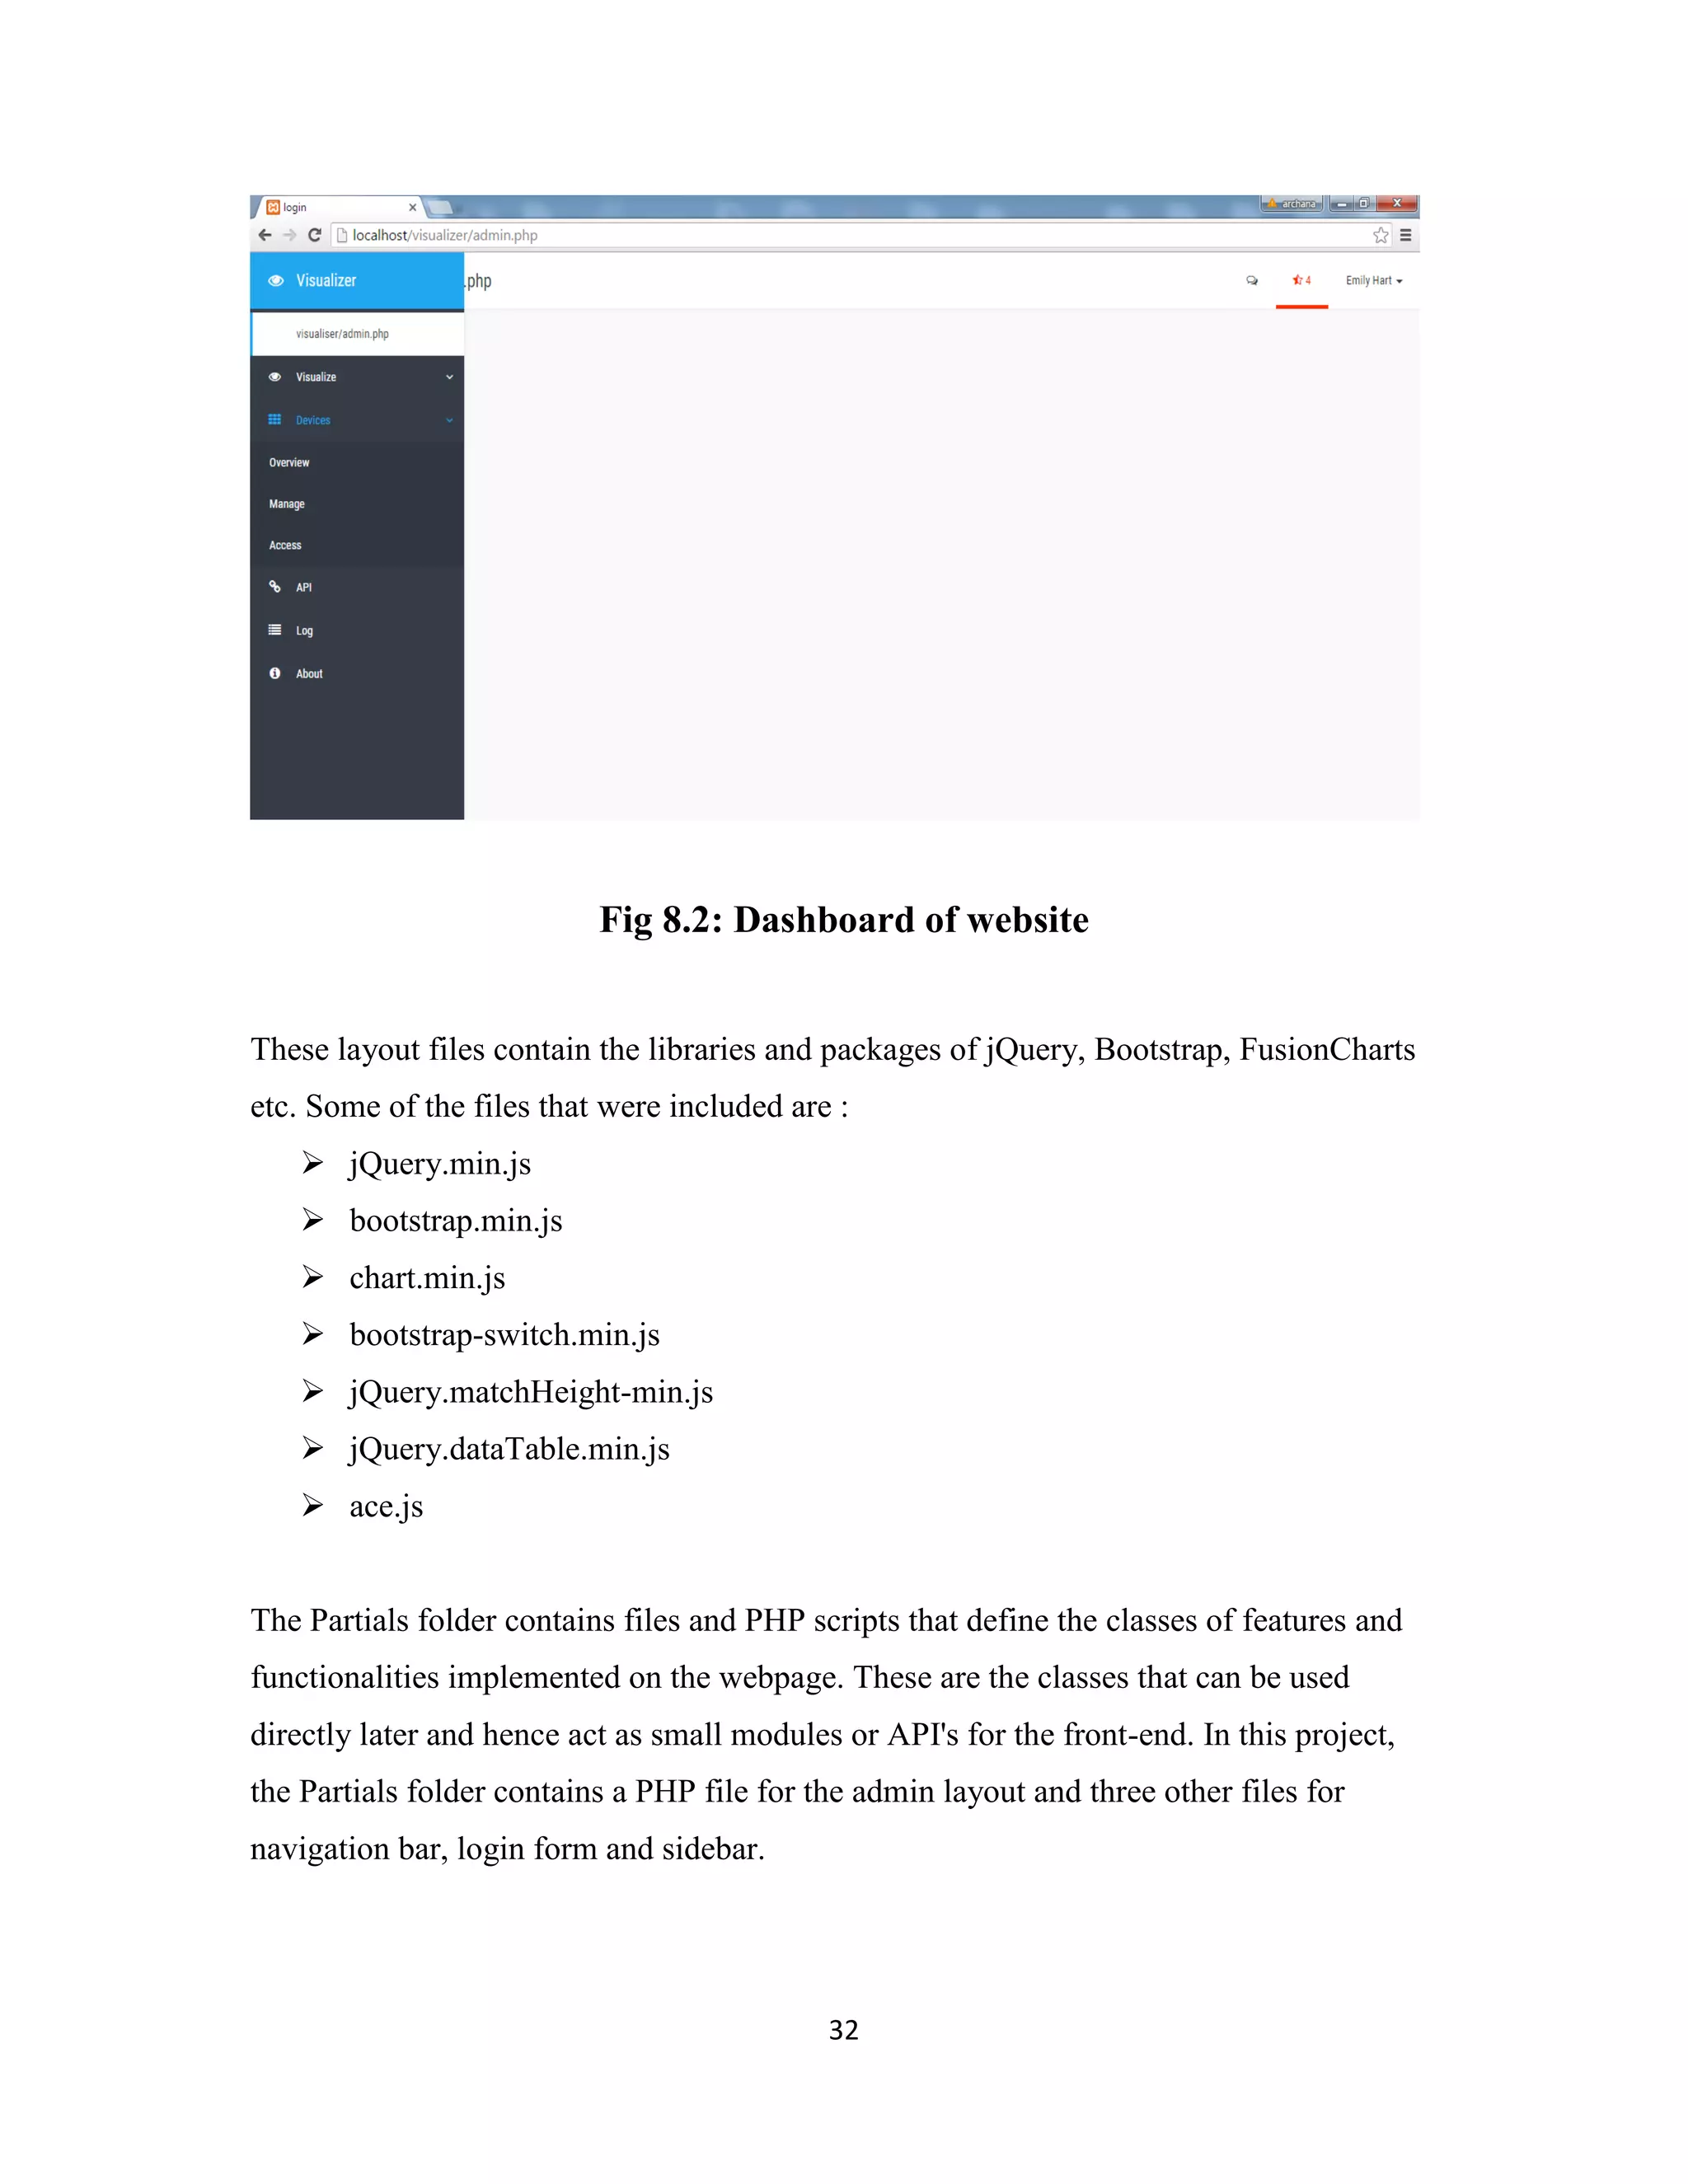
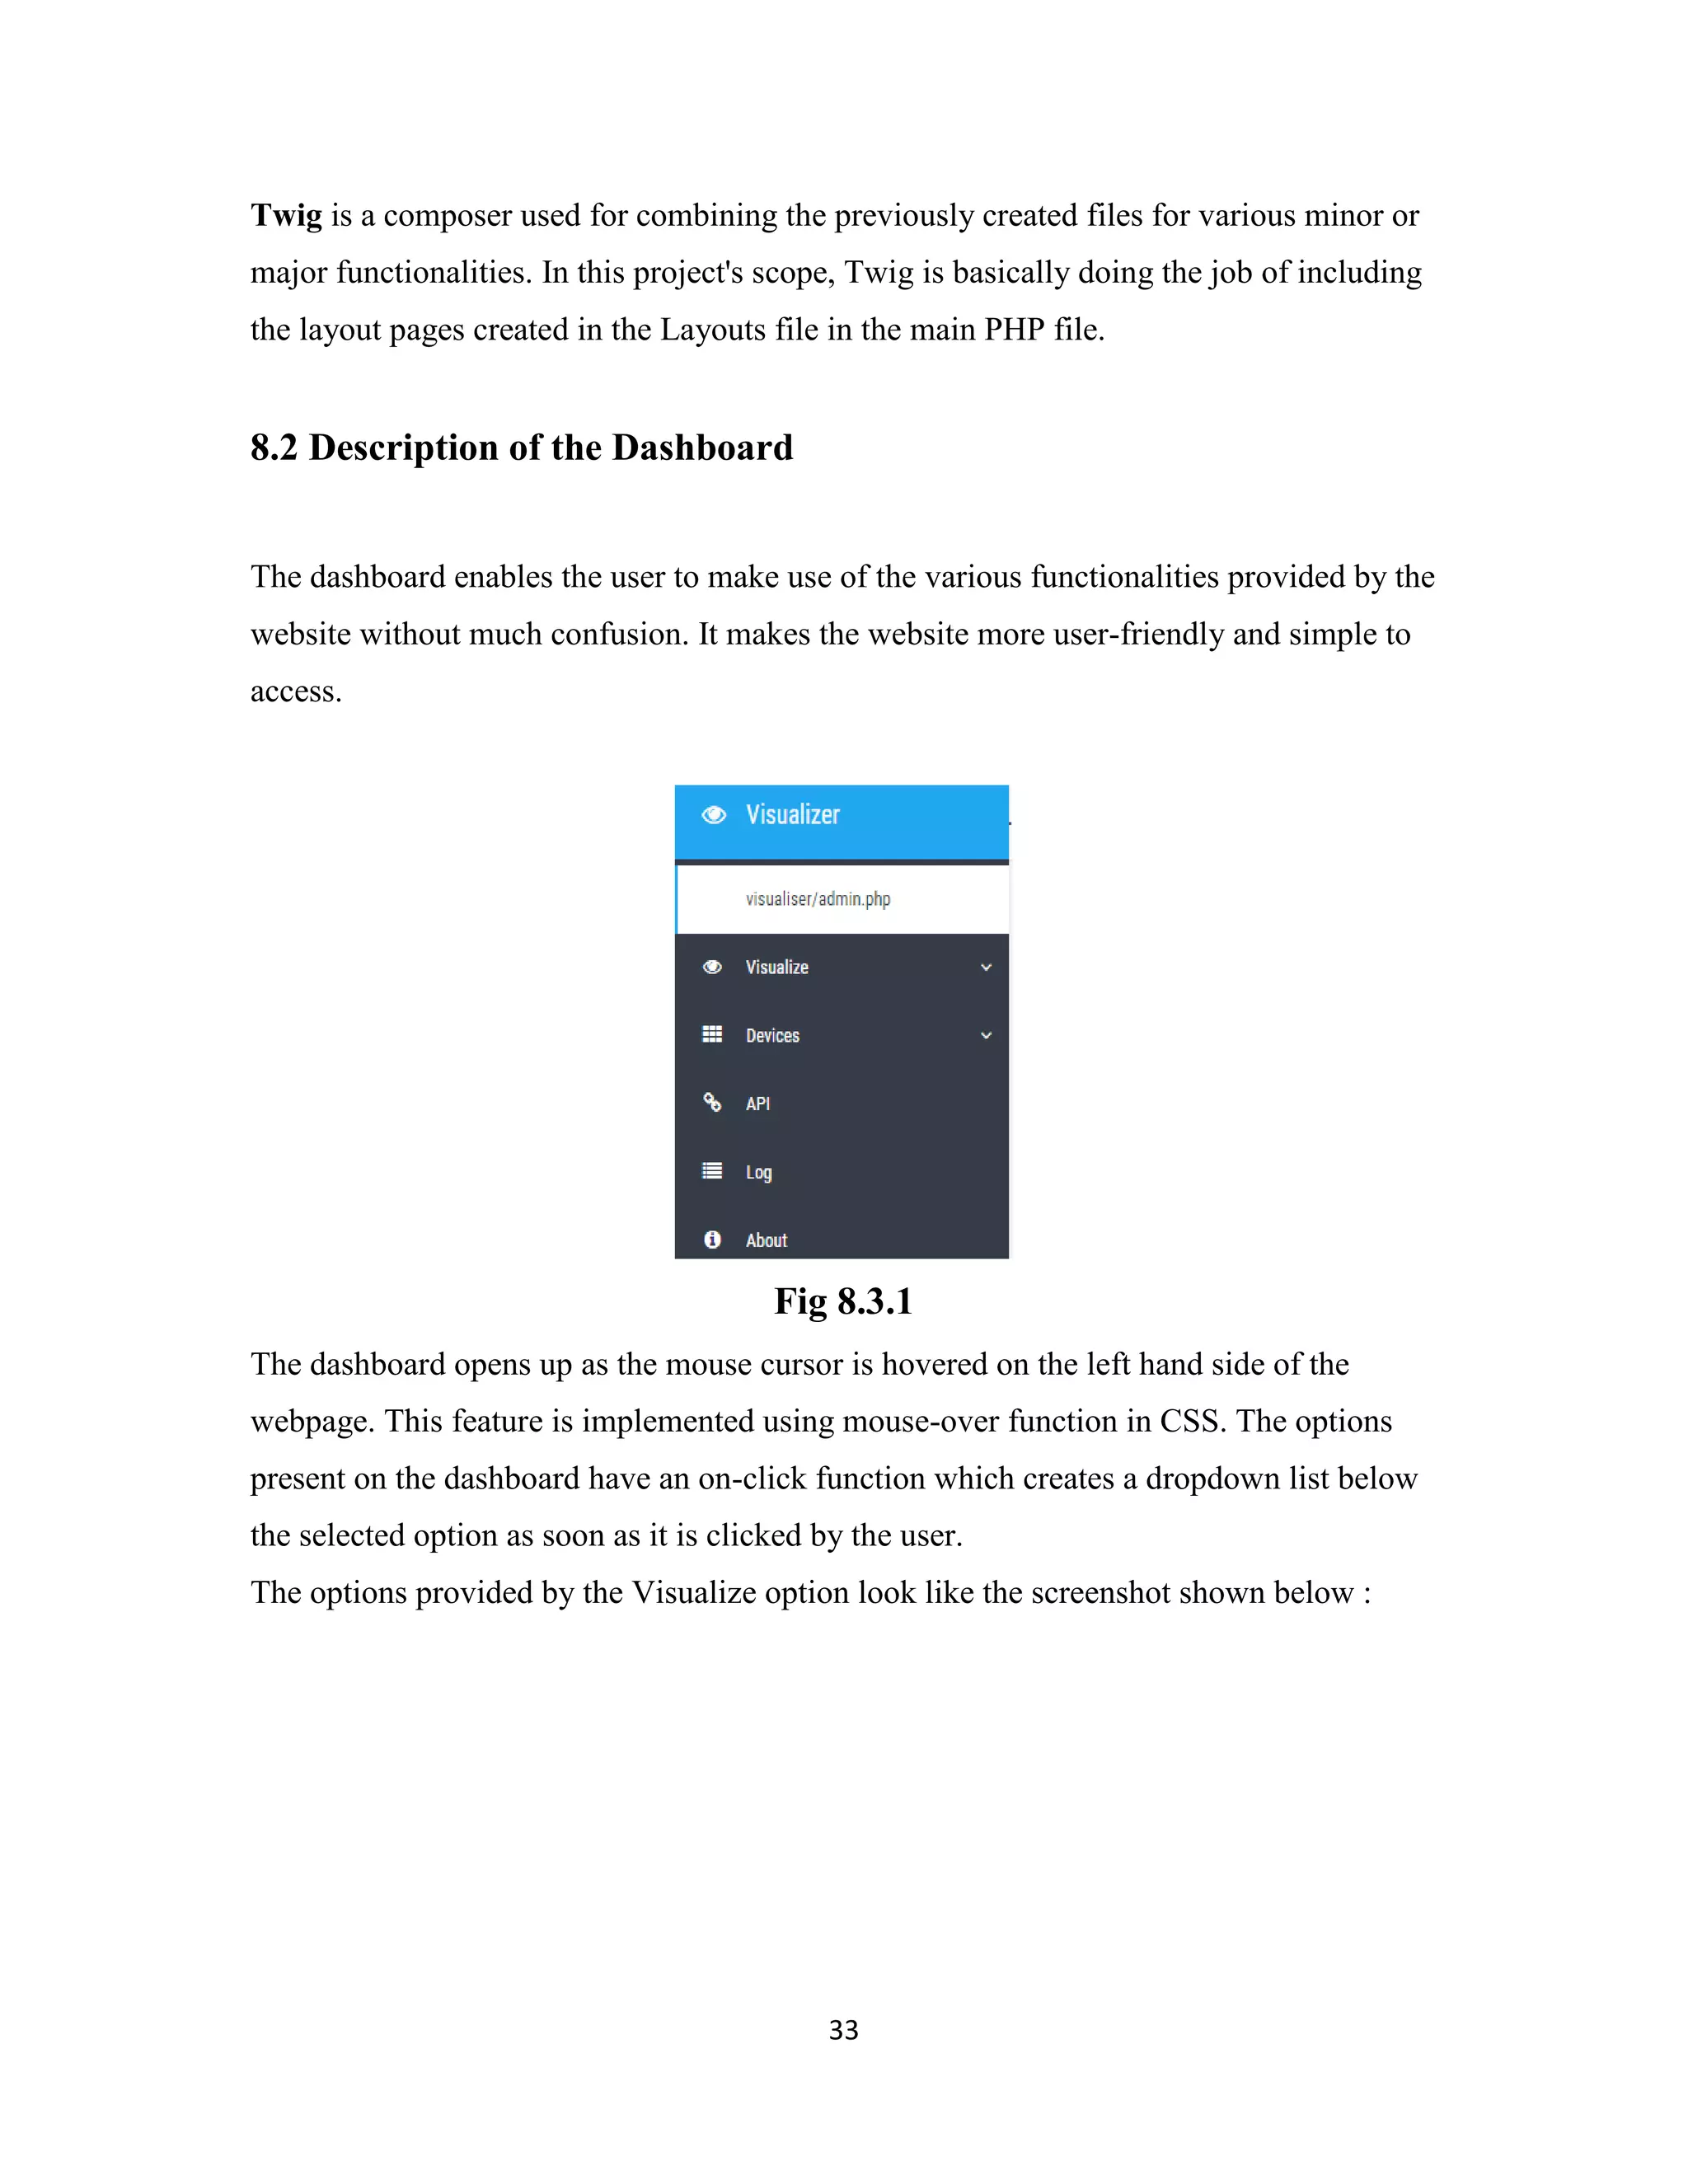
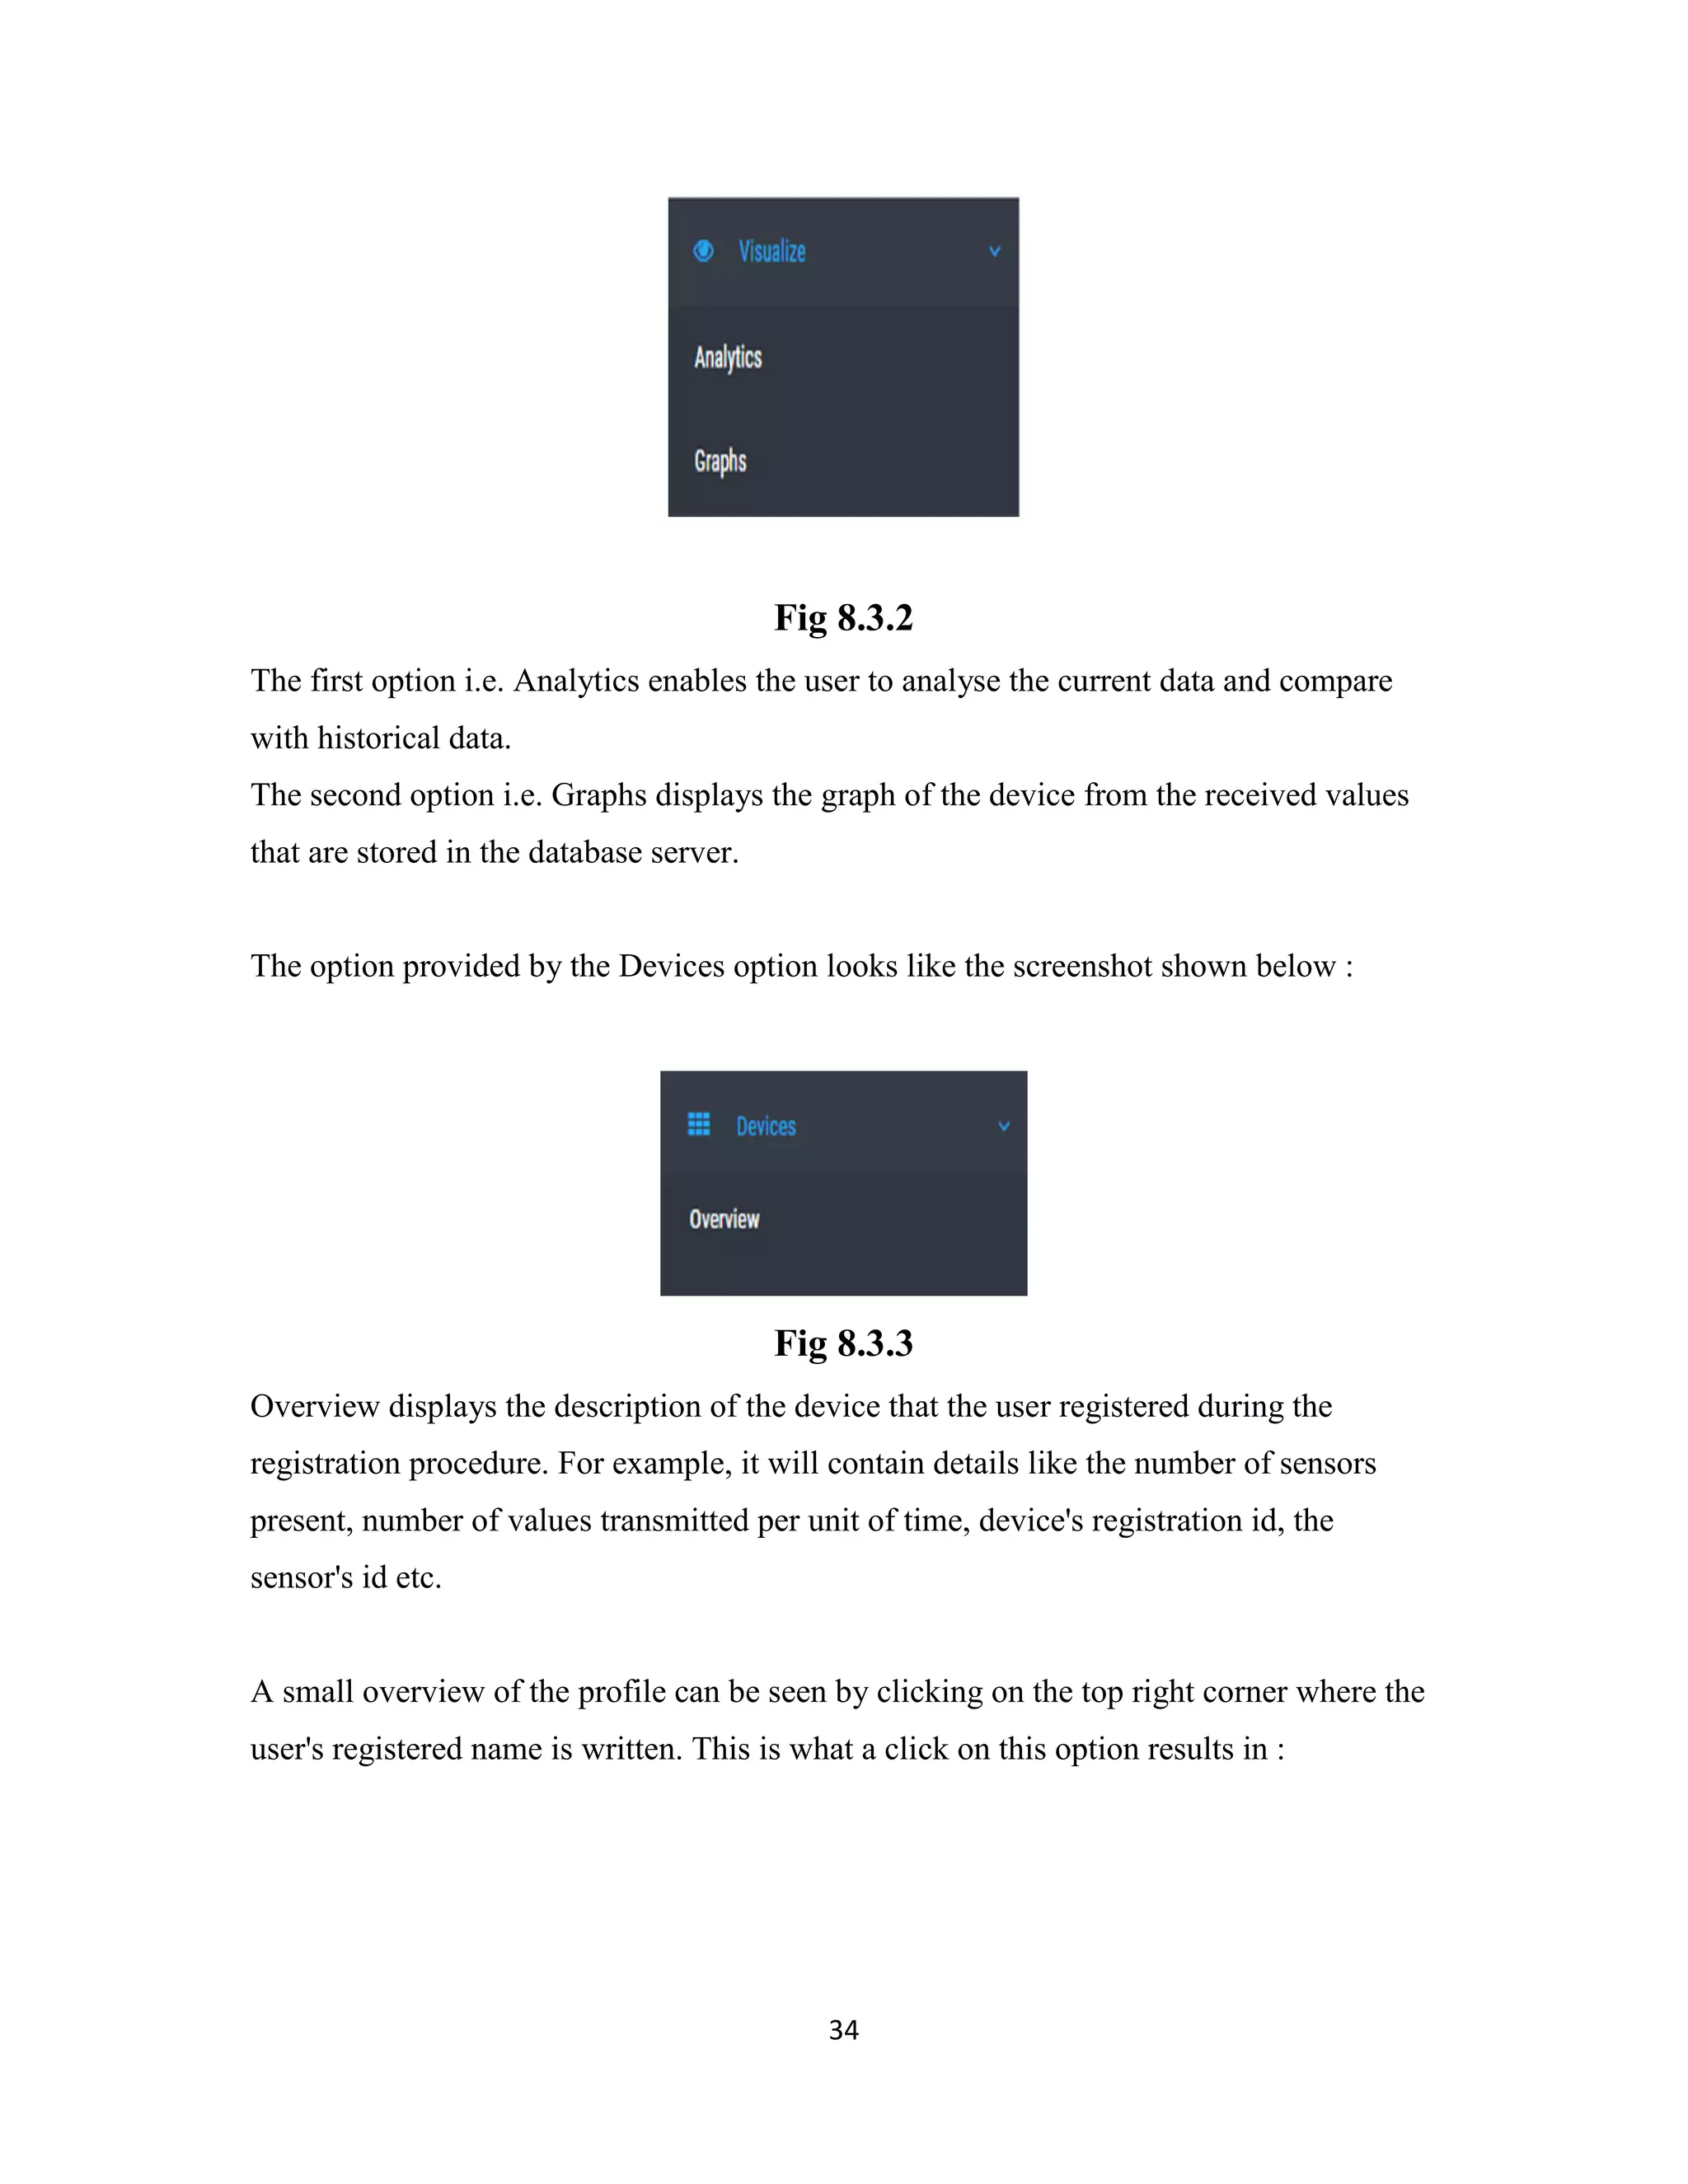
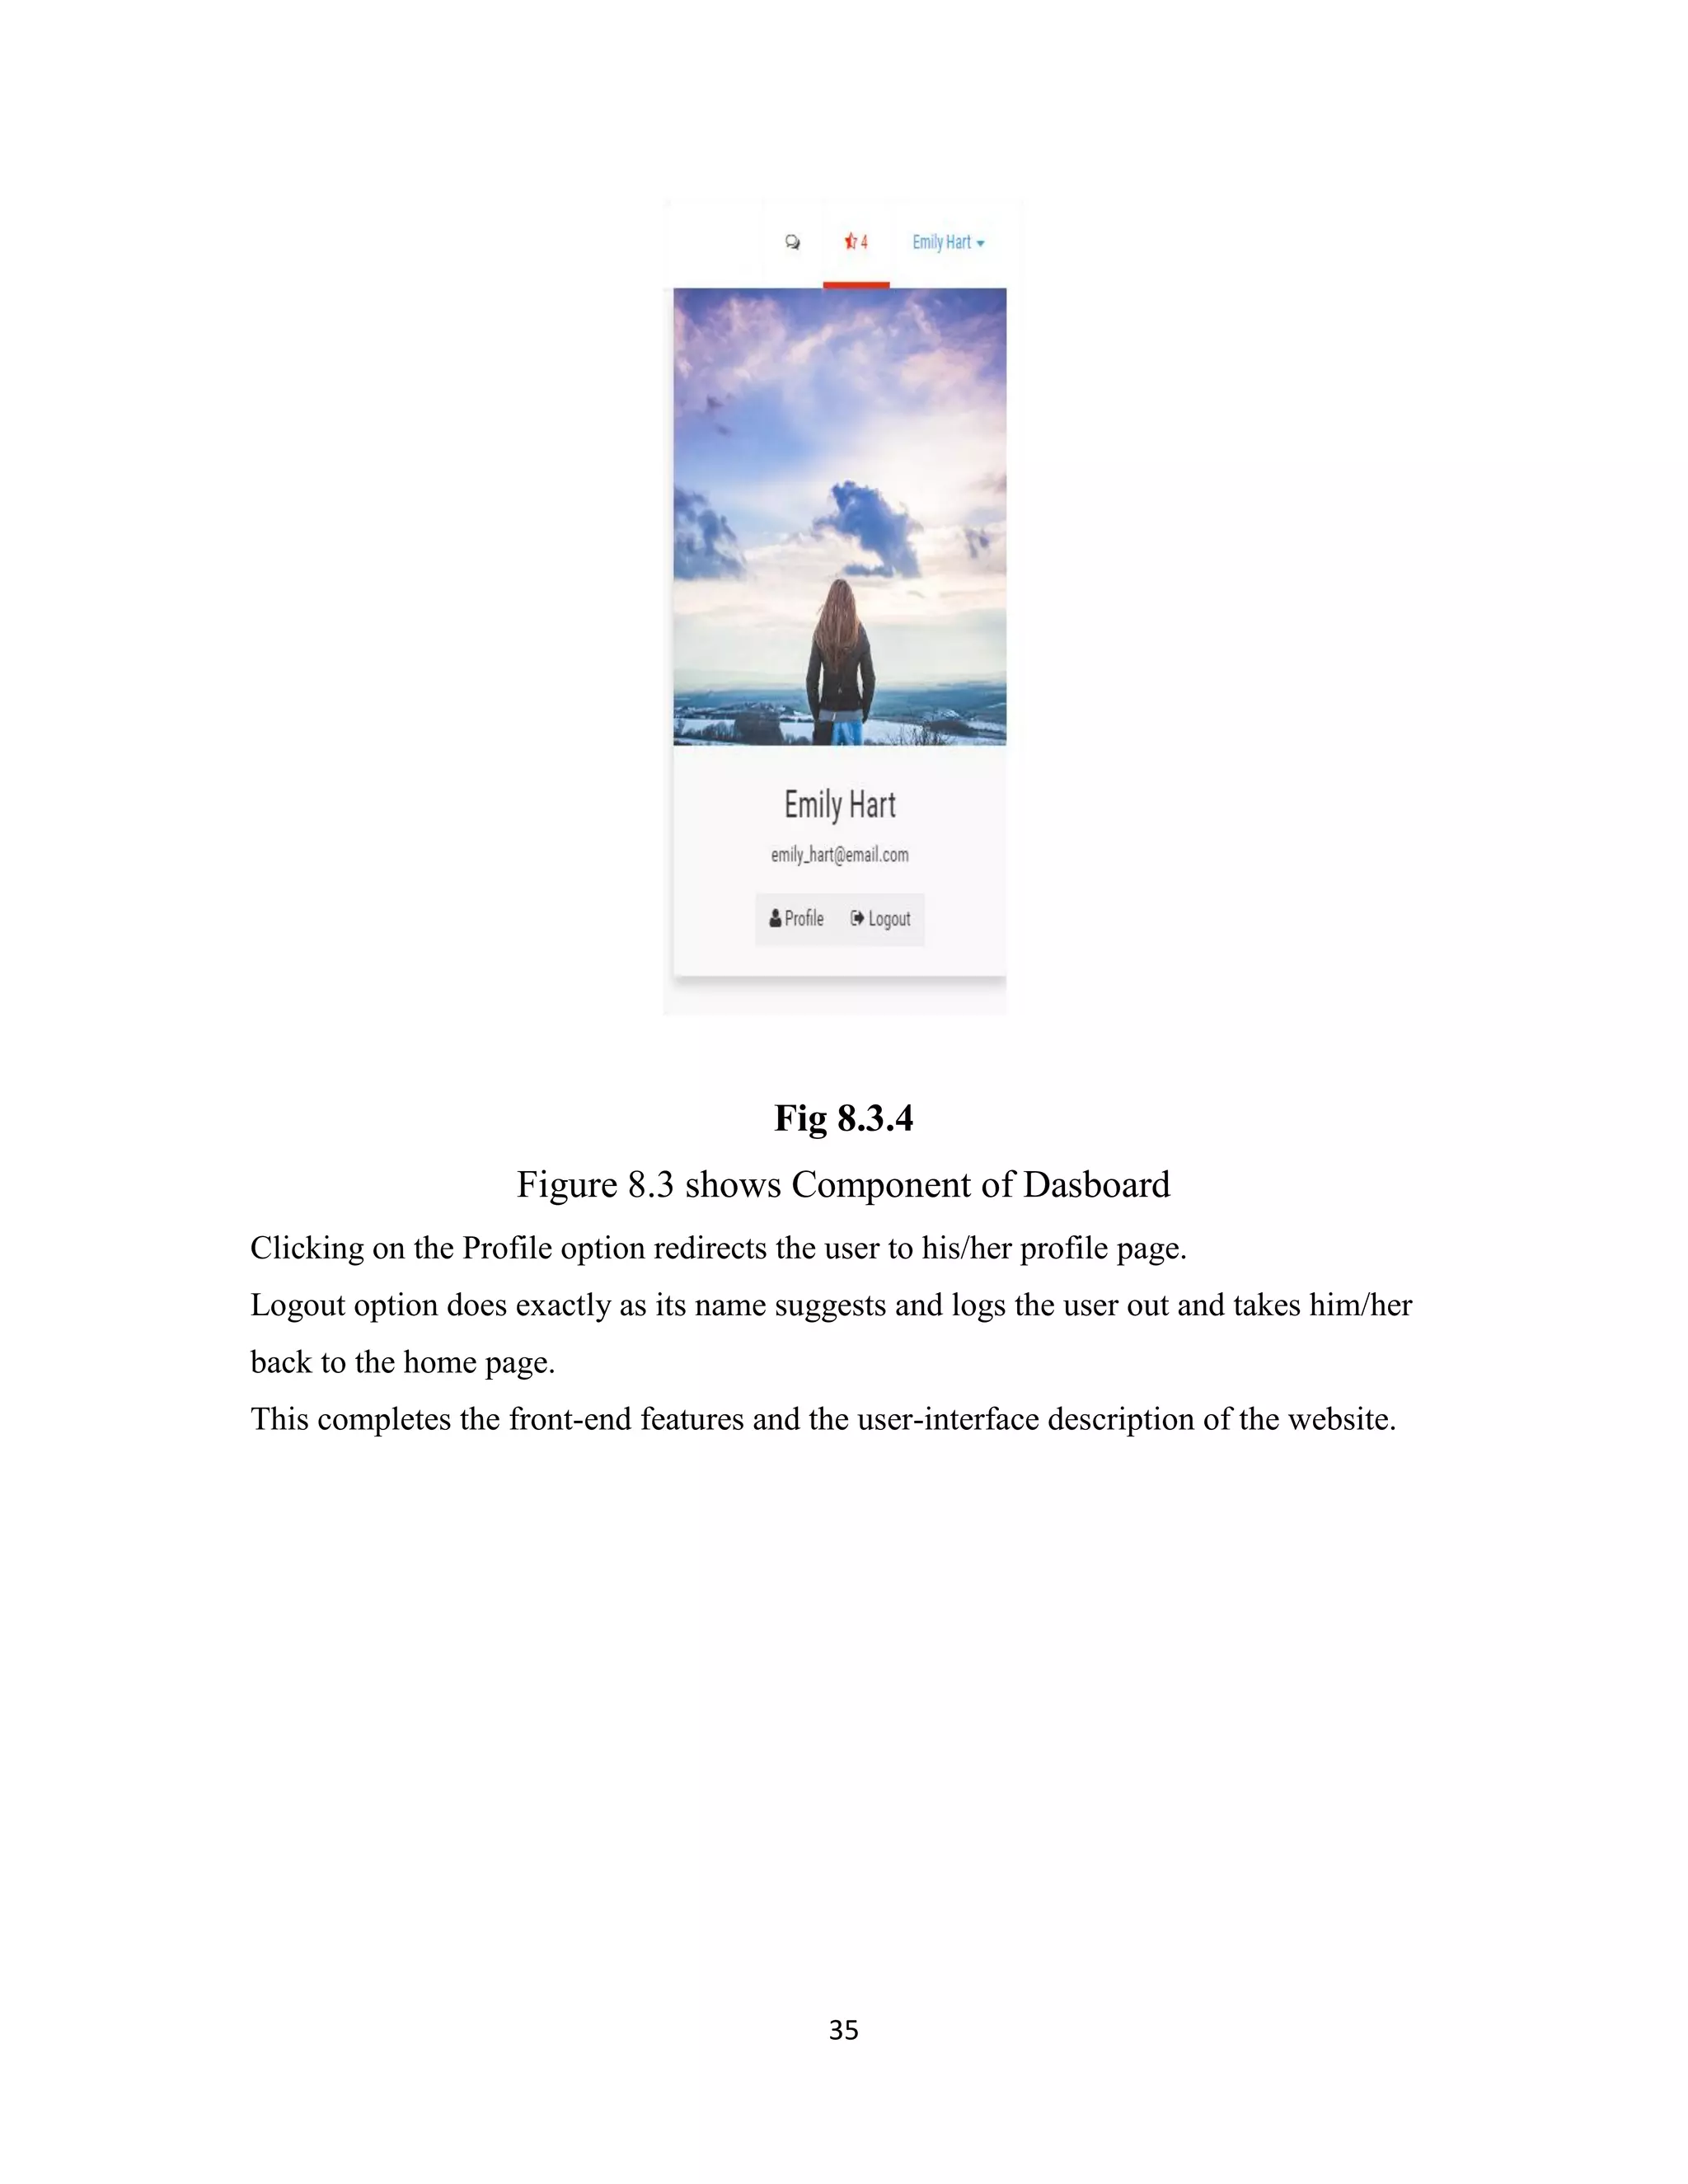
This document describes a six-week industrial training report submitted by Gaurav Gopal Gupta at the Indian Institute of Science. The report focuses on implementing a system for the real-time graphical representation of data from IoT devices. The data is transmitted wirelessly and stored on a server, where it is processed and used to continuously update line graphs. Users can access a website to monitor their data, compare it to historical records, and better understand the information captured by their devices. The system was created using technologies like XAMPP, MySQL, PHP, FusionCharts, and frameworks like MVC and Bootstrap. Devices like Raspberry Pi and Arduino were also used to capture and transmit sensor data.
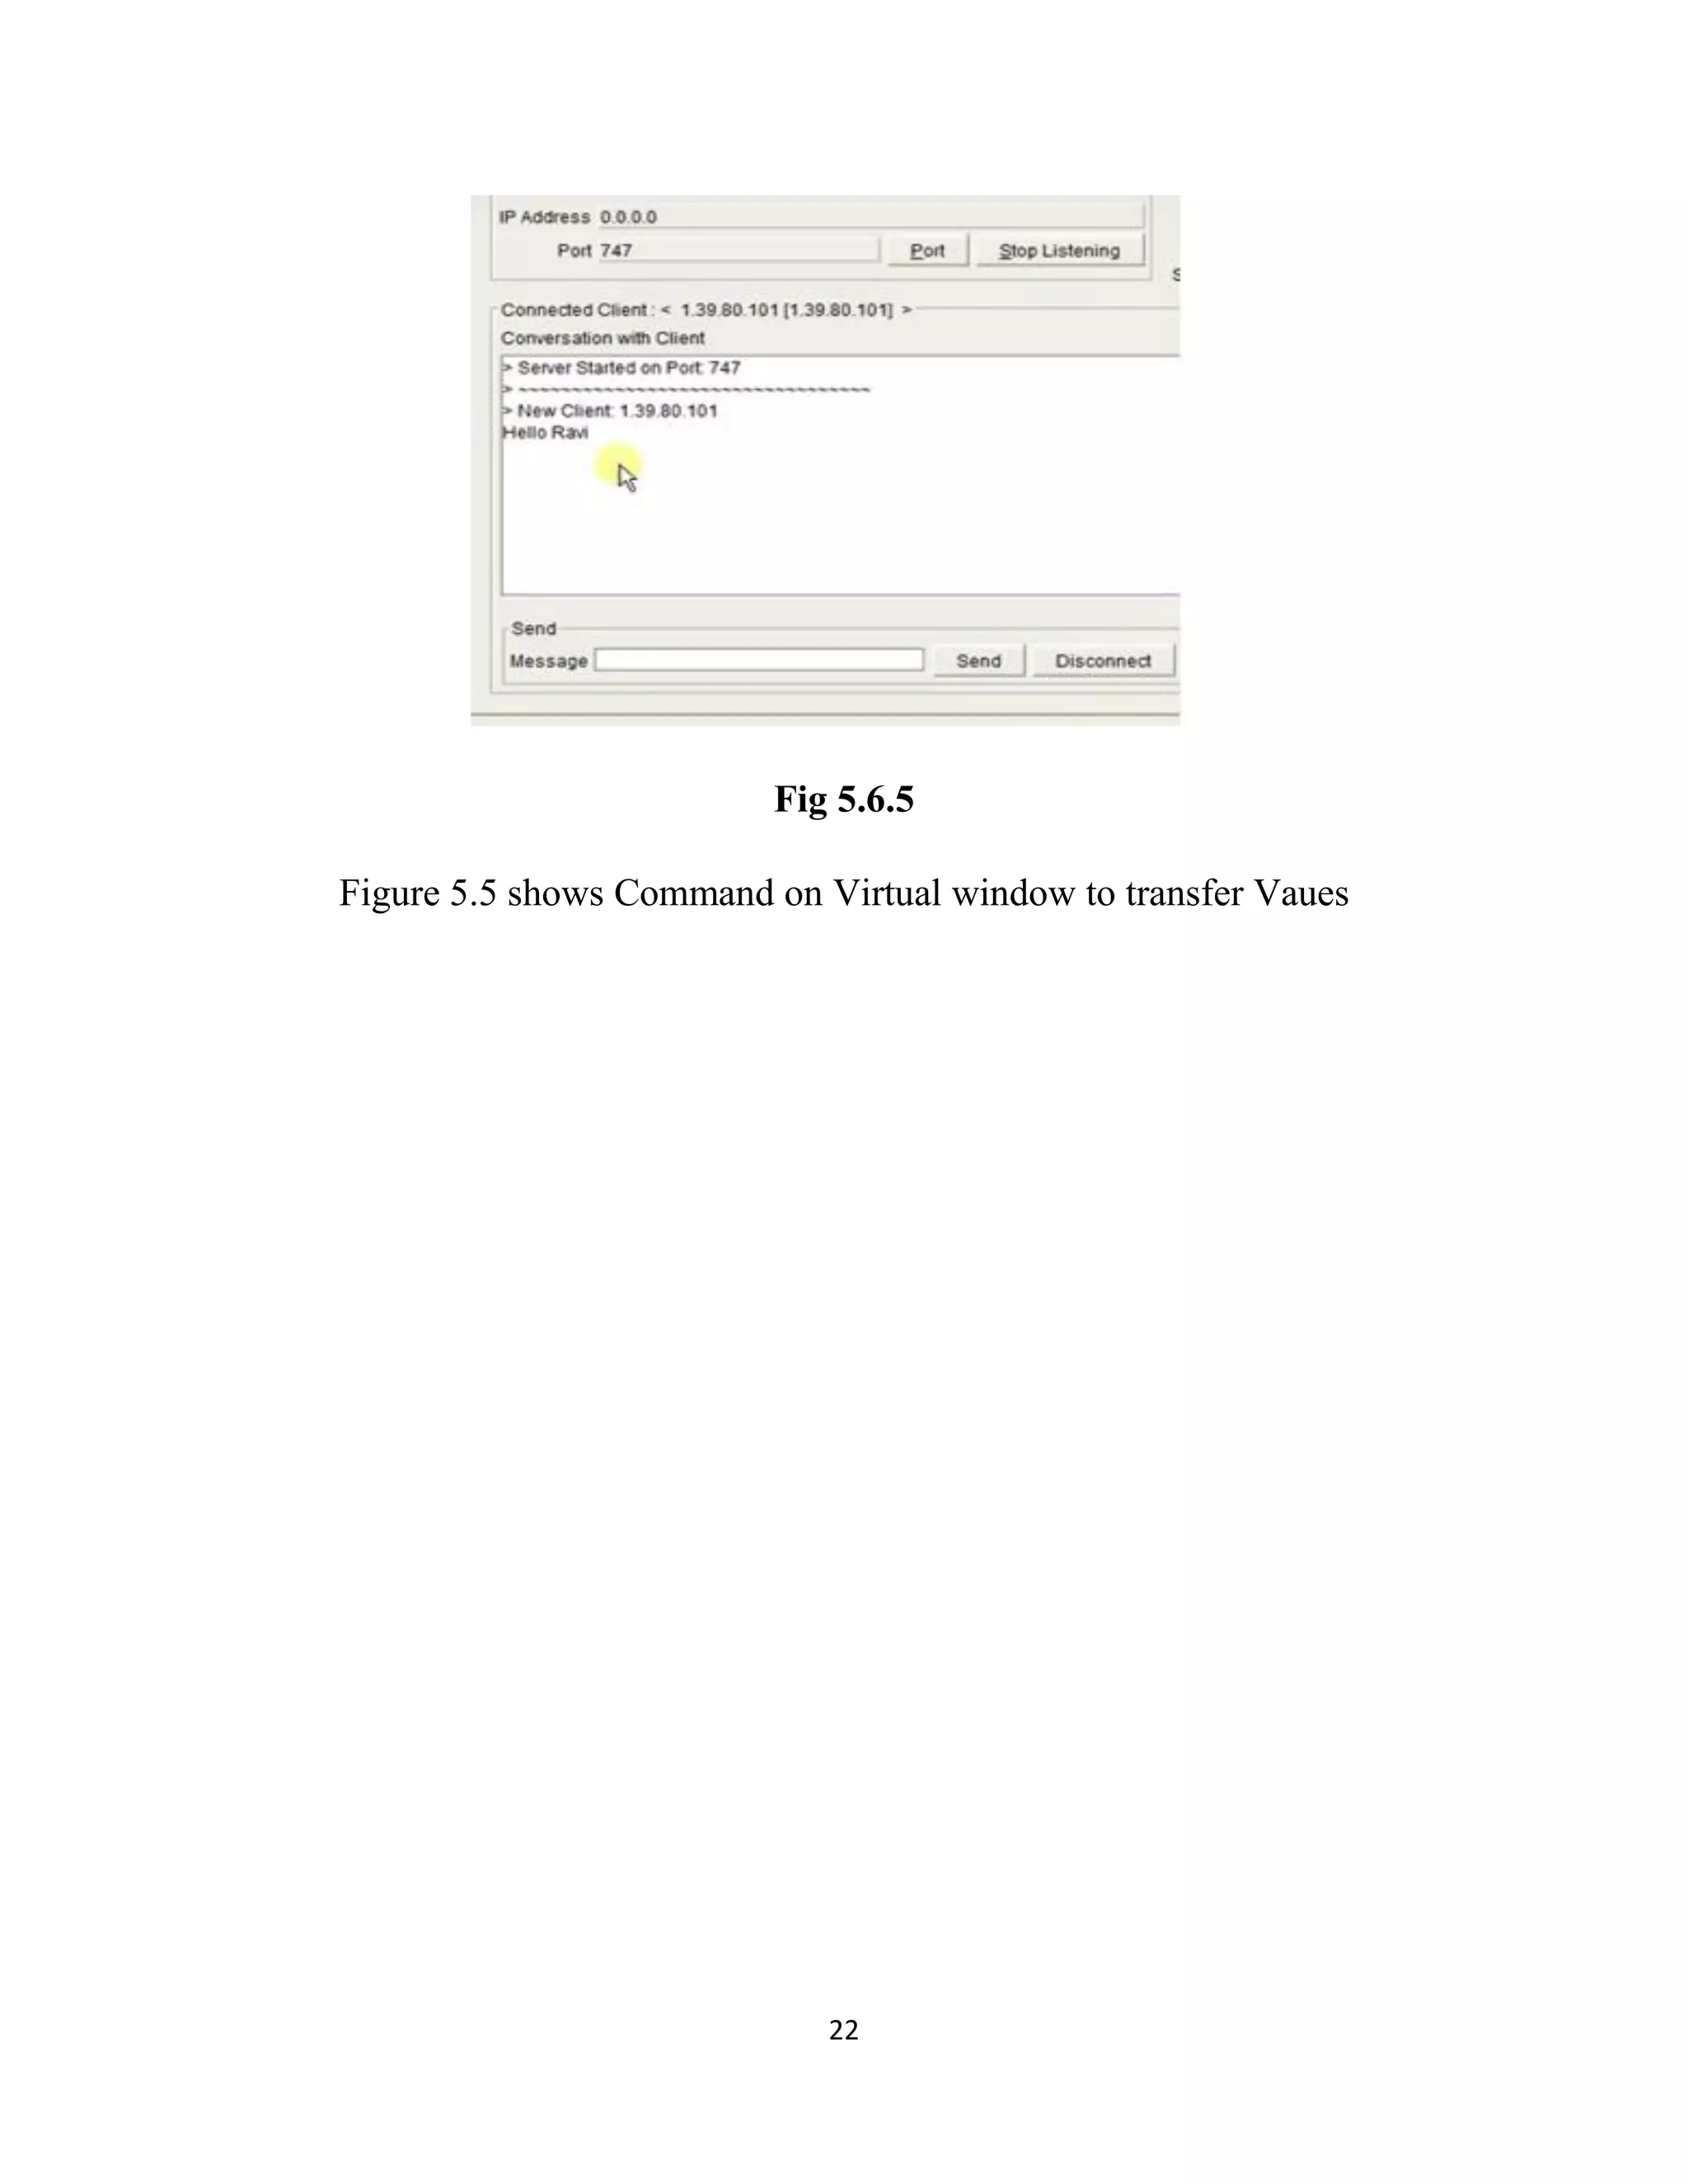
![23
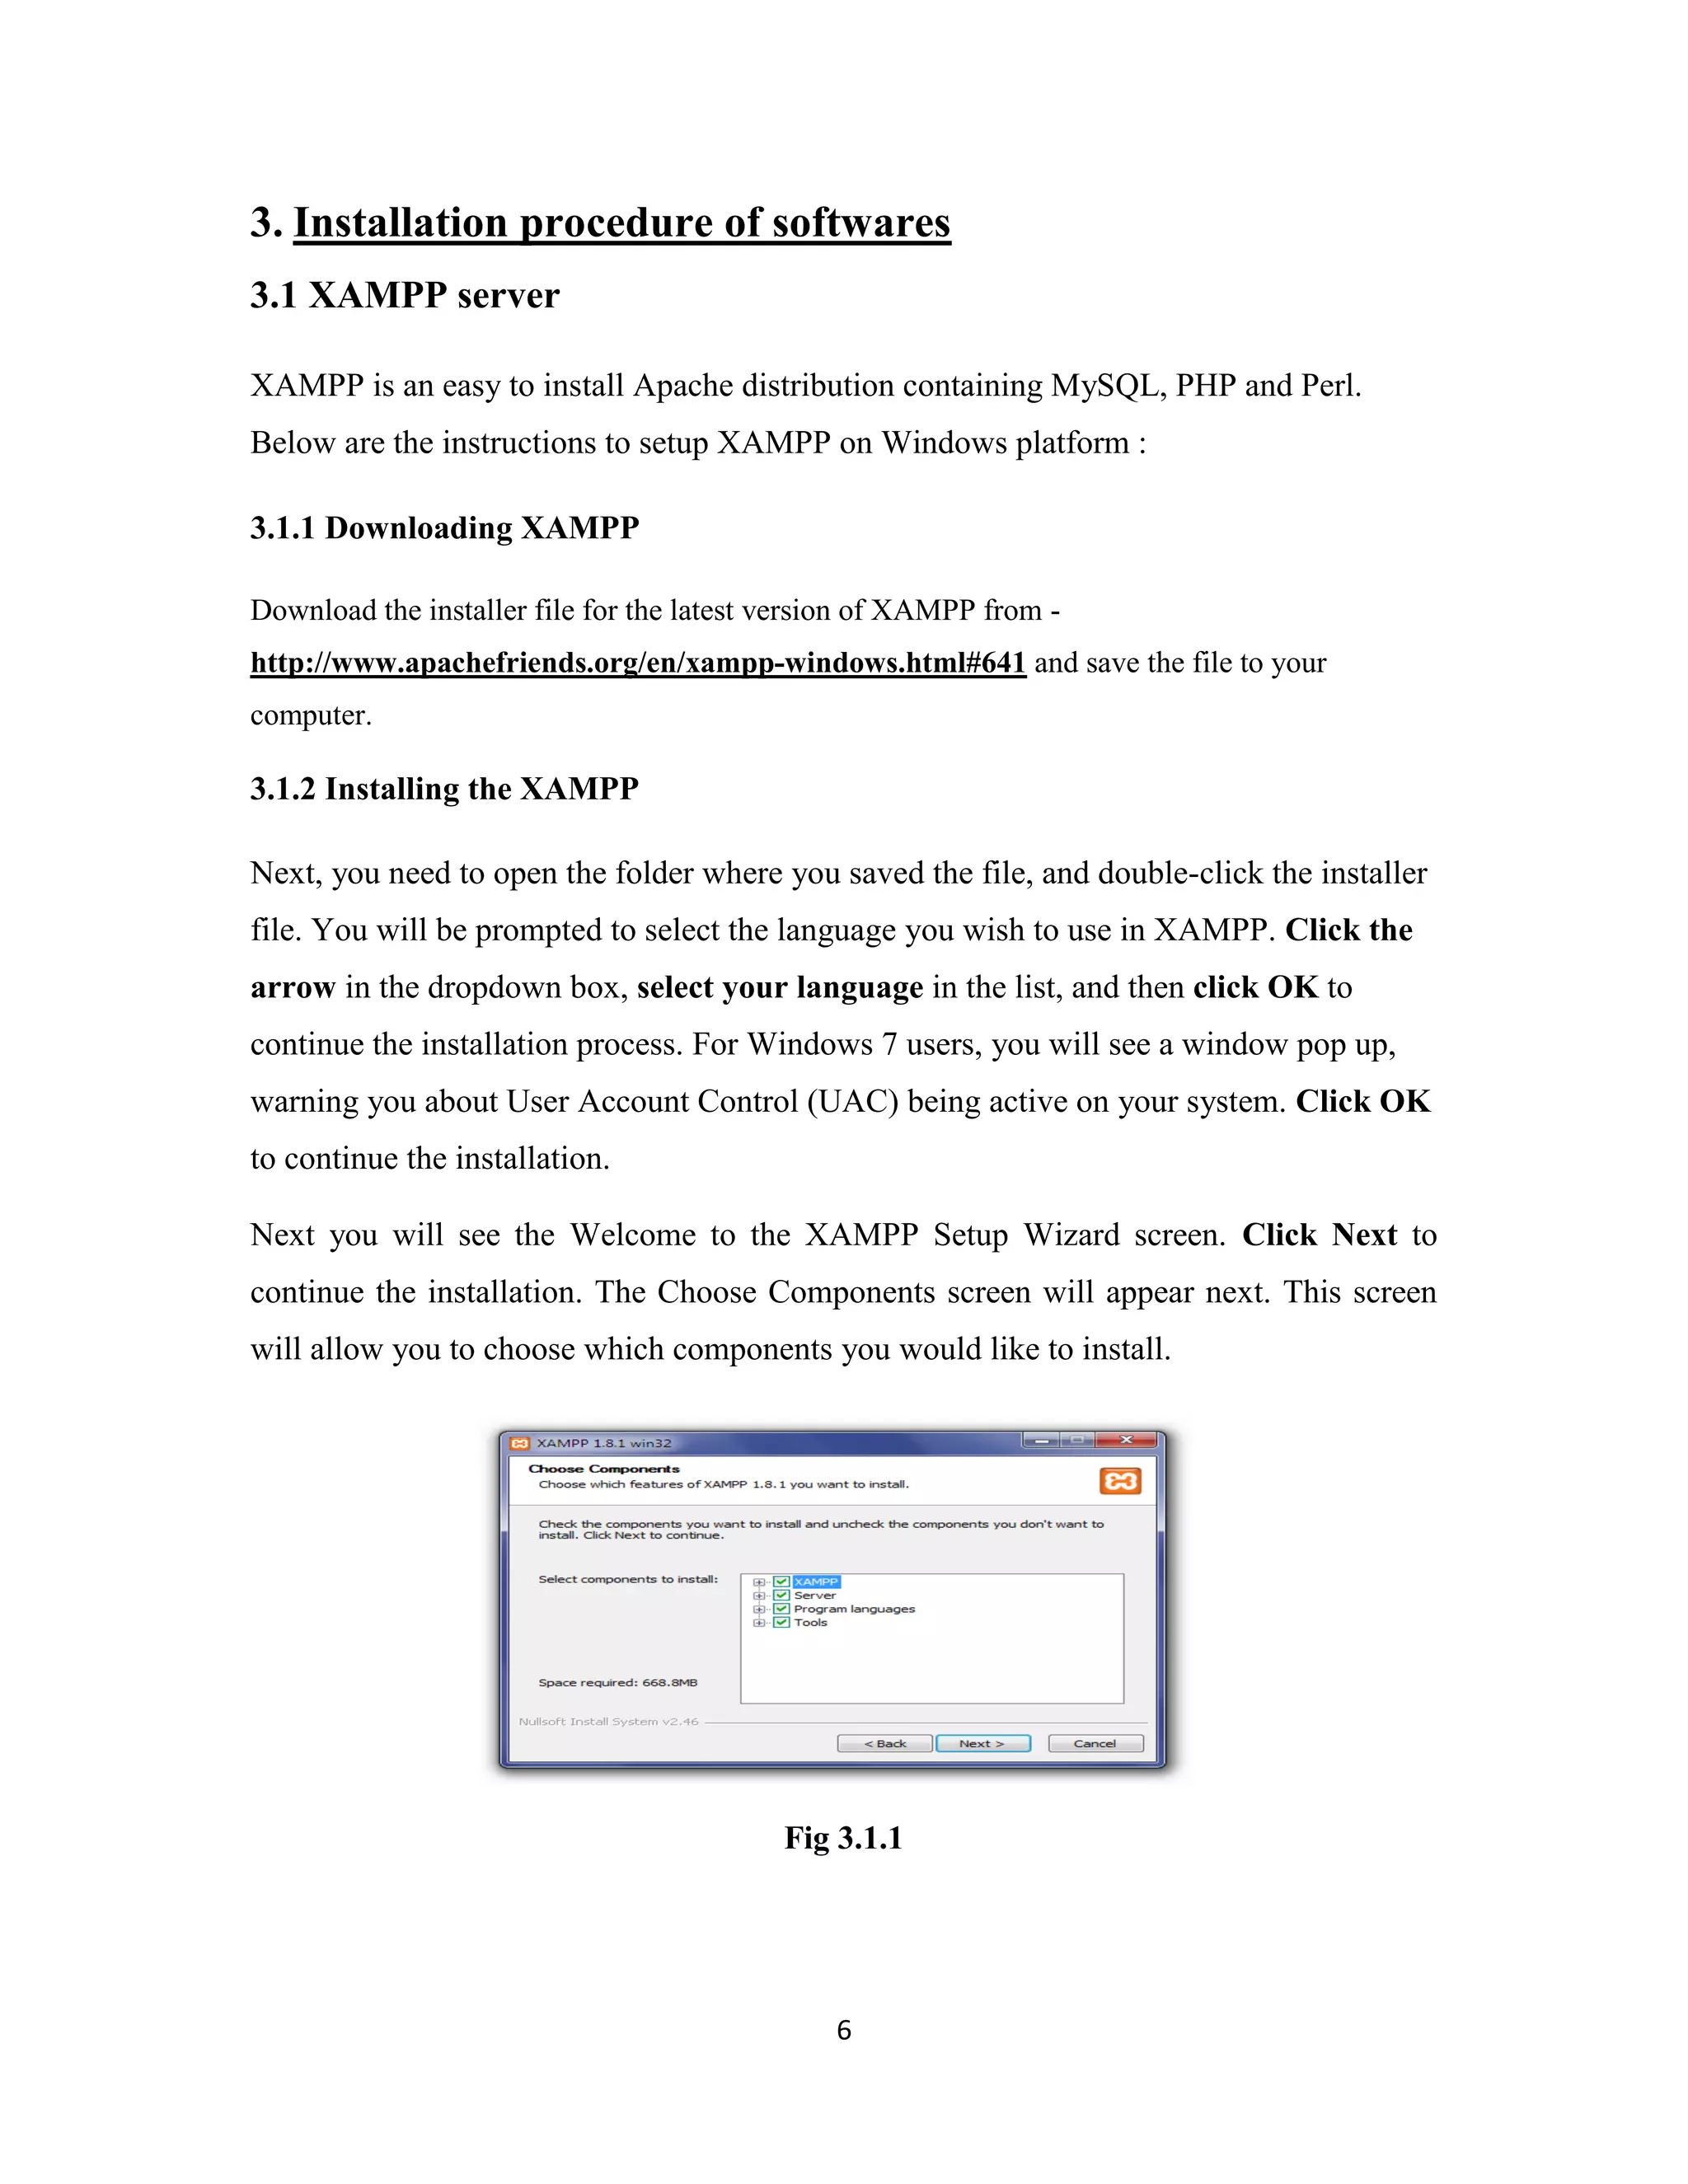
6. Database Handling
6.1 Data acquisition on the server side
Once the values transmission part on the device's end is complete, they have to be stored in a
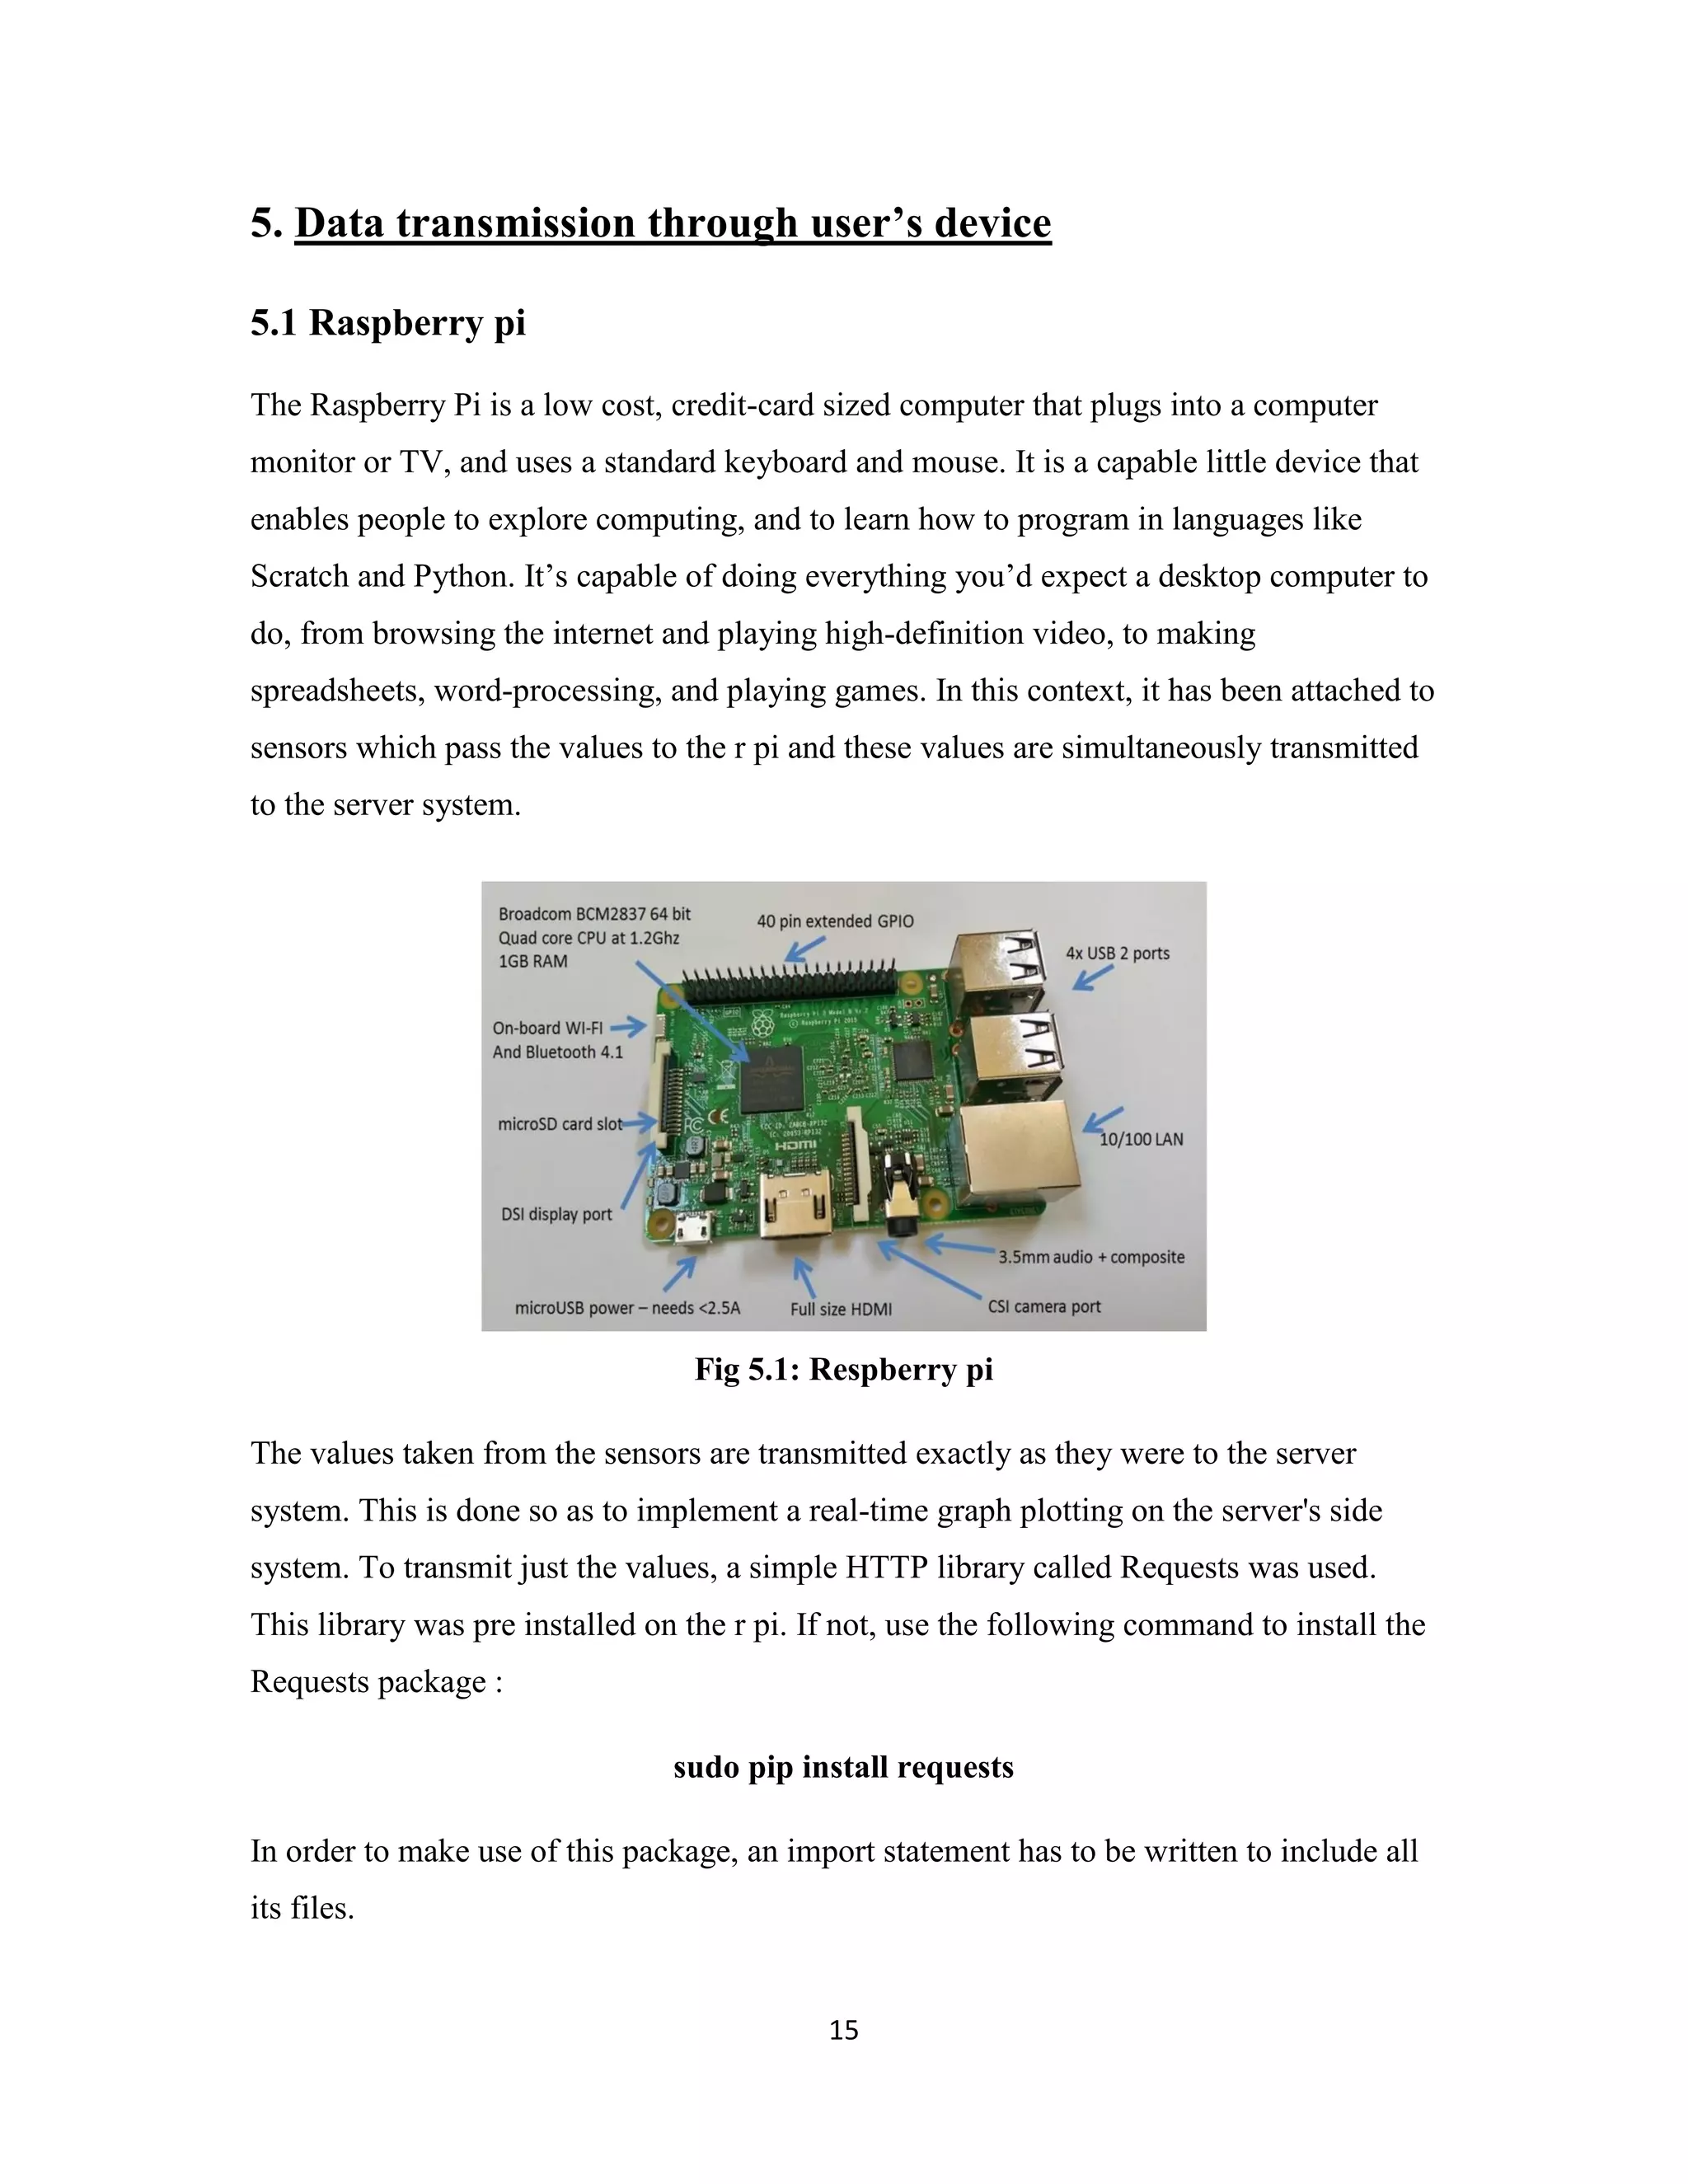
secure location on the server i.e. a database. The server's system has a database created for the
sole purpose of storing the values received during the transmission process. A PHP script is
written on the server system to capture the values and store them on the specified database in
their corresponding columns. Firstly, the required database has to be created on the server by
writing a suitable SQL query. Here we consider gas sensors whose values will be stored in the
database and hence we can write the query accordingly in the following manner :
CREATE DATABASE sensor_log;
CREATE TABLE sensor_log_table
(
device_id int(size),
sensor_id int(size),
acetone float(size),
co2 float(size),
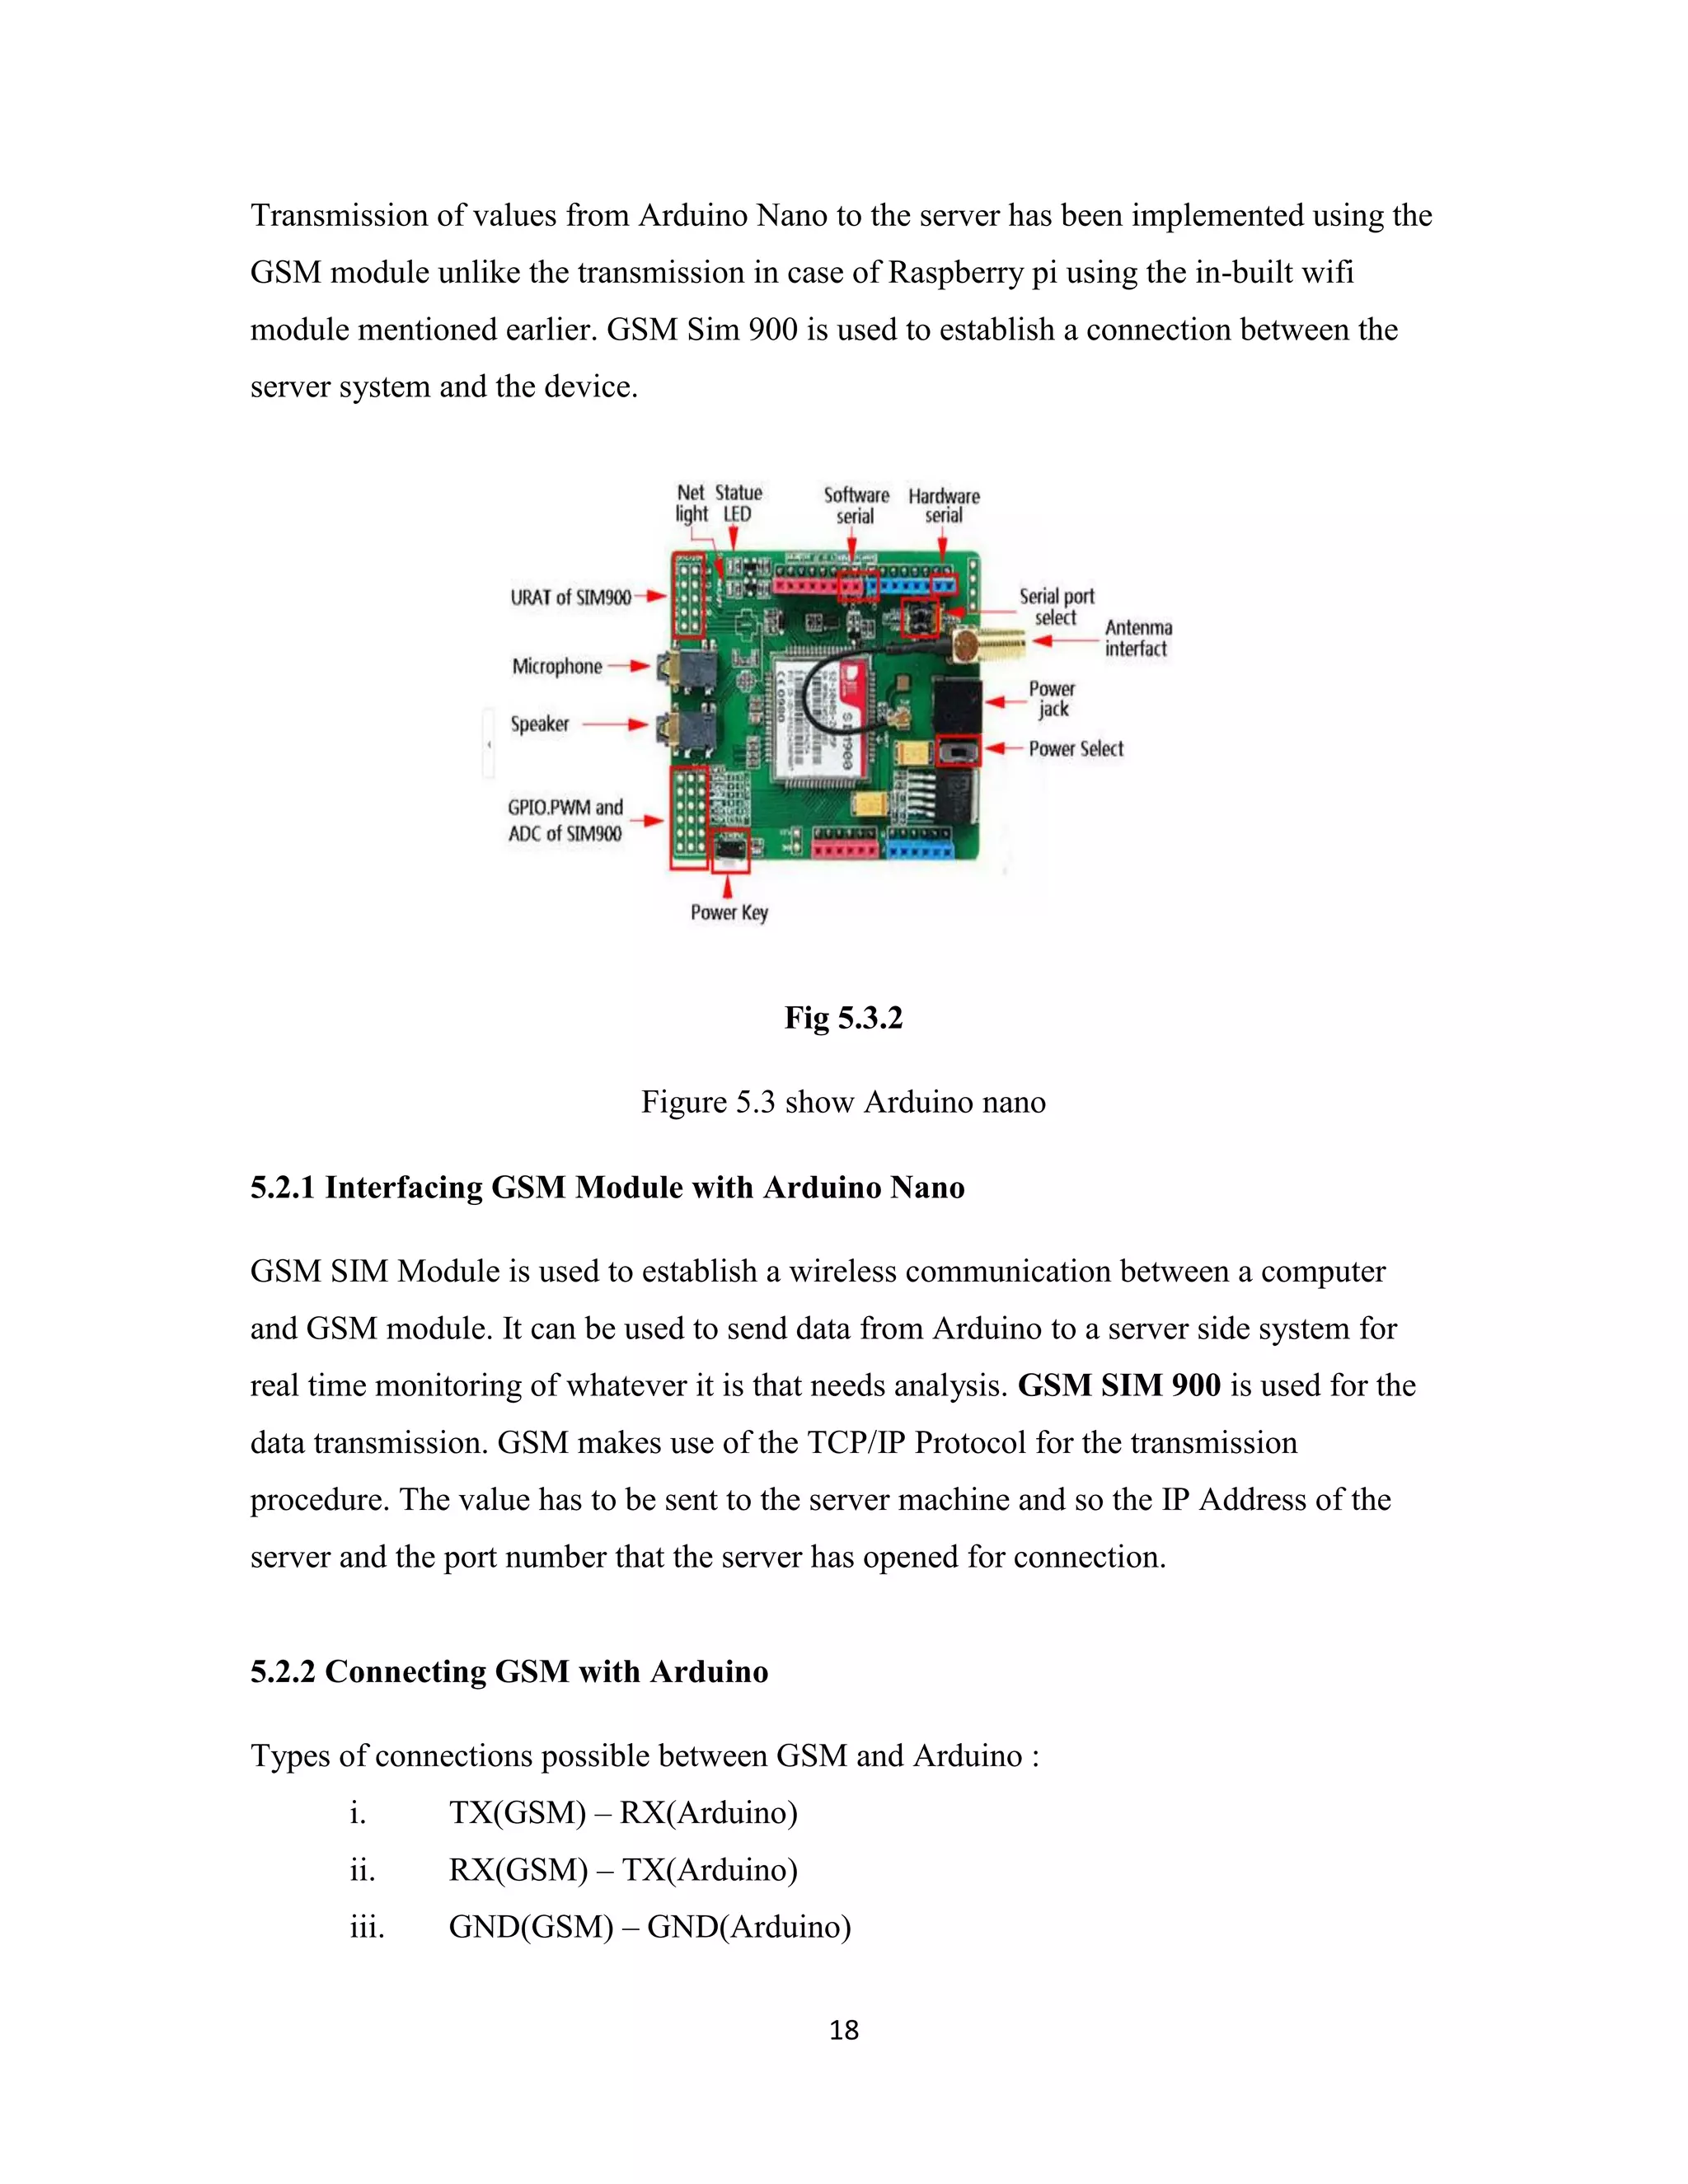
hl float(size),
....
);
This will create a database called sensor_log with a table called sensor_log_table.
The transmitted values of the sensor have to be stored in the corresponding columns to
ensure maintenance of accurate records. Another query is required to ensure this which is
written in the PHP file and it is as follows :
"INSERT INTO sensor_log.sensor_log_table (device_id,sensor_id ,sensor_value)
VALUES ('".$_GET["id"]."', unix_timestamp(),
'".$_GET["acetone"]."',".$_GET["co2"]."')";](https://image.slidesharecdn.com/d66e4308-541c-4051-9a50-a7a027d0ad7b-161106065559/75/combinepdf-29-2048.jpg)
![40
REFERENCES
[1] Lobley, A., Lee Whitmore, and B. A. Wallace. "DICHROWEB: an interactive
website for the analysis of protein secondary structure from circular dichroism
spectra." Bioinformatics 18.1 (2002): 211-212.
[2] Jain, Eric, et al. "Infrastructure for the life sciences: design and implementation of
the UniProt website." BMC bioinformatics 10.1 (2009): 1
[3] www.w3schools.com
[4] www.djangoproject.com
[5] www.python.org
[6] www.tutorialspoint.com/mysql/](https://image.slidesharecdn.com/d66e4308-541c-4051-9a50-a7a027d0ad7b-161106065559/75/combinepdf-46-2048.jpg)


![Qumica geral 1a-parte[1]](https://cdn.slidesharecdn.com/ss_thumbnails/qumicageral-1a-parte1-100316064813-phpapp01-thumbnail.jpg?width=640&height=640&fit=bounds)


![[PPT] _ Unit 2 _ 9.0 _ Domain Specific IoT _Home Automation.pdf](https://cdn.slidesharecdn.com/ss_thumbnails/pptunit29-220516115946-098632b6-thumbnail.jpg?width=640&height=640&fit=bounds)