Colliers north american office highlights 3 q 2010
1. HIGHLIGHTS
NORTH AMERICA
www.colliers.com
Q3 2010 | Office
Ross J. Moore Chief Economist | USA
Without raising expectations to unrealistic levels, this quarter’s results suggest the office market has indeed hit
bottom and has begun what will almost certainly be a very long and slow road to recovery. Although the
economy continues to languish and job growth remains disappointing, third quarter occupancies improved for
the second three month period and the national vacancy rate posted a slight decline. Canadian markets also
registered modest growth, helping to round a good quarter for North American office markets. With both the
U.S. and Canadian economies posting reasonable growth and the addition of more private sector jobs, leasing
markets are expected to continue improving, albeit only in small increments with no sudden surge
anticipated.
Third quarter data reaffirms our view that the U.S. office market has entered the first phase of what will likely
be a multi-stage recovery. Most encouraging is the nine-month-long gain in private sector employment.
Furthermore, office-using employment was reasonably strong during the July-September period, suggesting
office leasing activity is unlikely to fade. The uncertainty surrounding the midterm elections and the possible
extension of the Bush administration tax cuts may dampen office leasing demand for the fourth quarter, but
that should only be a temporary phenomenon. Widespread increases in rents are unlikely anytime soon, but
occupiers in select markets would be wise to lock in today’s lease rates before lower availabilities give land-
lords the upper hand.
U.S. office vacancy rate down marginally. The U.S. national office vacancy rate moved slightly lower during
the third quarter, moving two basis points lower (100 basis points equals one percent). This represented the
Two quarters of positive
absorption shows the
U.S. office market is
now stabilizing after a
two year period of
persistent weakness.
market indicators
Relative to prior period
u.s. Office market
Summary Statistics, Q3 2010
Office Markets Show First Signs of
Beginning a Long Slow Road to Recovery
Q3
2010
Q4
2010*
VACANCY
NET ABSORPTION
construction
rental rate
*Projected
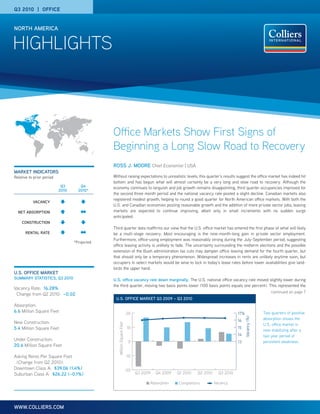
U.S. Office MARKET Q3 2009 – Q3 2010
MillionSquareFeet
Vacancy(%)
-20
-10
0
10
20
Q3 2010Q2 2010Q1 2010Q4 2009Q3 2009
Absorption Completions Vacancy
13
14
15
16
17%
Vacancy Rate: 16.28%
Change from Q2 2010: –0.02
Absorption:
6.6 Million Square Feet
New Construction:
5.4 Million Square Feet
Under Construction:
20.6 Million Square Feet
Asking Rents Per Square Foot
(Change from Q2 2010):
Downtown Class A: $39.06 (1.4%)
Suburban Class A: $26.22 (–0.1%)
continued on page 7
2. p. 2 | Colliers International
highlights | Q3 2010 | office | north America
UNITED STATES | DOWNTOWN OFFICE | ALL INVENTORY
MARKET
EXISTING
INVENTORY (SF)
SEP. 30, 2010
NEW SUPPLY
Q3 2010
(SF)
NEW SUPPLY
YTD 2010
(SF)
UNDER
CONSTRUCTION
(SF)
VACANCY
RATE (%)
JUNE 30, 2010
VACANCY
RATE (%)
SEP. 30, 2010
ABSORPTION
Q3 2010
(SF)
ABSORPTION
YTD 2010
(SF)
Atlanta, GA 56,927,000 0 753,000 0 15.5 15.2 177,000 198,000
Bakersfield, CA 2,966,000 0 0 0 6.9 8.8 (22,000) (11,000)
Baltimore, MD 22,117,000 0 28,000 0 16.6 16.8 (32,000) (90,000)
Boise, ID 3,470,000 0 0 0 10.6 10.7 (3,000) 46,000
Boston, MA 59,292,000 760,000 760,000 674,000 15.5 16.3 210,000 (940,000)
Charleston, SC 2,152,000 61,000 61,000 0 8.5 11.0 (2,000) (2,000)
Charlotte, NC 21,504,000 0 2,050,000 0 15.3 13.6 328,000 461,000
Chicago, IL 131,589,000 0 679,000 0 17.1 17.0 127,000 (89,000)
Cincinnati, OH 11,920,000 0 0 805,000 18.3 17.8 51,000 (56,000)
Cleveland 34,574,000 0 0 0 16.8 18.5 31,000 86,000
Columbia, SC 4,586,000 0 190,000 0 27.1 25.2 87,000 1,000
Columbus, OH 13,318,000 0 0 0 15.3 15.6 (37,000) 39,000
Dallas/Fort Worth, TX 36,666,000 0 0 0 26.1 25.5 204,000 (389,000)
Denver, CO 25,704,000 0 0 0 14.9 14.4 346,000 (31,000)
Detroit, MI 30,148,000 0 0 0 17.7 17.2 68,000 (499,000)
Fresno, CA 3,263,000 50,000 58,000 0 9.4 10.9 (5,000) (7,000)
Ft. Lauderdale/Broward Co., FL 9,004,000 0 13,000 0 14.1 13.4 62,000 (33,000)
Greenville, SC 3,182,000 0 53,000 0 18.7 18.5 (11,000) (53,000)
Hartford, CT 9,707,000 0 0 180,000 20.9 22.5 (41,000) (243,000)
Honolulu, HI 8,074,000 0 0 0 11.8 11.7 0 (85,000)
Houston, TX 36,969,000 0 0 1,817,000 14.1 14.9 (210,000) (554,000)
Jacksonville, FL 15,984,000 0 0 0 12.9 14.3 (8,000) 45,000
Kansas City, KS 26,535,000 0 0 0 14.9 15.4 (68,000) (123,000)
Las Vegas, NV 3,601,000 0 0 0 14.3 15.6 (53,000) (164,000)
Little Rock, AR 6,513,000 (71,000) (49,000) 0 13.2 10.9 90,000 124,000
Los Angeles, CA 32,039,000 0 0 0 16.2 16.4 (64,000) (527,000)
Louisville, KY 17,065,000 0 0 0 8.9 9.3 0 (24,000)
Memphis, TN 7,996,000 0 0 0 14.6 14.7 (14,000) (45,000)
Miami-Dade County, FL 17,329,000 0 1,335,000 606,000 21.9 21.7 34,000 144,000
Nashville, TN 3,830,000 0 0 0 24.4 16.3 (5,000) 67,000
New York, NY – Downtown Manhattan 87,333,000 0 2,000,000 2,600,000 16.4 16.4 (2,000) (3,810,000)
New York, NY – Midtown Manhattan 200,280,000 0 1,100,000 0 13.3 12.7 1,243,000 4,358,000
New York, NY – Midtown S. Manhattan 71,893,000 0 317,000 0 11.7 11.1 460,000 300,000
Oakland, CA 16,892,000 0 0 62,000 12.6 12.8 (37,000) (1,000)
Orlando, FL 12,208,000 284,000 284,000 105,000 14.6 15.4 (142,000) 192,000
Philadelphia, PA 41,599,000 0 0 0 12.6 12.9 (134,000) (296,000)
Phoenix, AZ 19,957,000 0 769,000 0 19.4 21.6 (113,000) (130,000)
Pleasanton/Walnut Creek, CA 10,722,000 0 0 0 19.2 19.1 13,000 (44,000)
Portland, OR 33,342,000 0 369,000 62,000 8.7 8.9 335,000 226,000
Raleigh/Durham/Chapel Hill, NC 10,787,000 0 0 165,000 5.7 5.1 102,000 201,000
Reno, NV 1,327,000 0 0 0 28.8 27.5 18,000 (59,000)
Sacramento, CA 18,328,000 18,000 18,000 0 8.9 8.9 11,000 (91,000)
San Diego County, CA 10,207,000 0 0 0 16.8 17.2 (45,000) (24,000)
San Francisco, CA 83,224,000 0 110,000 277,000 15.2 14.9 192,000 (34,000)
San Jose/Silicon Valley, CA 7,593,000 0 0 0 25.3 25.0 (29,000) (156,000)
Seattle/Puget Sound, WA 59,688,000 172,000 1,332,000 847,000 15.9 15.6 189,000 373,000
St. Louis, MO 26,457,000 0 0 0 14.8 14.7 (225,000) (109,000)
Stamford, CT 18,449,000 0 0 400,000 17.7 17.8 (23,000) (697,000)
Stockton/San Joaquin County, CA 8,500,000 0 0 0 18.1 17.8 58,000 116,000
Tampa, FL 9,356,000 0 14,000 0 14.6 13.9 20,000 135,000
Washington, DC 139,749,000 365,000 2,646,000 1,550,000 11.7 11.6 882,000 2,808,000
West Palm Beach/Palm Beach Co., FL 9,830,000 0 0 0 18.8 19.8 (95,000) (54,000)
White Plains, NY 8,234,000 0 0 0 11.5 11.2 31,000 240,000
U.S. TOTAL/AVERAGE 1,563,979,000 1,639,000 14,891,000 10,151,000 14.94 14.86 3,948,000 690,000
3. highlights | Q3 2010 | office | north America
Colliers International | p. 3
united states | downtown office | class a
MARKET
EXISTING
INVENTORY (SF)
SEP. 30, 2010
VACANCY
RATE (%)
june 30,
2010
VACANCY
RATE (%)
SEP. 30,
2010
ABSORPTION
Q3 2010
(SF)
ABSORPTION
YTD 2010
(SF)
AVERAGE ANNUAL
QUOTED RENT
(USD PSF)
SEP. 30, 2010
QUARTERLY
CHANGE
IN RENT
(%)
ANNUAL
CHANGE
IN RENT
(%)
Atlanta, GA 31,486,000 20.2 19.5 216,000 398,000 21.40 0.4 0.7
Bakersfield, CA 670,000 6.0 6.5 (3,000) 13,000 17.40 0.0 0.0
Baltimore, MD 9,799,000 18.1 18.5 (35,000) (65,000) 23.70 -2.1 -5.3
Boise, ID 2,038,000 5.2 4.6 12,000 27,000 18.00 0.0 -11.1
Boston, MA 40,536,000 13.8 15.4 25,000 (498,000) 45.60 0.1 -5.0
Charleston, SC 1,059,000 7.4 8.7 (14,000) (14,000) 24.20 0.0 -14.9
Charlotte, NC 15,507,000 18.2 15.6 389,000 528,000 25.60 -3.5 -11.5
Chicago, IL 74,484,000 18.0 17.8 173,000 263,000 32.50 1.6 -1.5
Cincinnati, OH 5,996,000 18.9 18.7 10,000 (31,000) 21.90 0.1 -6.8
Cleveland 9,728,000 11.4 11.7 (11,000) 8,000 20.70 0.4 -0.3
Columbia, SC 2,250,000 14.0 13.4 14,000 (25,000) 19.70 0.0 -0.5
Columbus, OH 5,600,000 15.0 9.6 36,000 106,000 19.40 -5.3 -15.9
Dallas/Fort Worth, TX 22,612,000 23.3 23.7 (72,000) (321,000) 25.20 -0.2 -1.2
Denver, CO 18,085,000 15.2 13.2 354,000 (28,000) 26.30 -0.9 1.0
Detroit, MI 11,563,000 18.0 17.5 54,000 (284,000) 22.70 0.4 0.9
Fresno, CA 1,039,000 8.7 8.7 0 11,000 24.60 0.0 -2.4
Ft. Lauderdale/Broward Co., FL 4,479,000 20.9 19.8 49,000 (23,000) 32.40 -1.4 1.1
Greenville, SC 1,897,000 9.8 8.0 15,000 11,000 19.50 -4.7 -9.5
Hartford, CT 6,369,000 20.2 22.1 (114,000) (279,000) 23.20 -0.3 -1.3
Honolulu, HI 4,709,000 12.8 11.8 36,000 (29,000) 35.60 -0.7 -0.6
Houston, TX 26,727,000 9.3 10.1 (194,000) (436,000) 35.20 -2.0 -6.1
Jacksonville, FL 6,659,000 16.0 16.3 (20,000) (25,000) 20.20 0.7 -1.7
Kansas City, KS 7,933,000 22.4 22.4 1,000 54,000 20.90 -0.2 4.0
Las Vegas, NV 700,000 11.1 12.4 (18,000) (44,000) 34.90 0.0 -11.1
Little Rock, AR 2,636,000 12.6 3.3 3,000 (28,000) 16.50 0.0 0.9
Los Angeles, CA 15,084,000 15.1 14.8 42,000 (409,000) 39.00 0.3 -0.9
Louisville, KY 4,206,000 7.6 8.5 (14,000) (19,000) 22.80 2.7 8.2
Memphis, TN 1,898,000 23.1 24.3 (22,000) (24,000) 16.80 -1.5 -0.2
Miami-Dade County, FL 9,211,000 24.8 24.6 19,000 97,000 41.80 -0.5 -3.8
Nashville, TN 7,580,000 23.5 23.5 (11,000) (1,000) 22.70 -12.7 1.7
New York, NY – Downtown Manhattan 58,670,000 20.0 20.1 212,000 1,777,000 39.80 -0.2 -12.9
New York, NY – Midtown Manhattan 161,280,000 15.3 14.6 94,000 3,138,000 63.20 0.7 -7.6
New York, NY – Midtown S. Manhattan 29,954,000 14.0 12.8 263,000 1,626,000 42.50 0.1 -14.2
Oakland, CA 10,198,000 10.3 10.8 (46,000) 90,000 31.10 0.4 -4.4
Orlando, FL 5,583,000 17.0 17.9 (53,000) (38,000) 24.10 -0.9 -7.2
Philadelphia, PA 31,537,000 11.4 12.1 (209,000) (336,000) 26.00 -0.3 1.0
Phoenix, AZ 9,694,000 21.4 22.4 (95,000) (16,000) 28.30 11.1 5.9
Pleasanton/Walnut Creek, CA 6,975,000 21.5 21.3 13,000 (33,000) 26.20 -0.5 -3.1
Portland, OR 13,001,000 7.9 7.6 265,000 146,000 24.40 0.7 -2.9
Raleigh/Durham/Chapel Hill, NC 3,870,000 7.5 4.9 (22,000) 32,000 17.20 -24.7 -22.8
Reno, NV 548,000 23.5 19.3 23,000 (10,000) 23.50 0.0 5.9
Sacramento, CA 8,910,000 10.1 9.4 54,000 (6,000) 32.50 -1.5 -2.2
San Diego County, CA 6,977,000 16.0 15.9 3,000 33,000 29.30 -2.0 -7.6
San Francisco, CA 52,123,000 15.2 15.1 70,000 (161,000) 36.20 8.7 -2.8
San Jose/Silicon Valley, CA 3,365,000 35.1 35.0 (35,000) (119,000) 34.70 -2.0 -8.3
Seattle/Puget Sound, WA 19,687,000 32.4 30.5 320,000 550,000 28.40 2.9 9.2
St. Louis, MO 11,941,000 15.5 15.5 (206,000) (53,000) 19.10 -1.5 0.3
Stamford, CT 12,450,000 – – (21,000) (613,000) 40.70 9.9 –
Stockton/San Joaquin County, CA 2,773,000 27.0 26.5 65,000 210,000 18.40 -10.9 53.0
Tampa, FL 4,809,000 18.0 16.9 18,000 104,000 22.80 0.2 -3.0
Washington, DC 87,848,000 14.6 14.3 864,000 3,134,000 52.30 2.1 5.5
West Palm Beach/Palm Beach Co., FL 3,323,000 22.9 25.0 (68,000) (62,000) 36.90 -1.7 -5.2
White Plains, NY 5,402,000 14.2 13.3 42,000 267,000 29.10 -0.1 –
U.S. TOTAL/AVERAGE 903,463,000 16.19 15.87 2,471,000 8,594,000 39.10 1.39 -2.56
28.20 -0.43 -2.57
weighted
equal
4. p. 4 | Colliers International
highlights | Q3 2010 | office | north America
UNITED STATES | SUBURBAN OFFICE | ALL INVENTORY
MARKET
EXISTING
INVENTORY (SF)
SEP. 30, 2010
NEW SUPPLY
Q3 2010
(SF)
NEW SUPPLY
YTD 2010
(SF)
UNDER
CONSTRUCTION
(SF)
VACANCY
RATE (%)
JUNE 30, 2010
VACANCY
RATE (%)
SEP. 30, 2010
ABSORPTION
Q3 2010
(SF)
ABSORPTION
YTD 2010
(SF)
Atlanta, GA 186,627,000 21,000 1,093,000 291,000 18.2 18.3 (212,000) (180,000)
Bakersfield, CA 5,968,000 0 0 0 10.0 10.6 (35,000) 60,000
Baltimore, MD 102,760,000 737,000 1,295,000 1,355,000 12.9 13.2 290,000 874,000
Boise, ID 10,784,000 134,000 0 30,000 20.4 20.8 (66,000) (141,000)
Boston, MA 104,373,000 356,000 356,000 59,000 19.8 18.9 1,270,000 1,495,000
Charleston, SC 8,500,000 3,000 566,000 0 20.4 20.6 (14,000) 564,000
Charlotte, NC 70,045,000 46,000 100,000 342,000 15.3 14.6 299,000 306,000
Chicago, IL 104,819,000 0 204,000 110,000 23.6 24.2 (506,000) (538,000)
Cincinnati, OH 25,119,000 70,000 287,000 294,000 24.7 25.2 (95,000) (297,000)
Cleveland 91,335,000 16,000 83,000 385,000 10.4 10.3 31,000 86,000
Columbia, SC 4,782,000 0 0 0 21.3 21.1 10,000 (84,000)
Columbus, OH 35,152,000 0 0 90,000 17.3 18.5 (143,000) 29,000
Dallas/Fort Worth, TX 265,026,000 0 1,584,000 186,000 17.8 17.3 1,356,000 775,000
Denver, CO 129,389,000 298,000 28,000 28,000 15.0 15.6 (343,000) 185,000
Detroit, MI 99,957,000 27,000 43,000 705,000 20.9 21.4 (151,000) (205,000)
Fairfield, CA 3,607,000 0 0 0 26.4 26.6 (9,000) (93,000)
Fairfield County, CT 40,843,000 0 0 33,000 10.2 10.5 (29,000) (167,000)
Fresno, CA 17,782,000 15,000 147,000 0 15.7 15.1 106,000 92,000
Ft. Lauderdale/Broward Co., FL 44,281,000 0 183,000 0 14.8 14.5 145,000 337,000
Greenville, SC 4,335,000 0 0 0 21.3 23.3 (141,000) (89,000)
Hartford, CT 12,352,000 0 0 14,000 15.3 15.0 47,000 (15,000)
Honolulu, HI 7,690,000 0 0 0 - - (32,000) (112,000)
Houston, TX 157,637,000 0 34,000 400,000 17.2 17.1 185,000 242,000
Jacksonville, FL 58,655,000 10,000 10,000 0 11.6 15.5 (101,000) 289,000
Kansas City, KS 78,166,000 16,000 21,000 99,000 12.9 13.1 (143,000) (151,000)
Las Vegas, NV 38,394,000 21,000 109,000 85,000 25.7 25.1 172,000 (230,000)
Little Rock, AR 7,432,000 (1,000) (10,000) 23,000 10.3 10.6 (19,000) (199,000)
Los Angeles – Inland Empire, CA 21,938,000 0 41,000 0 24.7 25.2 (91,000) (126,000)
Los Angeles, CA 165,877,000 0 518,000 781,000 17.7 18.0 (498,000) (2,229,000)
Louisville, KY 33,604,000 0 243,000 4,000 17.5 13.5 (59,000) (212,000)
Memphis, TN 27,978,000 0 0 12,000 13.0 13.0 (3,000) 84,000
Miami-Dade County, FL 64,821,000 174,000 616,000 380,000 15.0 14.7 340,000 589,000
Nashville, TN 23,423,000 55,000 528,000 102,000 11.4 11.1 179,000 511,000
New Jersey – Central 65,911,000 0 46,000 343,000 22.3 22.1 92,000 (536,000)
New Jersey – Northern 95,461,000 0 0 58,000 17.9 18.5 (593,000) (476,000)
Oakland, CA 15,877,000 0 0 0 17.1 17.2 24,000 34,000
Orange County, CA 77,351,000 0 0 0 23.1 22.4 301,000 (963,000)
Orlando, FL 54,416,000 0 55,000 670,000 17.3 17.4 (41,000) 27,000
Philadelphia, PA 109,291,000 558,000 713,000 563,000 16.3 16.3 390,000 616,000
Phoenix, AZ 109,058,000 86,000 553,000 508,000 23.3 22.9 96,000 94,000
Pleasanton/Walnut Creek, CA 32,108,000 0 0 0 18.8 20.7 (617,000) (561,000)
Portland, OR 44,378,000 0 252,000 0 13.1 12.9 (215,000) (86,000)
Raleigh/Durham/Chapel Hill, NC 71,022,000 118,000 356,000 123,000 15.0 14.4 444,000 332,000
Reno, NV 5,462,000 0 0 0 20.9 20.7 6,000 (3,000)
Sacramento, CA 72,045,000 134,000 321,000 215,000 18.6 18.8 (24,000) (204,000)
San Diego County, CA 67,513,000 0 290,000 0 17.9 17.1 381,000 778,000
San Francisco Peninsula, CA 33,518,000 0 25,000 0 18.4 17.7 231,000 304,000
San Jose/Silicon Valley, CA 53,499,000 0 343,000 917,000 19.1 20.4 (953,000) (651,000)
Seattle/Puget Sound, WA 19,687,000 0 232,000 199,000 15.3 15.2 35,000 (52,000)
St. Louis, MO 97,094,000 489,000 555,000 568,000 10.8 10.7 556,000 717,000
Tampa, FL 71,668,000 0 0 0 16.1 15.3 310,000 (266,000)
Washington, DC 313,619,000 389,000 2,008,000 218,000 14.2 14.0 677,000 1,453,000
West Palm Beach/Palm Beach Co., FL 28,834,000 32,000 83,000 272,000 21.6 21.6 1,000 36,000
Westchester County, NY 37,952,000 0 0 0 10.4 11.0 (192,000) 140,000
U.S. TOTAL/AVERAGE 3,529,214,000 3,804,000 13,911,000 10,463,000 16.90 16.91 2,650,000 2,186,000
5. highlights | Q3 2010 | office | north America
Colliers International | p. 5
united states | SUBURBAN office | class a
MARKET
EXISTING
INVENTORY (SF)
SEP. 30, 2010
VACANCY
RATE (%)
june 30,
2010
VACANCY
RATE (%)
SEP. 30,
2010
ABSORPTION
Q3 2010
(SF)
ABSORPTION
YTD 2010
(SF)
AVERAGE ANNUAL
QUOTED RENT
(USd PSF)
SEP. 30, 2010
QUARTERLY
CHANGE
IN RENT
(%)
ANNUAL
CHANGE
IN RENT
(%)
Atlanta, GA 81,026,000 19.0 18.7 233,000 256,000 21.60 -0.8 -2.3
Bakersfield, CA 2,691,000 5.7 6.9 (34,000) 31,000 24.00 0.0 0.0
Baltimore, MD 32,226,000 18.6 17.2 99,000 540,000 26.00 -1.0 -1.2
Boise, ID 4,564,000 22.6 22.4 (22,000) (23,000) 18.00 0.0 -1.4
Boston, MA 44,256,000 19.0 17.5 821,000 1,460,000 26.20 -0.8 -3.6
Charleston, SC 4,333,000 15.8 14.3 62,000 496,000 23.50 -2.9 -7.9
Charlotte, NC 18,037,000 18.9 17.9 150,000 275,000 20.40 0.0 4.4
Chicago, IL 57,646,000 25.1 25.6 (301,000) (327,000) 27.50 0.0 -0.8
Cincinnati, OH 13,398,000 24.4 24.8 (53,000) (253,000) 20.40 -0.3 -3.5
Cleveland 12,691,000 12.2 12.3 (68,000) (119,000) 21.70 -1.2 0.8
Columbia, SC 996,000 20.9 20.9 0 17,000 17.00 0.0 -5.5
Columbus, OH 11,565,000 11.8 12.9 137,000 298,000 18.20 -2.8 -5.8
Dallas/Fort Worth, TX 96,039,000 19.3 18.5 736,000 266,000 24.80 0.0 -2.0
Denver, CO 41,780,000 19.9 19.4 391,000 109,000 20.80 0.0 -1.2
Detroit, MI 25,789,000 17.5 18.0 (152,000) (153,000) 22.10 -1.2 -4.0
Fairfield, CA 2,091,000 31.3 31.1 5,000 (24,000) 26.00 -4.0 -0.1
Fairfield County, CT 16,981,000 10.5 10.6 (5,000) (8,000) 34.40 11.2 -
Fresno, CA 3,810,000 24.2 21.9 89,000 159,000 25.20 0.0 -2.3
Ft. Lauderdale/Broward Co., FL 10,380,000 20.2 20.0 23,000 27,000 28.10 -0.2 0.3
Greenville, SC 1,772,000 21.7 20.7 (51,000) (57,000) 17.60 -1.1 -5.7
Hartford, CT 7,466,000 16.9 15.8 83,000 (23,000) 20.40 0.0 -2.4
Houston, TX 68,523,000 19.6 19.3 222,000 72,000 27.30 -0.2 0.0
Jacksonville, FL 9,740,000 14.2 13.7 56,000 203,000 17.80 -12.7 -11.1
Kansas City, KS 15,459,000 18.0 15.9 22,000 17,000 21.40 -0.3 1.9
Las Vegas, NV 4,921,000 36.6 36.3 (57,000) (58,000) 32.80 -0.1 -5.4
Little Rock, AR 2,689,000 16.1 12.2 98,000 (98,000) 18.50 0.0 1.5
Los Angeles – Inland Empire, CA 4,953,000 33.5 34.1 (29,000) 113,000 25.20 -3.2 -8.7
Los Angeles, CA 100,895,000 18.9 18.4 (566,000) (1,856,000) 34.30 -1.7 -3.1
Louisville, KY 7,247,000 21.6 18.7 152,000 109,000 20.20 0.9 14.6
Memphis, TN 7,132,000 8.7 9.4 (55,000) 33,000 21.60 1.6 -0.4
Miami-Dade County, FL 15,468,000 22.1 21.7 205,000 342,000 32.50 -1.1 -1.2
Nashville, TN 12,804,000 9.2 8.9 179,000 511,000 20.00 -10.4 -8.5
New Jersey – Central 46,649,000 24.5 24.4 46,000 (715,000) 23.60 -1.3 -9.5
New Jersey – Northern 63,112,000 17.8 18.2 (237,000) (312,000) 24.30 -0.3 -13.6
Oakland, CA 3,582,000 18.1 20.7 (45,000) (160,000) 24.50 -13.9 -4.2
Orange County, CA 33,319,000 24.8 24.0 259,000 (385,000) 26.60 -2.6 -13.3
Orlando, FL 16,653,000 20.0 20.6 (76,000) (351,000) 22.80 0.0 -1.5
Philadelphia, PA 67,837,000 15.7 16.3 44,000 142,000 24.30 0.0 -1.2
Phoenix, AZ 31,366,000 27.4 26.7 225,000 331,000 24.40 -0.9 -7.1
Pleasanton/Walnut Creek, CA 16,264,000 14.2 14.9 (115,000) 10,000 22.60 -10.5 -7.8
Portland, OR 12,622,000 12.3 12.2 (102,000) (236,000) 23.20 0.0 18.8
Raleigh/Durham/Chapel Hill, NC 25,584,000 18.2 17.3 276,000 389,000 21.50 0.2 -2.3
Reno, NV 2,935,000 19.8 19.8 (2,000) 60,000 19.70 -1.8 -8.9
Sacramento, CA 16,200,000 25.6 25.6 60,000 (42,000) 24.20 -1.9 -4.7
San Diego County, CA 24,240,000 20.9 19.1 406,000 861,000 31.90 -2.2 -9.2
San Francisco Peninsula, CA 21,785,000 17.9 16.8 245,000 350,000 31.20 -2.3 -10.3
San Jose/Silicon Valley, CA 25,657,000 21.9 24.0 (679,000) 60,000 35.60 -0.7 -3.6
Seattle/Puget Sound, WA 6,288,000 22.8 21.6 80,000 (110,000) 23.10 -13.0 -15.7
St. Louis, MO 25,192,000 11.5 10.7 402,000 252,000 23.30 -0.3 -6.8
Tampa, FL 23,423,000 17.9 17.3 143,000 (6,000) 23.60 -1.0 -4.6
Washington, DC 161,792,000 16.2 16.0 464,000 1,372,000 30.90 0.4 2.5
West Palm Beach/Palm Beach Co., FL 9,175,000 3.1 20.5 21,000 78,000 30.40 -0.9 -2.3
Westchester County, NY 18,332,000 13.1 14.5 (157,000) 162,000 27.80 1.2 -
U.S. TOTAL/AVERAGE 1,391,374,000 18.77 18.60 3,626,000 4,089,000 26.20 -0.08 -2.78
24.40 -1.57 -2.68
weighted
equal
7. highlights | Q3 2010 | office | north America
Colliers International | p. 7
first drop (albeit very small) in vacancy after eleven consecu-
tive quarterly increases. Office vacancies finished the quarter
at 16.28 percent and possibly marked the beginning of a long
gradual decline in vacancy. During the third quarter the
Downtown vacancy rate decreased 8 basis points to register
14.86 percent while suburban vacancies held steady at 16.91
percent. One change of note was during the quarter down-
town Class A vacancies moved significantly lower, dropping
32 basis points to register 15.87 percent. Canadian office va-
cancy rates were mixed with central business district (CBD)
vacancies rising 4 basis points to 7.16 percent while suburban
vacancies decreased 8 basis points to 9.02 percent.
Office occupancies up for the second consecutive quarter.
Possibly heralding the beginning of the next up cycle, U.S. of-
fice markets collectively posted another quarter of positive
absorption. This second quarter of positive absorption came
after nine consecutive quarters of negative absorption begin-
ning first quarter 2008. Third quarter absorption came in at
6.6 MSF (million square feet) which was a substantial in-
crease from the second quarter when occupied space in-
creased by 1.8 MSF. Third quarter absorption was also a sig-
nificant improvement from the year ago period when 17.7 MSF
was returned to the market. Examining third quarter absorp-
tion in detail shows 92% of newly occupied space was in
Class A buildings reflecting a move by tenants to upgrade their
premises often with little additional cost. Canadian markets
also recorded an increase in occupied space during the third
quarter with absorption totaling 2.7 MSF.
Rent picture increasingly mixed. Third quarter rent data
shows CBD rents increased a further 1.4 percent to average
$39.06 per square foot while suburban rents largely held
steady dropping by just two cents a square foot to $26.22.
Looking beyond the headline numbers, however, shows most
office markets are still characterized by declining rents. The
reason for this apparent contradiction is rental averages are
inventory-weighted and so a few large markets can skew the
national averages. Without this “weighting” effect, third quar-
ter CBD rents fell 0.4 percent and suburban rents dropped by
1.6%. Canadian downtown office rents moved lower during
the quarter with CBD quoted rents decreasing 2.7% while
suburban rents increased 1.2%.
Office construction pipeline continues to empty out. Third
quarter office completions totaled just 5.4 MSF, a significant
drop from the second quarter when construction totaled 11.1
MSF, and the lowest on record. Going forward office develop-
ment will remain extremely subdued with construction activity
falling to just 20.6 MSF at quarter end, compared with 29.2
MSF at the end of the second quarter and well below the 120
MSF underway at midyear 2008. Construction is expected to
drift lower and with the exception of just a small number of
build-to-suits and a few select speculative developments, of-
fice development will be absent from the U.S. office landscape
by as soon as mid-2011.
Office Markets Show First Signs of
Beginning a Long Slow Road to Recovery
Continued from page 1
UNITED STATES | OFFICE INVESTMENT
MARKET
CBD
SALES PRICE
(USD PSF)
CBD
CAP RATE
(%)
SUBURBAN
SALES PRICE
(USD PSF)
SUBURBAN
CAP RATE
(%)
Atlanta, GA 80.00 8.73 100.00 9.40
Bakersfield, CA 128.00 9.26 111.00 –
Charleston, SC 250.00 8.00 135.00 11.00
Chicago, IL 220.00 7.25 120.00 8.00
Columbus, OH – – 118.00 –
Dallas/Fort Worth, TX – – 75.00 8.75
Denver, CO 195.00 8.00 153.00 8.50
Fairfield County, CT – – 250.00 8.00
Fresno, CA 160.00 9.00 170.00 8.50
Ft. Lauderdale/Broward County, FL 183.05 6.65 80.00 –
Hartford, CT 11.00 – 136.00 8.60
Honolulu, HI 251.00 7.00 – –
Houston, TX 150.00 8.80 122.00 8.80
Jacksonville, FL 110.00 9.25 120.00 8.75
Las Vegas, NV – – 49.00 –
Little Rock, AR 88.00 9 110.00 9.00
Los Angeles – Inland Empire, CA – – 71.00 –
Los Angeles, CA 332.00 6.00 275.00 8.00
Miami-Dade Country, FL – – 319.00 –
New York, NY – Downtown Manhattan 350.00 6.00 – –
New York, NY – Midtown Manhattan 422.00 5.00 – –
New York, NY – Midtown S. Manhattan 400.00 6.00 – –
Oakland, CA – 8.00 – 9.00
Orange County, CA – – 162.00 8.10
Orlando, FL 183.59 – 171.28 9.20
Philadelphia, PA 122.00 9.00 112.00 9.00
Phoenix, AZ – – 105.00 –
Pleasanton/Walnut Creek, CA 112.50 8.00 87.50 8.50
Portland, OR 162.58 – 159.56 7.16
Sacramento, CA 220.00 8.50 150.00 8.70
San Diego County, CA 124.50 – 181.66 8.45
San Francisco Peninsula, CA – – 250.00 6.50
San Francisco, CA 314.00 6.25 – –
Stamford, CT 350.00 8.00 – –
Stockton/San Joaquin County, CA 134.00 8.80 – –
Tampa, FL – – 108.32 10.50
Washington, DC 724.22 5.80 – –
West Palm Beach/Palm Beach Co., FL 97.44 10.50 105.39 11.00
Westchester County, NY – – 250.00 8.00
canada | OFFICE INVESTMENT
MARKET
CBD
SALES PRICE
(cAD PSF)
CBD
CAP RATE
(%)
SUBURBAN
SALES PRICE
(cAD PSF)
SUBURBAN
CAP RATE
(%)
Calgary, AB 340.00 6.50 335.00 7.25
Kitchener-Waterloo, ON 160.00 8.00 110.00 7.75
Montreal, QC 275.00 7.00 190.00 7.75
Ottawa, ON 270.00 7.25 145.00 7.60
Regina, SK 213.00 7.45 – –
Saskatoon, SK 175.00 7.75 - -
Toronto, ON 167.00 – 151.00 9.30
Vancouver, BC 450.00 5.70 330.00 6.50