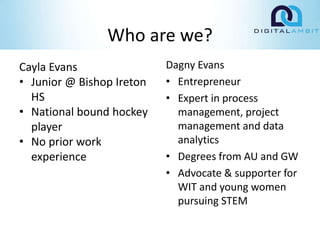
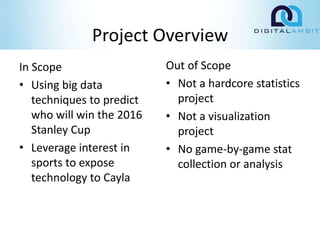
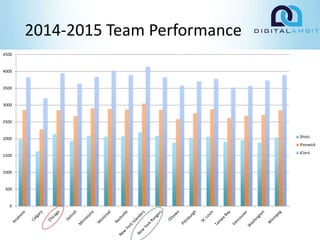
Who will win the 2016 Stanley
Cup?
Dagny & Cayla Evans
Contact Info
Dagny Evans
Digital Ambit
dagny@digitalambit.com
dagny@dagnyevans.com
@dagnyevans
@digitalambit
https://github.com/dagnyevans/stanleycup
Agenda
• Introductions
• Project Overview
• Methodology
• Hockey Stats Complexity
• Results
• Lessons Learned
Who are we?
Cayla Evans
• Junior @ Bishop Ireton
HS
• National bound hockey
player
• No prior work
experience
Dagny Evans
• Entrepreneur
• Expert in process
management, project
management and data
analytics
• Degrees from AU and GW
• Advocate & supporter for
WIT and young women
pursuing STEM
Project Overview
In Scope
• Using big data
techniques to predict
who will win the 2016
Stanley Cup
• Leverage interest in
sports to expose
technology to Cayla
Out of Scope
• Not a hardcore statistics
project
• Not a visualization
project
• No game-by-game stat
collection or analysis
Tools & Sources
• R & R Studio
• Various websites
– Helpful website lynda.com
– nhl.com
– stats.hockeyanalysis.com
– the teams’ personal website
• Excel/comma separated value text files
• Book: Practical Data Science in R (Nina Zumel & John
Mount)
• Github – presentation, data files & R scripts
posted (https://github.com/dagnyevans/stanleycup)
Methodology
1. Find & download the data
2. Combine disparate data sources
3. Cleanse data (spelling, cases)
4. Use Excel & R to analyze data
1. Looking for data quality & correlations in stats to
winners
5. Calculate mean of historical player stats as
2015-2016 stats
6. Aggregate player stats to team stats*
7. Train & test models against data sets
Project Details
• Data & R script walk-through
• Data Overview
– History records: 4,352
– Seasons: 5
– Teams: 30
– Players: 1,421
Complexity in Hockey Stats
• History of Hockey Stats/Inherent complexity
– Shots on goal is primary stat used in hockey
– Governing bodies still trying to figure out player
stats
• Other factors
– Best team does not always win
– Humans have bad days
– Performance of team is sum of player
performance
2014-2015 Team Performance
0
500
1000
1500
2000
2500
3000
3500
4000
4500
Shots
iFenwick
iCorsi
How’d we do?
• Learned fundamentals of data analysis
• Learned R syntax for: loads, functions, merges,
modeling, & analysis
• Cleansed and merged data to get to clean data
set for modeling
• Used history to predict 2015-2016 player stats
• Ran models and correlations to forecast
winner
On any given day, any team can win
Passing the torch
• Expand data set to include playoff participants
and game by game player stats
• Try alternate models
• Share your work!
Reminder: data sets, script and powerpoint all
avaialable at: https://github.com/dagnyevans/stanleycup
Cayla’s Lessons Learned
• Remember to save the work you do so that
you do not have to repeat yourself
• Computers are stupid and will do exactly
what you tell them to
• The data you start out with is not always the
data you need
• Trial and error
• Map your project
• Take notes – process, progress and results
Dagny’s Lessons Learned
• Don’t assume your intern knows everything you
do
• Act -> Review -> Proceed -> Repeat
• Just because you have the tools, doesn’t mean
you can answer the question
• Clear, concise written reference & how-to
instruction for r (or data science) are hard to find
• If you use an interesting subject to introduce tech
ideas, you can engage (and teach) young people
about tech

CodeHer Presentation

  • 1.
    Who will winthe 2016 Stanley Cup? Dagny & Cayla Evans
  • 2.
    Contact Info Dagny Evans DigitalAmbit dagny@digitalambit.com dagny@dagnyevans.com @dagnyevans @digitalambit https://github.com/dagnyevans/stanleycup
  • 3.
    Agenda • Introductions • ProjectOverview • Methodology • Hockey Stats Complexity • Results • Lessons Learned
  • 4.
    Who are we? CaylaEvans • Junior @ Bishop Ireton HS • National bound hockey player • No prior work experience Dagny Evans • Entrepreneur • Expert in process management, project management and data analytics • Degrees from AU and GW • Advocate & supporter for WIT and young women pursuing STEM
  • 5.
    Project Overview In Scope •Using big data techniques to predict who will win the 2016 Stanley Cup • Leverage interest in sports to expose technology to Cayla Out of Scope • Not a hardcore statistics project • Not a visualization project • No game-by-game stat collection or analysis
  • 6.
    Tools & Sources •R & R Studio • Various websites – Helpful website lynda.com – nhl.com – stats.hockeyanalysis.com – the teams’ personal website • Excel/comma separated value text files • Book: Practical Data Science in R (Nina Zumel & John Mount) • Github – presentation, data files & R scripts posted (https://github.com/dagnyevans/stanleycup)
  • 7.
    Methodology 1. Find &download the data 2. Combine disparate data sources 3. Cleanse data (spelling, cases) 4. Use Excel & R to analyze data 1. Looking for data quality & correlations in stats to winners 5. Calculate mean of historical player stats as 2015-2016 stats 6. Aggregate player stats to team stats* 7. Train & test models against data sets
  • 8.
    Project Details • Data& R script walk-through • Data Overview – History records: 4,352 – Seasons: 5 – Teams: 30 – Players: 1,421
  • 9.
    Complexity in HockeyStats • History of Hockey Stats/Inherent complexity – Shots on goal is primary stat used in hockey – Governing bodies still trying to figure out player stats • Other factors – Best team does not always win – Humans have bad days – Performance of team is sum of player performance
  • 10.
  • 11.
    How’d we do? •Learned fundamentals of data analysis • Learned R syntax for: loads, functions, merges, modeling, & analysis • Cleansed and merged data to get to clean data set for modeling • Used history to predict 2015-2016 player stats • Ran models and correlations to forecast winner On any given day, any team can win
  • 12.
    Passing the torch •Expand data set to include playoff participants and game by game player stats • Try alternate models • Share your work! Reminder: data sets, script and powerpoint all avaialable at: https://github.com/dagnyevans/stanleycup
  • 13.
    Cayla’s Lessons Learned •Remember to save the work you do so that you do not have to repeat yourself • Computers are stupid and will do exactly what you tell them to • The data you start out with is not always the data you need • Trial and error • Map your project • Take notes – process, progress and results
  • 14.
    Dagny’s Lessons Learned •Don’t assume your intern knows everything you do • Act -> Review -> Proceed -> Repeat • Just because you have the tools, doesn’t mean you can answer the question • Clear, concise written reference & how-to instruction for r (or data science) are hard to find • If you use an interesting subject to introduce tech ideas, you can engage (and teach) young people about tech

Editor's Notes

  • #5 Cayla I am Cayla Evans. I am a junior at Bishop Ireton HS and am a national bound hockey player. I do not know what I want to do yet. I am planning to use the next two years to do that. This project was a way for me to see if tech is something I want to do. Dagny Joined husband in March to run our software & data integration consulting company Prior to that worked in across dotcom, telecom, data analytics industries –worked at several small growing DC business on cutting edges of industry Big believer there are many paths to tech
  • #6 Cayla We decided to do this particular project because I am starting to think about what I want to study in College. Data Science seems cool. This project allows me to learn about Data Science using a topic I’m interested in. The real goal is to see if Data Science is something I want to do when I get out of college. Dagny Inspiration comes from many sources – this project is product of letting my mind wander I really wanted a project that would expose Cayla to technical opportunities, not just softer business skills (although we worked on those too) Husband too busy, so I leverage something I was good at
  • #7 Cayla Used many different sources. My mother bought me a couple of books for understand concepts and even made me write book reportscon them. Also used various websites when I couldn’t figure out to do something and to find my data For majority of project used R.
  • #8 Cayla I located the player and team stats of the ‘10-’11 through ‘14-’15 seasons. I took those stats & loaded them all into R so that I could correlate any of the stats with each other. Just a few days after the analysis, I realized that the stats I had loaded were not up to date. I was able to find and load new player/team stats. Right after the data was loaded and proved to be right I mapped out the plan for the rest of the project. Cleansing the data isn’t finished one time through I merged the player and goalie stats into the Rosters of all 30 teams in the NHL. Using the rosters I then calculated the averages for the player stats and the one goalie stat that would be needed to make the team stats. Once I calculated the averages I filled in the ‘blank’ 2015-2016 stats. I then aggregated or added the player and goalie statistics to make the team stats. Dagny My role – advisor, researcher, quality control, cardboard batman *applied model & correlation to both data sets
  • #9 Cayla Important stats – shots, icorsi, ifenwick, Sv% Different approaches to get to the same results
  • #10 (last 50 years) Shot on goal a flawed statistic because “on goal” – if it hits the goalie, it’s considered on goal. But if it hits the pipe, it’s not a shot. Goalie stat only not a player stat. still trying to figure out Take an example: Alex Ovechkin shoots – 1) goes in -> goal and shot; 2) 5 ft wide, but goalie grabs it -> shot; 3) 5 ft wide, but goalie doesn’t touch it -> no shot; 4) Hits the post, misses the net -> no shot Fenwick is shots plus all shot attempts that missed the net (i.e. hit the post/crossbar, shot wide, etc.) Corsi is Fenwick plus all shots attempts that were blocked by the defending team I have played hockey for the past 8 years. The best team does not always win. We are human. Humans have bad days. Since one player is not responsible for the win of a game the performance of the team is critical. Bad days for the players could mean a bad day for the team.
  • #11 Example of 3 core player stats at team level. No clear outliers President’s cup winner (best team at end of regular season) did not win stanley cup Neither cup winners had significantly higher stats
  • #12 The root is always the question I’m trying to answer – business question Mapped project from data collection to answering the business question Data collection; cleansing; analysis; results
  • #15 One practical one: R is a bit finicky. It’s caching the work until you save it, so if you didn’t save enough or “reset the cache”, syntax that worked previously would return funky results