Download to read offline


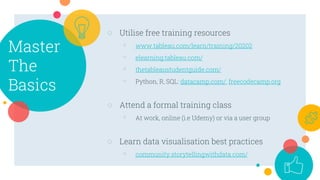

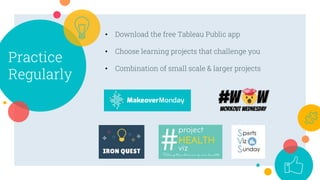


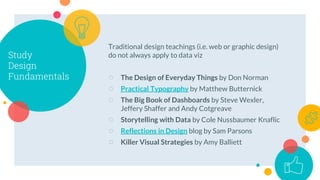

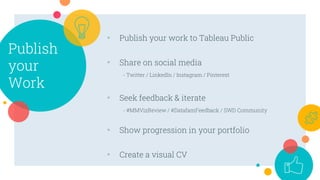

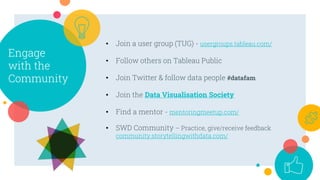


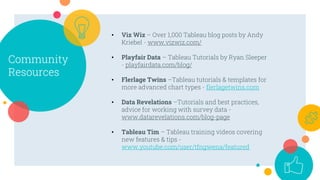

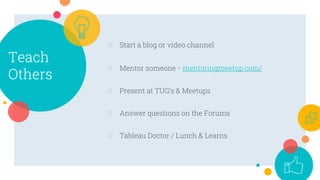

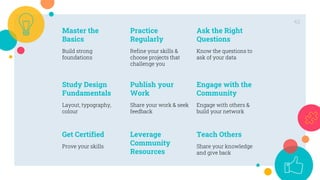


This document provides tips for becoming a better analyst using Tableau. It recommends mastering the basics through free training resources. Regular practice with downloadable Tableau Public is important, using projects of varying sizes. Asking the right questions of data ensures understanding its limitations. Study design fundamentals from books on visualization best practices. Publish work on Tableau Public and social media to get feedback. Engage with the Tableau user community through events and online. Get certified to prove skills and boost careers. Leverage additional community resources like blogs and videos. Teaching others is another way to share knowledge and give back to the community.


![5G Explained! A High Level Overview [Introduction]](https://cdn.slidesharecdn.com/ss_thumbnails/5gexplainedahighleveloverview-260119165306-cc137a3e-thumbnail.jpg?width=640&height=640&fit=bounds)