The document provides a reconciliation of the company's GAAP and non-GAAP financial measures for the quarters ending March 30, 2007 and March 31, 2006. It summarizes that management believes the non-GAAP measures provide a more meaningful comparison by excluding certain items that impact comparability between periods. The tables show reconciliations of key financial figures between GAAP and non-GAAP reporting, including revenues, expenses, profits, and margins. It also provides segment-level comparisons of operating income growth between the two periods under GAAP and non-GAAP measures.
coca cola Reconciliation of Q3 and YTD 2007 Non-GAAP Financial Measuresfinance9
The document provides a reconciliation of the company's GAAP financial measures to non-GAAP financial measures for the third quarter and first nine months of 2007 and 2006. Some key points:
- Management believes the non-GAAP measures provide a meaningful comparison of underlying business trends by excluding certain items that impact comparability.
- For Q3 2007, items impacting comparability include asset impairments/restructuring charges and gains/losses, resulting in operating income 12% higher than reported on a non-GAAP basis.
- For the first nine months of 2007, items include similar adjustment items, resulting in operating income 13% higher than reported on a non-GAAP basis.
- By
coca cola Reconciliation of Q2 and YTD 2008 Non-GAAP Financial Measuresfinance9
This document provides both GAAP and non-GAAP financial measures for The Coca-Cola Company for the three months ended June 27, 2008 and June 29, 2007. Management believes non-GAAP measures allow for additional meaningful comparisons between periods by excluding certain items that impact comparability. The tables show reconciliations between reported GAAP measures and non-GAAP measures which exclude items like asset impairments and equity investee gains or losses. Management uses non-GAAP measures to make financial, operating and planning decisions.
coca cola Reconciliation of Q2 and YTD 2007 Non-GAAP Financial Measuresfinance9
The document provides non-GAAP financial measures for The Coca-Cola Company in addition to its GAAP reported financial results. Management believes the non-GAAP measures allow for more meaningful comparisons of current results to historical periods by excluding certain items that impact overall comparability. The non-GAAP measures are used by management in making financial, operating, and planning decisions to evaluate performance. Tables reconcile the non-GAAP measures to GAAP measures and provide supplemental financial data for quarterly and year-to-date periods, including operating income by segment.
coca cola Reconciliation of Q3 and YTD 2008 Non-GAAP financial measuresfinance9
The document provides a reconciliation of the company's GAAP and non-GAAP financial measures for the third quarters of 2008 and 2007. It shows items such as restructuring charges, productivity initiatives, and certain tax matters that are excluded from non-GAAP measures. Management believes the non-GAAP measures provide a meaningful comparison of underlying business trends by excluding items that impact comparability between periods. The reconciliation tables present the impact of excluded items on key financial metrics such as operating income, net income, and earnings per share.
coca cola Reconciliation of Q1 2008 Non-GAAP Financial Measuresfinance9
Management provides the following 3-sentence summary:
1) While the Company reports financial results according to GAAP, management also uses non-GAAP measures to provide additional meaningful comparisons between periods by excluding certain items that impact comparability.
2) Management believes these non-GAAP measures better reflect underlying business trends and also uses them to make financial, operating, and planning decisions.
3) The document provides reconciliations between GAAP and non-GAAP measures for revenues, expenses, profits, and segment results for the first quarters of 2008 and 2007.
coca cola Reconciliation of Q3 and YTD 2006 Non-GAAP Financial Measuresfinance9
The document compares the company's financial results reported according to GAAP with non-GAAP measures used by management to evaluate performance. Management believes the non-GAAP measures provide a more meaningful comparison by excluding certain items that impact comparability between periods. The tables provide reconciliations between GAAP and non-GAAP results for key metrics such as operating income and diluted earnings per share for the most recent quarter.
coca cola Reconciliation of Q1 2006 Non-GAAP Financial Measuresfinance9
The document discusses a company's use of both GAAP and non-GAAP financial measures to evaluate performance. Management believes non-GAAP measures provide additional context by excluding certain items that impact comparability between periods. A table is presented reconciling the company's GAAP and non-GAAP results for the first quarter of 2006 and 2005, with non-GAAP measures excluding certain one-time charges and gains.
coca cola Reconciliation of Non-GAAP Financial Measures for 2008 Beverage D...finance9
The document discusses the company's reporting of financial results according to GAAP and also using non-GAAP measures. Management believes the non-GAAP measures provide additional meaningful comparisons by excluding certain items that impact comparability between periods. The tables provide reconciliations between GAAP and non-GAAP results for years 2004-2005 and quarters 1-2 of 2006, excluding items like restructuring charges, tax matters, and equity investments to show underlying trends. Non-GAAP measures should be viewed in addition to GAAP measures.
coca cola Reconciliation of Non-GAAP Financial Measures for 2008 Lehman Broth...finance9
The document discusses the company's reporting of financial results according to GAAP and the use of non-GAAP measures by management to provide additional meaningful comparisons. It provides reconciliations of GAAP measures to non-GAAP measures for years 2004-2005 and quarters 1-2 of 2006 that exclude certain items impacting comparability in order to reflect underlying business trends. Management uses these non-GAAP measures for financial decision making and performance evaluation.
This document provides reconciliations between Duke Energy Corporation's ("Duke Energy") non-GAAP financial measures and the most directly comparable GAAP measures for various periods. It discusses Duke Energy's use of "ongoing" measures which exclude special items that management believes are not recurring, such as gains, losses and impairment charges. The document also references Duke Energy's expectation to achieve ongoing EPS targets and segment earnings growth rates through 2012.
coca cola Reconciliation of Q4 and Full Year 2005 Non-GAAP Financial Measuresfinance9
The document discusses reconciliations between the Company's GAAP financial measures and non-GAAP financial measures for various periods. Management believes the non-GAAP measures provide additional insight into underlying business trends by excluding certain items that impact comparability between periods. The document includes tables reconciling revenue, expenses, operating income, net income, EPS and other items between GAAP and non-GAAP for quarters ending December 2005 and 2004 and years ending 2005 and 2004. It provides supplemental financial data and explanations of items adjusted for comparability.
tech data Fiscal 2009 First-Quarter Resultsfinance11
This document provides a reconciliation of GAAP operating income, net income, and net income per diluted share to non-GAAP amounts for the company for the three months ended April 30, 2008 and April 30, 2007. It shows that non-GAAP operating income and net income were higher than GAAP amounts for both periods due to the exclusion of losses from the disposal of subsidiaries and restructuring charges. Non-GAAP net income per diluted share was also higher after excluding these items and their related tax effects.
The document discusses Duke Energy Corporation's use of non-GAAP financial measures in its First Quarter 2007 Earnings Review presentation. Specifically, it discusses measures such as ongoing diluted EPS, ongoing segment EBIT, and expected ongoing diluted EPS growth rates which exclude special items that management believes are not recurring. It provides reconciliations of these non-GAAP measures to the most directly comparable GAAP measures for previous periods to facilitate understanding of the non-GAAP information.
Texas Eastern Transmission reported financial results for the first quarter of 2007. Revenue was $226 million, down from $248 million in the prior year. Operating expenses declined to $107 million from $118 million. Net income was $63 million compared to $85 million in 2006. Total assets were $5.048 billion as of March 31, 2007.
Duke Energy Corporation provided reconciliations of non-GAAP financial measures (ongoing earnings) to the most directly comparable GAAP measures (reported earnings) for the second quarter and first half of 2006 and 2007. Special items were excluded from ongoing earnings and included in total adjustments to reconcile to reported earnings. Management believes special items will not recur regularly.
coca cola Reconciliation of Q2 2003 Non-GAAP Financial Measuresfinance9
The Company reports GAAP financial results and non-GAAP measures to provide additional comparisons. The document provides a reconciliation of GAAP to non-GAAP measures for Q2 2003 and Q2 2002, showing adjustments for streamlining initiatives that impact operating income, income before taxes, net income, and earnings per share. Non-GAAP measures exclude certain items to provide a more meaningful comparison of current and historical results.
The document discusses Duke Energy's use of non-GAAP financial measures to evaluate performance, including ongoing earnings per share, ongoing segment EBIT, and other measures adjusted for special items. It provides context for these measures and notes that special items represent charges and credits that are not expected to recur regularly. It also states that reconciliations to the most directly comparable GAAP measures are not possible due to the inability to forecast future special items.
Hexion reported financial results for Q4 2008 and fiscal year 2008. Q4 revenue declined 20% year-over-year to $1.18 billion due to weak market conditions and inventory destocking by customers amid the global recession. The company reported an operating loss of $876 million for Q4, which included $800 million in costs related to the terminated Huntsman merger. For the full year, revenues increased 5% to $6.09 billion but the company reported an operating loss of $893 million. Hexion is taking aggressive actions to reduce costs and enhance liquidity to address challenges in this difficult market environment.
tech data Q4 and Fiscal Year 2006 Restated for Discontinued Operationsfinance11
The document provides a reconciliation of GAAP operating income and net income to non-GAAP operating income and net income for a company. For both the quarter and year, restructuring charges and other consulting costs were excluded from non-GAAP figures. Tax effects related to these exclusions were also adjusted in non-GAAP net income. Per share amounts were provided on both a GAAP and non-GAAP basis.
tech data Fiscal 2009 Second-Quarter Resultsfinance11
This document provides a reconciliation of GAAP (Generally Accepted Accounting Principles) to non-GAAP operating income, net income, and net income per diluted share for a company for the three and six month periods ending July 31, 2008 and 2007. It excludes certain one-time items from GAAP numbers like losses from disposing of subsidiaries and restructuring charges to derive non-GAAP numbers that provide a better view of ongoing business performance. Notes explain the nature of the excluded items.
United Health GroupReconciliation of Non-GAAP Financial Measuresfinance3
This document from UnitedHealth Group provides reconciliations of non-GAAP financial measures for the quarter ended September 30, 2007. It includes:
1) Operating results excluding charges related to IRS Section 409A, showing earnings from operations of $5.987 billion versus GAAP of $5.811 billion.
2) Adjusted cash flows from operating activities of $2.085 billion versus GAAP of $516 million to account for timing of CMS premium payments.
3) Consolidated reporting excluding their AARP business to show financial measures without the impact of AARP's rate stabilization fund.
4) Forecasted 2007 diluted net earnings per share of $3.49-$3.50 excluding IRS
coca cola Reconciliation of Q3 & YTD 2004 Non-GAAP Financial Measuresfinance9
The Company reports its quarterly financial results according to GAAP, but management also believes that certain non-GAAP measures can provide useful supplemental information for comparing current results to prior periods. The document includes tables reconciling GAAP measures such as net income, earnings per share, and operating margins to non-GAAP measures for Q3 2004 and 2003 as well as year-to-date 2004 and 2003, adjusting for certain items affecting comparability between periods such as asset write-downs and gains or losses on business transactions. Non-GAAP measures should be viewed in addition to GAAP measures and not as alternatives to them.
bank of new york mellon corp 4q 08 earningsfinance18
The Bank of New York Mellon Corporation reported its financial results for the fourth quarter of 2008 with various highlights and metrics compared to the same quarter in 2007. Some key highlights include a 42% increase in net interest revenue, a $0.65 per share non-cash securities write-down, and continued progress exceeding merger-related expense and revenue synergy targets. Metrics such as return on tangible common equity and pre-tax operating margin both increased on a non-GAAP adjusted basis compared to fourth quarter of 2007.
coca cola Reconciliation of Q1 2003 Non-GAAP Financial Measuresfinance9
The document provides supplemental non-GAAP financial data and reconciliations to GAAP measures for the Company for the first quarters of 2003 and 2002. Some key highlights include:
- Net operating revenues increased 10% from $4.08 billion in Q1 2002 to $4.50 billion in Q1 2003.
- Gross profit increased 6% after considering certain items like streamlining charges. Operating income increased 2% after similar adjustments.
- Net income before accounting changes increased 7% after adding back items such as streamlining charges and a gain from a vitamin settlement.
- Diluted earnings per share grew 9% to $0.37 after considering these additional factors.
The document discusses several non-GAAP financial measures used by Duke Energy to measure performance, including:
1) Ongoing diluted EPS, which adjusts reported diluted EPS from continuing operations for special items to measure performance against employee incentive targets.
2) Anticipated ongoing EPS growth percentages, which adjust diluted EPS from continuing operations for special items to forecast future EPS growth.
3) Ongoing segment EBIT, which adjusts reported segment EBIT for special items to forecast performance at the business segment level.
Reconciliations of these non-GAAP measures to the most directly comparable GAAP measures are not provided due to the inability to forecast special items.
coca cola Apr 21, 2004 Reconciliation of Q1 2004 Non-GAAP Financial Measuresfinance9
The Company provides supplemental non-GAAP financial measures to provide additional insight into its operating performance. For the quarter ended March 31, 2004, non-GAAP net income was $1.127 billion, or $0.46 per diluted share, compared to $904 million, or $0.37 per diluted share for the same period in 2003. Non-GAAP measures exclude certain charges and gains to provide a more meaningful comparison between periods. Management believes non-GAAP measures are useful in managing the business and understanding current results versus prior periods.
public serviceenterprise group library.corporatefinance20
PSEG held an earnings conference call to discuss its fourth quarter and full-year 2008 results. For the fourth quarter, PSEG reported operating earnings of $250 million compared to $272 million in the prior year quarter. For the full year, operating earnings were $1,487 million compared to $1,385 million in 2007. PSEG Power's fourth quarter operating earnings were $207 million, matching the prior year, while PSE&G's were $76 million, down slightly from $77 million in 2007. PSEG provided 2009 operating earnings guidance of $3.00-$3.25 per share.
Duane is the distance-learning coordinator for English at UPAEP. He grew up in London, England but has lived in many other countries including England, Mexico, Japan. One of his favorite places to live was Japan where he met kind people and enjoyed climbing Mount Fuji. His greatest love is his son Nathan Alexander.
Bear Stearns 21st Annual Media Conference finance8
The document is a transcript of a presentation by Mike Angelakis, CFO of Comcast, at a Bear Stearns media conference on March 10, 2008. In the presentation, Angelakis discusses increased competition in the communications services industry from telephone companies entering the video market. He notes Comcast is holding its own against competitors like Verizon but expects to lose some basic cable customers. However, Comcast offsets these losses through growth in other areas like broadband. Angelakis also addresses improving Comcast's video offerings to compete with satellite providers like DirecTV that have expanded high-definition options.
coca cola Reconciliation of Q1 2005 Non-GAAP Financial Measures finance9
The document discusses reconciling non-GAAP financial measures to GAAP measures for a company. It provides supplemental financial data for the company for the first quarter of 2005 and 2004, including items impacting comparability between periods. Management believes the non-GAAP measures provide additional meaningful comparisons by excluding items that do not represent the company's fundamental operations.
This document is Comcast Corporation's annual report on Form 10-K for the 2005 fiscal year filed with the Securities and Exchange Commission (SEC). It summarizes Comcast's businesses and operations, provides audited financial statements, and includes other required disclosures. Comcast is the largest cable provider in the US, offering video, internet, and phone services to over 21 million video subscribers, 8 million internet subscribers, and 1 million phone customers. The report provides details on Comcast's legal proceedings, executive officers, common stock information, and incorporates other documents by reference.
The document provides a reconciliation of Aramark's non-GAAP financial measures for its fourth quarter and full year 2003 operating results, excluding certain unusual income and expense items. Specifically, it excludes $32 million in business interruption proceeds, a $10.7 million investment write-down, $7.7 million in debt extinguishment costs, and prior year gains of $43.7 million. The reconciliation shows income from continuing operations and earnings per share on both an as reported basis and excluding these unusual items, showing an increase of 18% and 15% respectively for the quarter and year on the adjusted basis. It also provides adjusted operating income figures for the food and support services segment in the US.
The document provides a reconciliation of Aramark's non-GAAP financial measures for its fourth quarter and full year 2003 operating results, excluding certain unusual income and expense items. Specifically, it excludes $32 million in business interruption proceeds, a $10.7 million investment write-down, $7.7 million in debt extinguishment costs, and prior year gains of $43.7 million. The reconciliation shows income from continuing operations and earnings per share on both an as reported basis and excluding these unusual items, showing an increase of 18% and 15% respectively for the quarter and year on the adjusted basis. It also shows operating income for the food and support services segment on both bases, with an increase of 11%
This document provides non-GAAP reconciliations of Alltel Corporation's results of operations for various periods under GAAP and from current businesses. It excludes items like amortization of intangible assets from acquisitions, gains or losses from asset sales or disposals, integration expenses, adjustments to tax liabilities, and discontinued operations. Notes further explain the adjustments and excluded items, such as amortization, integration costs, gains or losses on sales of assets or securities, compensation from accelerated vesting of restricted stock, and the spin-off of Alltel's wireline business.
coca cola Reconciliation of YTD 2003 Non-GAAP Financial Measurefinance9
The document provides a reconciliation of GAAP to non-GAAP financial measures for The Coca-Cola Company for the six months ended June 30, 2003 and June 30, 2002. It shows the company's reported income statement figures according to GAAP as well as adjustments to consider certain non-GAAP items for additional comparisons between periods. Key figures like net operating revenues, operating income, net income, and earnings per share are presented on both a GAAP and non-GAAP basis, with non-GAAP adjusting for items like charges related to streamlining initiatives and gains on investments.
public serviceenterprise group library.corporate-irfinance20
PSEG held an earnings conference call to discuss its fourth quarter and full-year 2008 results. For Q4 2008, PSEG reported operating earnings of $250 million compared to $272 million in Q4 2007. For the full year, operating earnings were $1,487 million compared to $1,385 million in 2007. PSEG Power's Q4 operating earnings were $207 million, matching the prior year, while PSE&G's were $76 million compared to $77 million in Q4 2007. PSEG provided 2009 operating earnings guidance of $3.00-$3.25 per share.
This document provides a summary of PSEG's 4th quarter and full-year 2008 earnings conference call. It discusses PSEG meeting its 2008 earnings guidance despite challenges. Key points include PSEG focusing on operational excellence, laying a foundation for the future through carbon abatement and infrastructure programs, and strengthening its financial position by reducing debt and recognizing reserves for tax risks. The document also provides guidance for 2009 operating earnings of $3.00-$3.25 per share.
public serviceenterprise group Investor library.corporatefinance20
PSEG held an earnings conference call to discuss its fourth quarter and full-year 2008 results. For the fourth quarter, PSEG reported operating earnings of $250 million compared to $272 million in the prior year quarter. For the full year, operating earnings were $1,487 million compared to $1,385 million in 2007. PSEG Power's fourth quarter operating earnings were $207 million, matching the prior year, while PSE&G's were $76 million, down slightly from $77 million in 2007. PSEG provided 2009 operating earnings guidance of $3.00-$3.25 per share.
public serviceenterprise grouplibrary.corporate-ifinance20
This document provides a summary of PSEG's 4th quarter and full-year 2008 earnings conference call. It discusses PSEG meeting its 2008 earnings guidance despite challenges. Key points include PSEG focusing on operational excellence, laying a foundation for the future through carbon abatement and infrastructure programs, and strengthening its financial position by reducing debt and recognizing reserves for tax risks. The document also provides guidance for 2009 operating earnings of $3.00-$3.25 per share.
public serviceenterprise group library.corporate-irfinance20
PSEG held an earnings conference call to discuss its fourth quarter and full-year 2008 results. For Q4 2008, PSEG reported operating earnings of $250 million compared to $272 million in Q4 2007. For the full year, operating earnings were $1,487 million compared to $1,385 million in 2007. PSEG Power's Q4 operating earnings were $207 million, matching the prior year, while PSE&G's were $76 million compared to $77 million in Q4 2007. PSEG provided 2009 operating earnings guidance of $3.00-$3.25 per share.
public serviceenterprise group library.corporatefinance20
PSEG held an earnings conference call to discuss its fourth quarter and full-year 2008 results. For Q4 2008, PSEG reported operating earnings of $250 million compared to $272 million in Q4 2007. For the full year, operating earnings were $1,487 million compared to $1,385 million in 2007. PSEG Power's Q4 operating earnings were $207 million, matching the prior year, while PSE&G's were $76 million, down slightly from $77 million in Q4 2007. PSEG provided 2009 operating earnings guidance of $3.00-$3.25 per share.
PSEG held an earnings conference call to discuss its fourth quarter and full-year 2008 results. For the fourth quarter, PSEG reported operating earnings of $250 million compared to $272 million in the prior year quarter. For the full year, operating earnings were $1,487 million compared to $1,385 million in 2007. PSEG Power's fourth quarter operating earnings were $207 million, matching the prior year, while PSE&G's were $76 million, down slightly from $77 million in 2007. PSEG provided 2009 operating earnings guidance of $3.00-$3.25 per share.
public serviceenterprise group Investor library.corporatefinance20
PSEG held an earnings conference call to discuss its fourth quarter and full-year 2008 results. For the fourth quarter, PSEG reported operating earnings of $250 million compared to $272 million in the prior year quarter. For the full year, operating earnings were $1,487 million compared to $1,385 million in 2007. PSEG Power's fourth quarter operating earnings were $207 million, matching the prior year, while PSE&G's were $76 million, down slightly from $77 million in 2007. PSEG provided 2009 operating earnings guidance of $3.00-$3.25 per share.
public serviceenterprise grouplibrary.corporate-ifinance20
PSEG held an earnings conference call to discuss its fourth quarter and full-year 2008 results. For the fourth quarter, PSEG reported operating earnings of $250 million compared to $272 million in the prior year quarter. For the full year, operating earnings were $1,487 million compared to $1,385 million in 2007. PSEG Power's fourth quarter operating earnings were $207 million, matching the prior year, while PSE&G's were $76 million, down slightly from $77 million in 2007. PSEG provided 2009 operating earnings guidance of $3.00-$3.25 per share.
public serviceenterprise group library.corporate-irfinance20
PSEG held an earnings conference call to discuss its fourth quarter and full-year 2008 results. For the fourth quarter, PSEG reported operating earnings of $250 million compared to $272 million in the prior year quarter. For the full year, operating earnings were $1,487 million compared to $1,385 million in 2007. PSEG Power's operating earnings were relatively flat quarter-over-quarter, while PSE&G's operating earnings declined slightly due to higher energy costs and lower margins, offset partially by O&M savings. PSEG provided 2009 operating earnings guidance of $3.00-$3.25 per share.
public serviceenterprise group library.corporate-irfinance20
PSEG held an earnings conference call to discuss its fourth quarter and full-year 2008 results. For the fourth quarter, PSEG reported operating earnings of $250 million compared to $272 million in the prior year quarter. For the full year, operating earnings were $1,487 million compared to $1,385 million in 2007. PSEG Power's fourth quarter operating earnings were $207 million, matching the prior year, while PSE&G's were $76 million, down slightly from $77 million in 2007. PSEG provided 2009 operating earnings guidance of $3.00-$3.25 per share.
This document provides a reconciliation of GAAP financial measures to non-GAAP financial measures for Delta Air Lines for various periods in 2007 and 2006. It excludes certain items from key metrics like CASM, PRASM, EBITDAR, and free cash flow that management believes are not indicative of underlying operational performance, such as reorganization costs, accounting adjustments, and fuel price fluctuations. The excluded items provide a more meaningful comparison of Delta's performance to prior periods and the industry.
This document summarizes Tribune Company's financial results for the first quarter of 2002 compared to the first quarter of 2001. Some key points:
- Operating revenues decreased 5% to $1.23 billion due to declines in publishing advertising and classified revenues. Operating profit before restructuring charges fell 3% to $251.7 million.
- Restructuring charges of $27.3 million were recorded in the first quarter of 2002 related to cost reduction initiatives.
- Net loss was $101.6 million compared to a net income of $70.6 million in 2001, driven by non-operating losses on investments and the cumulative effect of a change in accounting principle.
- Publishing revenues fell 6
coca cola Operating Income & Cash Flow Reconciliationfinance9
The document discusses a company's financial results and provides supplemental non-GAAP data to allow for additional comparisons between periods. It summarizes GAAP results for operating income and cash from operations for Q2 and the first half of 2002 and 2003. Adjustments are shown to exclude certain one-time items in order to provide a more meaningful view of comparable operating performance. Non-GAAP measures should be viewed as a supplement, not an alternative, to GAAP reporting.
Similar to coca cola Reconciliation of Q1 2007 Non-GAAP Financial Measures (18)
enterprise gp holdings Organizational and Ownership Structure Chart finance9
- Dan L. Duncan, EPCO, Inc, Dan Duncan LLC and other affiliates own 77.44% of the ownership units of Enterprise GP Holdings L.P. as of April 30, 2008.
- The remaining 22.55% of ownership units are held by public investors.
- Enterprise GP Holdings L.P. owns the general partner interests and limited partner interests in Enterprise Products Partners L.P., Energy Transfer Equity L.P., and other related companies.
enterprise gp holdings Standards of Business Conductfinance9
The document outlines the Standards of Business Conduct for Enterprise GP Holdings L.P., EPE Holdings, LLC, and their divisions and subsidiaries. It establishes ethical guidelines for employees and contractors regarding conflicts of interest, use of company resources, gifts, political activities, and other interactions. Representatives must avoid situations that could compromise their objectivity or the company's interests, and report any violations of the Standards. Adherence to the policies is required to maintain employment or contracts.
enterprise gp holdings Audit, Conflicts & Governance Committeefinance9
The document establishes an Audit, Conflicts and Governance Committee for EPE Holdings, LLC to assist with Board oversight of financial reporting, compliance, auditor independence, and related-party transactions. The Committee is responsible for appointing and overseeing the independent auditor, reviewing financial statements and disclosures, overseeing compliance and legal matters, and assessing risk. However, the Committee's role is oversight and it relies on management and the auditor for accurate financial reporting and audits.
enterprise gp holdings Code of Conduct & Related Policiesfinance9
This document outlines a code of conduct for EPCO, Inc. employees. It describes 10 sections: [1] Introduction and purpose, [2] General business principles, [3] Legal and ethical obligations, [4] Company compliance policies, [5] Procedures for obtaining guidance, [6] Reporting compliance violations, [7] Discipline and consequences, [8] Individual responsibility and duty, [9] Waivers of the code, and [10] Employee certification. The code is intended to govern employees' business activities and represent the code of ethics required by the Sarbanes-Oxley Act.
02/11/09 HCA Announces Offering of $300 Million Senior Secured Second Lien Notesfinance9
HCA announced plans to offer $300 million in senior secured second lien notes due in 2017. Proceeds from the offering will be used to repay existing debt, including amounts owed under HCA's credit facilities. The notes have not been registered with the SEC and cannot be offered in the US without registration or an exemption. The announcement contains forward-looking statements about HCA's plans and expectations that are subject to risks and uncertainties.
The document is the 2000 annual report of HCA - The Healthcare Company. It summarizes that in 2000, HCA achieved strong financial and operating performance including over 6% revenue growth, improved margins, and investments of over $1.5 billion in facilities. The company also repurchased $874 million of its common stock. This performance was driven by a focus on patient, physician, and employee satisfaction as well as initiatives to standardize processes while decentralizing decision-making power. Going forward, HCA aims to further develop shared services and a focus on patient safety to strengthen its position.
- HCA is one of the largest healthcare services companies in the US, operating 184 hospitals across 23 states, England, and Switzerland as of 2001.
- In 2001, HCA invested $1.4 billion in capital expenditures, with plans to invest $1.6 billion in 2002 and $1.8 billion in 2003 primarily to expand capacity, improve access, and upgrade infrastructure like emergency departments.
- Population growth in Sunbelt regions where many HCA hospitals operate is driving increased demand for healthcare services, along with new technologies and an aging population requiring more care.
The document is HCA's 2002 annual report. It summarizes that 2002 was a successful year for HCA financially and in resolving investigations by the federal government. HCA reinvested $1.7 billion in its existing facilities and acquired additional hospitals. It also initiated several long-term programs to develop its workforce, such as scholarships through HCA Cares and military training through Army PaYS, to address the national nursing shortage. The CEO and COO were pleased with progress in 2002, their first full year in their roles, and committed to continued investment in facilities, technology, and employees.
HCA's 2003 annual report discusses developments that positioned the company for future growth. Key points include:
1) HCA invested over $1.8 billion to update its existing facilities with new technology and increase capacity.
2) The acquisition of Health Midwest expanded HCA's presence in the Kansas City market.
3) HCA invested $130 million to improve its revenue management and supply chain operations by consolidating them into regional centers.
4) New patient safety technologies like barcoded medication administration were deployed across HCA hospitals.
The document is HCA's 2004 annual report to shareholders. It discusses HCA's financial highlights for 2004 including revenues of $23.5 billion and net income of $1.246 billion. It also discusses challenges faced in 2004 such as reductions in Medicare payments and hurricanes. The letter to shareholders discusses how HCA deployed $3.05 billion in cash flows to invest in capital projects, increase dividends, and repurchase shares. Challenges discussed for 2005 include rising costs of medical devices and caring for the uninsured population.
- Hurricane Katrina caused catastrophic flooding in New Orleans, including at HCA's Tulane University Hospital.
- On Tuesday morning, the hospital's CEO realized flooding was rising over a foot per hour and they had only a few hours before losing power. They had to evacuate seven ventilator patients immediately.
- Through heroic efforts by the hospital staff and support from HCA and other organizations, the ventilator patients and others were evacuated from the roof via helicopter by early Tuesday morning, despite immense challenges including no boat or helicopter pad. This marked the beginning of a massive evacuation effort to rescue over 1,200 patients, staff, and family members from the hospital.
The document is a series of maps showing the rise in obesity rates among US adults from 1985 to 2006 based on data from the CDC's Behavioral Risk Factor Surveillance System. The maps show obesity, defined as a BMI of 30 or higher, increasing from below 10% in most states in 1985 to over 30% in many states by 2006, indicating a significant nationwide rise in obesity over the past few decades.
HCA Presents at Bank of America 2008 Credit Conference 20-Nov-2008finance9
HCA Healthcare's management provided forward-looking statements during their presentation that are protected under safe harbor provisions. They cautioned that current plans and financial projections may differ from forward-looking statements due to known and unknown risks and uncertainties. The presentation also included certain non-GAAP financial measures that are reconciled to the most directly comparable GAAP measures.
The document is Tyson Foods' 2007 sustainability report, which provides information on the company's economic, social, and environmental performance. It discusses Tyson's commitment to sustainability in areas such as ethics and governance, employee relations, food safety, animal welfare, and community involvement. The report also outlines Tyson's strategies and goals for optimizing operations, expanding internationally, and developing innovative food solutions.
Tyson Foods is the world's largest processor and marketer of chicken, beef, and pork. In fiscal year 2008, Tyson Foods had sales of $26.9 billion and employed over 107,000 team members. Tyson Foods operates vertically integrated poultry and meat production facilities across the United States and internationally, producing over 40 million chickens, 141,860 cattle, and 393,360 hogs per week on average. The company sells its protein products through various distribution channels, including retail consumer products, food service, and international markets.
Tyson Foods had a challenging year financially in 2008 due to high input costs for chicken raising, but was able to remain profitable due to strong performances in pork and beef. The company continued pursuing its strategy of building a multinational business through acquisitions in Brazil, India, and China that will position it for long-term international growth as the global middle class expands. Tyson is also working to develop innovative new products and markets for non-prime meat products through initiatives in renewable fuels, pet foods, nutraceuticals, and biotechnology.
The document is a notice and proxy statement for the 2008 Annual Meeting of Shareholders of General Dynamics Corporation. It notifies shareholders that the meeting will be held on May 7, 2008 to elect directors, conduct an advisory vote on selecting KPMG LLP as the independent auditor, and consider two shareholder proposals. It provides instructions for shareholders on attending the meeting, voting procedures, revoking proxies, and vote requirements.
This document is General Dynamics' annual report for 2007. It discusses the company's strong financial performance in 2007, with record sales, earnings, cash flow, orders, and backlog. Specifically, net sales increased 13% to $27.24 billion. Earnings from continuing operations grew 21% to $2.08 billion. Cash from continuing operations was $2.95 billion, up 37%. The annual report provides an overview of each of General Dynamics' business segments and their performance in 2007, noting growth across Aerospace, Combat Systems, and Marine Systems.
general dynamics Restated Certificate of Incorporation finance9
This document is a Restated Certificate of Incorporation for General Dynamics Corporation. It was adopted by the Board of Directors on October 6, 2004 and filed with the Secretary of State of Delaware on that same date. The document restates the original Certificate of Incorporation from 1952 and does not further amend or supplement it. It then lists 22 purposes of the corporation related to manufacturing, research, transportation, mining, real estate, purchasing other businesses, intellectual property, issuing financial instruments, and acting as a selling agent.
13 Jun 24 ILC Retirement Income Summit - slides.pptxILC- UK
ILC's Retirement Income Summit was hosted by M&G and supported by Canada Life. The event brought together key policymakers, influencers and experts to help identify policy priorities for the next Government and ensure more of us have access to a decent income in retirement.
Contributors included:
Jo Blanden, Professor in Economics, University of Surrey
Clive Bolton, CEO, Life Insurance M&G Plc
Jim Boyd, CEO, Equity Release Council
Molly Broome, Economist, Resolution Foundation
Nida Broughton, Co-Director of Economic Policy, Behavioural Insights Team
Jonathan Cribb, Associate Director and Head of Retirement, Savings, and Ageing, Institute for Fiscal Studies
Joanna Elson CBE, Chief Executive Officer, Independent Age
Tom Evans, Managing Director of Retirement, Canada Life
Steve Groves, Chair, Key Retirement Group
Tish Hanifan, Founder and Joint Chair of the Society of Later life Advisers
Sue Lewis, ILC Trustee
Siobhan Lough, Senior Consultant, Hymans Robertson
Mick McAteer, Co-Director, The Financial Inclusion Centre
Stuart McDonald MBE, Head of Longevity and Democratic Insights, LCP
Anusha Mittal, Managing Director, Individual Life and Pensions, M&G Life
Shelley Morris, Senior Project Manager, Living Pension, Living Wage Foundation
Sarah O'Grady, Journalist
Will Sherlock, Head of External Relations, M&G Plc
Daniela Silcock, Head of Policy Research, Pensions Policy Institute
David Sinclair, Chief Executive, ILC
Jordi Skilbeck, Senior Policy Advisor, Pensions and Lifetime Savings Association
Rt Hon Sir Stephen Timms, former Chair, Work & Pensions Committee
Nigel Waterson, ILC Trustee
Jackie Wells, Strategy and Policy Consultant, ILC Strategic Advisory Board
The Rise and Fall of Ponzi Schemes in America.pptxDiana Rose
Ponzi schemes, a notorious form of financial fraud, have plagued America’s investment landscape for decades. Named after Charles Ponzi, who orchestrated one of the most infamous schemes in the early 20th century, these fraudulent operations promise high returns with little or no risk, only to collapse and leave investors with significant losses. This article explores the nature of Ponzi schemes, notable cases in American history, their impact on victims, and measures to prevent falling prey to such scams.
Understanding Ponzi Schemes
A Ponzi scheme is an investment scam where returns are paid to earlier investors using the capital from newer investors, rather than from legitimate profit earned. The scheme relies on a constant influx of new investments to continue paying the promised returns. Eventually, when the flow of new money slows down or stops, the scheme collapses, leaving the majority of investors with substantial financial losses.
Historical Context: Charles Ponzi and His Legacy
Charles Ponzi is the namesake of this deceptive practice. In the 1920s, Ponzi promised investors in Boston a 50% return within 45 days or 100% return in 90 days through arbitrage of international reply coupons. Initially, he paid returns as promised, not from profits, but from the investments of new participants. When his scheme unraveled, it resulted in losses exceeding $20 million (equivalent to about $270 million today).
Notable American Ponzi Schemes
1. Bernie Madoff: Perhaps the most notorious Ponzi scheme in recent history, Bernie Madoff’s fraud involved $65 billion. Madoff, a well-respected figure in the financial industry, promised steady, high returns through a secretive investment strategy. His scheme lasted for decades before collapsing in 2008, devastating thousands of investors, including individuals, charities, and institutional clients.
2. Allen Stanford: Through his company, Stanford Financial Group, Allen Stanford orchestrated a $7 billion Ponzi scheme, luring investors with fraudulent certificates of deposit issued by his offshore bank. Stanford promised high returns and lavish lifestyle benefits to his investors, which ultimately led to a 110-year prison sentence for the financier in 2012.
3. Tom Petters: In a scheme that lasted more than a decade, Tom Petters ran a $3.65 billion Ponzi scheme, using his company, Petters Group Worldwide. He claimed to buy and sell consumer electronics, but in reality, he used new investments to pay off old debts and fund his extravagant lifestyle. Petters was convicted in 2009 and sentenced to 50 years in prison.
4. Eric Dalius and Saivian: Eric Dalius, a prominent figure behind Saivian, a cashback program promising high returns, is under scrutiny for allegedly orchestrating a Ponzi scheme. Saivian enticed investors with promises of up to 20% cash back on everyday purchases. However, investigations suggest that the returns were paid using new investments rather than legitimate profits. The collapse of Saivian l
What Lessons Can New Investors Learn from Newman Leech’s Success?Newman Leech
Newman Leech's success in the real estate industry is based on key lessons and principles, offering practical advice for new investors and serving as a blueprint for building a successful career.
Discovering Delhi - India's Cultural Capital.pptxcosmo-soil
Delhi, the heartbeat of India, offers a rich blend of history, culture, and modernity. From iconic landmarks like the Red Fort to bustling commercial hubs and vibrant culinary scenes, Delhi's real estate landscape is dynamic and diverse. Discover the essence of India's capital, where tradition meets innovation.
Fabular Frames and the Four Ratio ProblemMajid Iqbal
Digital, interactive art showing the struggle of a society in providing for its present population while also saving planetary resources for future generations. Spread across several frames, the art is actually the rendering of real and speculative data. The stereographic projections change shape in response to prompts and provocations. Visitors interact with the model through speculative statements about how to increase savings across communities, regions, ecosystems and environments. Their fabulations combined with random noise, i.e. factors beyond control, have a dramatic effect on the societal transition. Things get better. Things get worse. The aim is to give visitors a new grasp and feel of the ongoing struggles in democracies around the world.
Stunning art in the small multiples format brings out the spatiotemporal nature of societal transitions, against backdrop issues such as energy, housing, waste, farmland and forest. In each frame we see hopeful and frightful interplays between spending and saving. Problems emerge when one of the two parts of the existential anaglyph rapidly shrinks like Arctic ice, as factors cross thresholds. Ecological wealth and intergenerational equity areFour at stake. Not enough spending could mean economic stress, social unrest and political conflict. Not enough saving and there will be climate breakdown and ‘bankruptcy’. So where does speculative design start and the gambling and betting end? Behind each fabular frame is a four ratio problem. Each ratio reflects the level of sacrifice and self-restraint a society is willing to accept, against promises of prosperity and freedom. Some values seem to stabilise a frame while others cause collapse. Get the ratios right and we can have it all. Get them wrong and things get more desperate.
Confirmation of Payee (CoP) is a vital security measure adopted by financial institutions and payment service providers. Its core purpose is to confirm that the recipient’s name matches the information provided by the sender during a banking transaction, ensuring that funds are transferred to the correct payment account.
Confirmation of Payee was built to tackle the increasing numbers of APP Fraud and in the landscape of UK banking, the spectre of APP fraud looms large. In 2022, over £1.2 billion was stolen by fraudsters through authorised and unauthorised fraud, equivalent to more than £2,300 every minute. This statistic emphasises the urgent need for robust security measures like CoP. While over £1.2 billion was stolen through fraud in 2022, there was an eight per cent reduction compared to 2021 which highlights the positive outcomes obtained from the implementation of Confirmation of Payee. The number of fraud cases across the UK also decreased by four per cent to nearly three million cases during the same period; latest statistics from UK Finance.
In essence, Confirmation of Payee plays a pivotal role in digital banking, guaranteeing the flawless execution of banking transactions. It stands as a guardian against fraud and misallocation, demonstrating the commitment of financial institutions to safeguard their clients’ assets. The next time you engage in a banking transaction, remember the invaluable role of CoP in ensuring the security of your financial interests.
For more details, you can visit https://technoxander.com.
A toxic combination of 15 years of low growth, and four decades of high inequality, has left Britain poorer and falling behind its peers. Productivity growth is weak and public investment is low, while wages today are no higher than they were before the financial crisis. Britain needs a new economic strategy to lift itself out of stagnation.
Scotland is in many ways a microcosm of this challenge. It has become a hub for creative industries, is home to several world-class universities and a thriving community of businesses – strengths that need to be harness and leveraged. But it also has high levels of deprivation, with homelessness reaching a record high and nearly half a million people living in very deep poverty last year. Scotland won’t be truly thriving unless it finds ways to ensure that all its inhabitants benefit from growth and investment. This is the central challenge facing policy makers both in Holyrood and Westminster.
What should a new national economic strategy for Scotland include? What would the pursuit of stronger economic growth mean for local, national and UK-wide policy makers? How will economic change affect the jobs we do, the places we live and the businesses we work for? And what are the prospects for cities like Glasgow, and nations like Scotland, in rising to these challenges?
Navigating Your Financial Future: Comprehensive Planning with Mike Baumannmikebaumannfinancial
Learn how financial planner Mike Baumann helps individuals and families articulate their financial aspirations and develop tailored plans. This presentation delves into budgeting, investment strategies, retirement planning, tax optimization, and the importance of ongoing plan adjustments.
Monthly Market Risk Update: June 2024 [SlideShare]Commonwealth
Markets rallied in May, with all three major U.S. equity indices up for the month, said Sam Millette, director of fixed income, in his latest Market Risk Update.
For more market updates, subscribe to The Independent Market Observer at https://blog.commonwealth.com/independent-market-observer.
KYC Compliance: A Cornerstone of Global Crypto Regulatory FrameworksAny kyc Account
This presentation explores the pivotal role of KYC compliance in shaping and enforcing global regulations within the dynamic landscape of cryptocurrencies. Dive into the intricate connection between KYC practices and the evolving legal frameworks governing the crypto industry.
KYC Compliance: A Cornerstone of Global Crypto Regulatory Frameworks
coca cola Reconciliation of Q1 2007 Non-GAAP Financial Measures
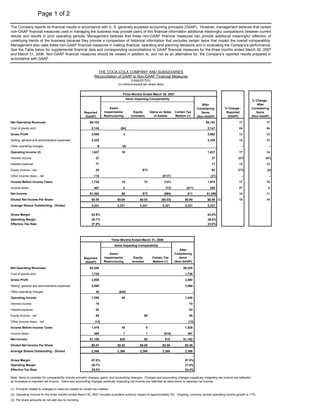
1. Page 1 of 2
The Company reports its financial results in accordance with U. S. generally accepted accounting principles (GAAP). However, management believes that certain
non-GAAP financial measures used in managing the business may provide users of this financial information additional meaningful comparisons between current
results and results in prior operating periods. Management believes that these non-GAAP financial measures can provide additional meaningful reflection of
underlying trends of the business because they provide a comparison of historical information that excludes certain items that impact the overall comparability.
Management also uses these non-GAAP financial measures in making financial, operating and planning decisions and in evaluating the Company's performance.
See the Table below for supplemental financial data and corresponding reconciliations to GAAP financial measures for the three months ended March 30, 2007
and March 31, 2006. Non-GAAP financial measures should be viewed in addition to, and not as an alternative for, the Company’s reported results prepared in
accordance with GAAP.
THE COCA-COLA COMPANY AND SUBSIDIARIES
Reconciliation of GAAP to Non-GAAP Financial Measures
(UNAUDITED)
(In millions except per share data)
Three Months Ended March 30, 2007
Items Impacting Comparability
% Change -
After
After
Asset % Change - Considering
Considering
Impairments/ Equity Gains on Sales Certain Tax Reported Items
Reported Items
Restructuring Investees of Assets Matters (1) (GAAP) (Non-GAAP)
(GAAP) (Non-GAAP)
Net Operating Revenues $6,103 $6,103 17 17
Cost of goods sold 2,145 ($4) 2,141 24 24
Gross Profit 3,958 4 3,962 13 13
Selling, general and administrative expenses 2,325 2,325 13 13
Other operating charges 6 (6) - -- --
Operating Income (2) 1,627 10 1,637 17 14
Interest income 37 37 (47) (47)
Interest expense 71 71 13 13
Equity income - net 20 $73 93 (77) (2)
Other income (loss) - net 116 ($137) (21) -- --
Income Before Income Taxes 1,729 10 73 (137) 1,675 17 10
Income taxes 467 2 - (73) ($11) 385 27 5
Net Income $1,262 $8 $73 ($64) $11 $1,290 14 11
Diluted Net Income Per Share $0.54 $0.00 $0.03 ($0.03) $0.00 $0.56 (3) 15 14
Average Shares Outstanding - Diluted 2,321 2,321 2,321 2,321 2,321 2,321
Gross Margin 64.9% 64.9%
Operating Margin 26.7% 26.8%
Effective Tax Rate 27.0% 23.0%
Three Months Ended March 31, 2006
Items Impacting Comparability
After
Asset Considering
Impairments/ Equity Certain Tax Items
Reported
Restructuring Investee Matters (1) (Non-GAAP)
(GAAP)
Net Operating Revenues $5,226 $5,226
Cost of goods sold 1,726 1,726
Gross Profit 3,500 3,500
Selling, general and administrative expenses 2,060 2,060
Other operating charges 45 ($45) -
Operating Income 1,395 45 1,440
Interest income 70 70
Interest expense 63 63
Equity income - net 86 $9 95
Other income (loss) - net (13) (13)
Income Before Income Taxes 1,475 45 9 1,529
Income taxes 369 7 1 ($10) 367
Net Income $1,106 $38 $8 $10 $1,162
Diluted Net Income Per Share $0.47 $0.02 $0.00 $0.00 $0.49
Average Shares Outstanding - Diluted 2,366 2,366 2,366 2,366 2,366
Gross Margin 67.0% 67.0%
Operating Margin 26.7% 27.6%
Effective Tax Rate 25.0% 24.0%
Note: Items to consider for comparability include primarily charges, gains, and accounting changes. Charges and accounting changes negatively impacting net income are reflected
as increases to reported net income. Gains and accounting changes positively impacting net income are reflected as deductions to reported net income.
(1) Primarily related to changes in reserves related to certain tax matters.
(2) Operating Income for the three months ended March 30, 2007 includes a positive currency impact of approximately 3%. Ongoing, currency neutral operating income growth is 11%.
(3) Per share amounts do not add due to rounding.
2. Page 2 of 2
The Company reports its financial results in accordance with U. S. generally accepted accounting principles (GAAP). However, management believes that certain non-
GAAP financial measures used in managing the business may provide users of this financial information additional meaningful comparisons between current results and
results in prior operating periods. Management believes that these non-GAAP financial measures can provide additional meaningful reflection of underlying trends of the
business because they provide a comparison of historical information that excludes certain items that impact the overall comparability. Management also uses these non-
GAAP financial measures in making financial, operating and planning decisions and in evaluating the Company's performance. See the Table below for supplemental
financial data and corresponding reconciliations to GAAP financial measures for the three months ended March 30, 2007 and March 31, 2006. Non-GAAP financial
measures should be viewed in addition to, and not as an alternative for, the Company’s reported results prepared in accordance with GAAP.
THE COCA-COLA COMPANY AND SUBSIDIARIES
Reconciliation of GAAP to Non-GAAP Financial Measures
Operating Income (Loss), by Segment
(UNAUDITED)
(In millions except percentages)
Three Months Ended March 30, 2007 Three Months Ended March 31, 2006
Items
Items Impacting Impacting
Comparability Comparability
% Favorable
(Unfavorable) -
% Favorable
After After After
(Unfavorable) -
Considering Considering Considering
Asset
Reported
Reported Items Reported Items
Asset Impairments/ Impairments/ Items
(GAAP)
Restructuring Restructuring
(GAAP) (Non-GAAP) (GAAP) (Non-GAAP) (Non-GAAP)
Africa $112 $2 $114 $103 $103 9 11
Eurasia 87 87 64 64 36 36
European Union 604 604 455 455 33 33
Latin America 415 415 349 349 19 19
North America 347 347 388 388 (11) (11)
Pacific 372 372 363 $3 366 2 2
Bottling Investments (2) 6 4 (57) 42 (15) 96 --
Corporate (308) 2 (306) (270) (270) (14) (13)
Consolidated $1,627 $10 $1,637 $1,395 $45 $1,440 17 14