
Recommended
More Related Content
What's hot
What's hot (20)
Similar to coca cola Reconciliation of Non-GAAP Financial Measures for 2008 Lehman Brothers Back-To-School Conference
Similar to coca cola Reconciliation of Non-GAAP Financial Measures for 2008 Lehman Brothers Back-To-School Conference (19)
More from finance9
More from finance9 (20)
Recently uploaded
Recently uploaded (20)
coca cola Reconciliation of Non-GAAP Financial Measures for 2008 Lehman Brothers Back-To-School Conference
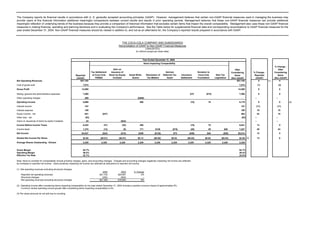
- 1. The Company reports its financial results in accordance with U. S. generally accepted accounting principles (GAAP). However, management believes that certain non-GAAP financial measures used in managing the business may provide users of this financial information additional meaningful comparisons between current results and results in prior operating periods. Management believes that these non-GAAP financial measures can provide additional meaningful reflection of underlying trends of the business because they provide a comparison of historical information that excludes certain items that impact the overall comparability. Management also uses these non-GAAP financial measures in making financial, operating and planning decisions and in evaluating the Company's performance. See the Table below for supplemental financial data and corresponding reconciliations to GAAP financial measures for the year ended December 31, 2004. Non-GAAP financial measures should be viewed in addition to, and not as an alternative for, the Company’s reported results prepared in accordance with GAAP. THE COCA-COLA COMPANY AND SUBSIDIARIES Reconciliation of GAAP to Non-GAAP Financial Measures (UNAUDITED) (In millions except per share data) Year Ended December 31, 2004 Items Impacting Comparability % Change - Gain on After After Tax Settlement Issuance of German Donation to % Change - Considering Considering at Coca-Cola Stock by Equity Asset Write- Resolution of Deferred Tax Insurance Coca-Cola New Tax Reported Items Reported Items FEMSA Investee downs Tax Matters Asset Settlement Foundation Legislation (GAAP) (Non-GAAP) (GAAP) (Non-GAAP) Net Operating Revenues $21,742 $21,742 4 (1) 4 Cost of goods sold 7,674 7,674 (1) (2) Gross Profit 14,068 14,068 8 8 Selling, general and administrative expenses 7,890 $75 ($75) 7,890 8 8 Other operating charges 480 ($480) - -- -- Operating Income 5,698 480 (75) 75 6,178 9 8 (2) Interest income 157 157 (11) (11) Interest expense 196 196 10 10 Equity income - net 621 ($37) 584 53 15 Other loss - net (82) (82) -- -- Gains on issuances of stock by equity investees 24 ($24) - -- -- Income Before Income Taxes 6,222 (37) (24) 480 (75) 75 6,641 13 9 Income taxes 1,375 (13) (9) 171 $128 ($75) (29) 29 $50 1,627 20 24 Net Income $4,847 ($24) ($15) $309 ($128) $75 ($46) $46 ($50) $5,014 12 5 Diluted Net Income Per Share $2.00 ($0.01) ($0.01) $0.13 ($0.05) $0.03 ($0.02) $0.02 ($0.02) $2.06 (3) 13 6 Average Shares Outstanding - Diluted 2,429 2,429 2,429 2,429 2,429 2,429 2,429 2,429 2,429 2,429 Gross Margin 64.7% 64.7% Operating Margin 26.2% 28.4% Effective Tax Rate 22.1% 24.5% Note: Items to consider for comparability include primarily charges, gains, and accounting changes. Charges and accounting changes negatively impacting net income are reflected as increases to reported net income. Gains positively impacting net income are reflected as deductions to reported net income. (1) Net operating revenues excluding structural changes: 2004 2003 % Change Reported net operating revenues $21,742 $20,857 4% Structural changes (292) (904) -- Net operating revenues excluding structural changes $21,450 $19,953 8% (2) Operating income after considering items impacting comparability for the year ended December 31, 2004 includes a positive currency impact of approximately 8%. Currency neutral operating income growth after considering items impacting comparability is 0%. (3) Per share amounts do not add due to rounding.
- 2. The Company reports its financial results in accordance with U. S. generally accepted accounting principles (GAAP). However, management believes that certain non-GAAP financial measures used in managing the business may provide users of this financial information additional meaningful comparisons between current results and results in prior operating periods. Management believes that these non- GAAP financial measures can provide additional meaningful reflection of underlying trends of the business because they provide a comparison of historical information that excludes certain items that impact the overall comparability. Management also uses these non-GAAP financial measures in making financial, operating and planning decisions and in evaluating the Company's performance. See the Table below for supplemental financial data and corresponding reconciliations to GAAP financial measures for the year ended December 31, 2005. Non-GAAP financial measures should be viewed in addition to, and not as an alternative for, the Company’s reported results prepared in accordance with GAAP. THE COCA-COLA COMPANY AND SUBSIDIARIES Reconciliation of GAAP to Non-GAAP Financial Measures (UNAUDITED) (In millions except per share data) Year Ended December 31, 2005 Items Impacting Comparability % Change - Issuances of Accelerated After After Repatriation of Stock by Amortization of % Change - Considering Considering HFCS Resolution of Foreign Equity Stock-Based Equity Asset Write- Reported Items Reported Items Settlement Tax Matters Earnings Investees Compensation Investee downs (GAAP) (Non-GAAP) (GAAP) (Non-GAAP) Net Operating Revenues $23,104 $23,104 6 (1) 6 Cost of goods sold 8,195 $47 8,242 7 7 Gross Profit 14,909 (47) 14,862 6 6 Selling, general and administrative expenses 8,739 ($50) 8,689 11 10 Other operating charges 85 ($85) - -- -- Operating Income* 6,085 (47) 50 85 6,173 7 (0) (2) Interest income 235 235 50 50 Interest expense 240 240 22 22 Equity income - net 680 $33 4 717 10 23 Other loss - net (93) (93) -- -- Gains on issuances of stock by equity investees 23 ($23) - (4) -- Income Before Income Taxes 6,690 (47) (23) 50 33 89 6,792 8 2 Income taxes 1,818 (18) $101 ($315) ($8) 12 2 4 1,596 32 (2) Net Income $4,872 ($29) ($101) $315 ($15) $38 $31 $85 $5,196 1 4 Diluted Net Income Per Share $2.04 ($0.01) ($0.04) $0.13 ($0.01) $0.02 $0.01 $0.04 $2.17 (3) 2 5 Average Shares Outstanding - Diluted 2,393 2,393 2,393 2,393 2,393 2,393 2,393 2,393 2,393 Gross Margin 64.5% 64.3% Operating Margin 26.3% 26.7% Effective Tax Rate 27.2% 23.5% Note: Items to consider for comparability include primarily charges, gains, and accounting changes. Charges and accounting changes negatively impacting net income are reflected as increases to reported net income. Gains positively impacting net income are reflected as deductions to reported net income. (1) Net operating revenues excluding structural changes: 2005 2004 % Change Reported net operating revenues $23,104 $21,742 6% Structural changes (146) (40) -- Net operating revenues excluding structural changes $22,958 $21,702 6% (2) Operating income after considering items impacting comparability for the year ended December 31, 2005 includes a positive currency impact of approximately 4%. Currency neutral operating income growth after considering items impacting comparability is -4%. (3) Per share amounts do not add due to rounding.
- 3. The Company reports its financial results in accordance with U. S. generally accepted accounting principles (GAAP). However, management believes that certain non-GAAP financial measures used in managing the business may provide users of this financial information additional meaningful comparisons between current results and results in prior operating periods. Management believes that these non-GAAP financial measures can provide additional meaningful reflection of underlying trends of the business because they provide a comparison of historical information that excludes certain items that impact the overall comparability. Management also uses these non-GAAP financial measures in making financial, operating and planning decisions and in evaluating the Company's performance. See the Table below for supplemental financial data and corresponding reconciliations to GAAP financial measures for the three months ended March 31, 2006 and April 1, 2005. Non-GAAP financial measures should be viewed in addition to, and not as an alternative for, the Company’s reported results prepared in accordance with GAAP. THE COCA-COLA COMPANY AND SUBSIDIARIES Reconciliation of GAAP to Non-GAAP Financial Measures (UNAUDITED) (In millions except per share data) Three Months Ended March 31, 2006 Three Months Ended April 1, 2005 Items Impacting Comparability Items Impacting Comparability % Change - Accelerated After After After Asset Issuances of Repatriation of Amortization of % Change - Considering Considering Considering Equity Impairments/ Certain Tax Stock by Equity Resolution of Foreign Stock-Based Reported Items Reported Items Reported Items Investee Restructuring Matters (1) Investees Tax Matters Earnings Compensation (GAAP) (Non-GAAP) (GAAP) (Non-GAAP) (GAAP) (Non-GAAP) Net Operating Revenues $5,226 $5,226 $5,206 $5,206 0 0 Cost of goods sold 1,726 1,726 1,818 1,818 (5) (5) Gross Profit 3,500 3,500 3,388 3,388 3 3 Selling, general and administrative expenses 2,060 2,060 2,029 ($50) 1,979 2 4 Other operating charges 45 ($45) - - - -- -- Operating Income 1,395 45 1,440 1,359 50 1,409 3 2 Interest income 70 70 60 60 17 17 Interest expense 63 63 68 68 (7) (7) Equity income - net 86 $9 95 91 91 (5) 4 Other income (loss) - net (13) (13) (17) (17) -- -- Gain on issuances of stock by equity investees - - 23 ($23) - -- -- Income Before Income Taxes 1,475 9 45 1,529 1,448 (23) 50 1,475 2 4 Income taxes 369 1 7 ($10) 367 446 (8) $56 ($152) 12 354 (17) 4 Net Income $1,106 $8 $38 $10 $1,162 $1,002 ($15) ($56) $152 $38 $1,121 10 4 Diluted Net Income Per Share $0.47 $0.00 $0.02 $0.00 $0.49 $0.42 ($0.01) ($0.02) $0.06 $0.02 $0.47 12 4 Average Shares Outstanding - Diluted 2,366 2,366 2,366 2,366 2,366 2,410 2,410 2,410 2,410 2,410 2,410 Gross Margin 67.0% 67.0% 65.1% 65.1% Operating Margin 26.7% 27.6% 26.1% 27.1% Effective Tax Rate 25.0% 24.0% 30.8% 24.0% Note: Items to consider for comparability include primarily charges, gains, and accounting changes. Charges and accounting changes negatively impacting net income are reflected as increases to reported net income. Gains and accounting changes positively impacting net income are reflected as deductions to reported net income. (1) Primarily related to increases in reserves related to certain tax matters.
- 4. The Company reports its financial results in accordance with U. S. generally accepted accounting principles (GAAP). However, management believes that certain non-GAAP financial measures used in managing the business may provide users of this financial information additional meaningful comparisons between current results and results in prior operating periods. Management believes that these non-GAAP financial measures can provide additional meaningful reflection of underlying trends of the business because they provide a comparison of historical information that excludes certain items that impact the overall comparability. Management also uses these non-GAAP financial measures in making financial, operating and planning decisions and in evaluating the Company's performance. See the Table below for supplemental financial data and corresponding reconciliations to GAAP financial measures for the three months ended June 30, 2006 and July 1, 2005. Non-GAAP financial measures should be viewed in addition to, and not as an alternative for, the Company’s reported results prepared in accordance with GAAP. THE COCA-COLA COMPANY AND SUBSIDIARIES Reconciliation of GAAP to Non-GAAP Financial Measures (UNAUDITED) (In millions except per share data and percentages) Three Months Ended June 30, 2006 Three Months Ended July 1, 2005 Items Impacting Comparability Items Impacting Comparability % Change - After After After % Change - Considering Considering Considering Equity Gain on Certain Tax HFCS Lawsuit Resolution of Repatriation of Reported Items Reported Items Reported Items Investee Turkey IPO Restructuring Matters (1) Settlement Tax Matters Foreign Earnings Equity Investee (GAAP) (Non-GAAP) (GAAP) (Non-GAAP) (GAAP) (Non-GAAP) Net Operating Revenues $6,476 $6,476 $6,310 $6,310 3 3 Cost of goods sold 2,110 2,110 2,146 $42 2,188 (2) (4) Gross Profit 4,366 4,366 4,164 (42) 4,122 5 6 Selling, general and administrative expenses 2,296 2,296 2,192 2,192 5 5 Other operating charges 31 ($31) - - - -- -- Operating Income 2,039 31 2,070 1,972 (42) 1,930 3 7 (2) Interest income 47 47 54 54 (13) (13) Interest expense 63 63 62 62 2 2 Equity income - net 252 ($21) 231 267 ($21) 246 (6) (6) Other income (loss) - net 116 ($123) (7) (15) (15) -- -- Income Before Income Taxes 2,391 (21) (123) 31 2,278 2,216 (42) (21) 2,153 8 6 Income taxes 555 (2) 14 1 ($22) 546 493 (16) $17 $25 (2) 517 13 6 Net Income $1,836 ($19) ($137) $30 $22 $1,732 $1,723 ($26) ($17) ($25) ($19) $1,636 7 6 Diluted Net Income Per Share $0.78 ($0.01) ($0.06) $0.01 $0.01 $0.74 (3) $0.72 ($0.01) ($0.01) ($0.01) ($0.01) $0.68 8 9 Average Shares Outstanding - Diluted 2,352 2,352 2,352 2,352 2,352 2,352 2,401 2,401 2,401 2,401 2,401 2,401 Gross Margin 67.4% 67.4% 66.0% 65.3% Operating Margin 31.5% 32.0% 31.3% 30.6% Effective Tax Rate 23.2% 24.0% 22.2% 24.0% Note: Items to consider for comparability include primarily charges, gains, and accounting changes. Charges and accounting changes negatively impacting net income are reflec as increases to reported net income. Gains and accounting changes positively impacting net income are reflected as deductions to reported net income. (1) Primarily related to increases in reserves related to certain tax matters. (2) Operating income after considering items impacting comparability for the three months ended June 30, 2006 includes a negative currency impact of approximately 1%. Currency neutral operating income growth after considering items impacting comparability is 8%. (3) Per share amounts do not add due to rounding.
- 5. The Company reports its financial results in accordance with U. S. generally accepted accounting principles (GAAP). However, management believes that certain non-GAAP financial measures used in managing the business may provide users of this financial information additional meaningful comparisons between current results and results in prior operating periods. Management believes that these non-GAAP financial measures can provide additional meaningful reflection of underlying trends of the business because they provide a comparison of historical information that excludes certain items that impact the overall comparability. Management also uses these non-GAAP financial measures in making financial, operating and planning decisions and in evaluating the Company's performance. See the Table below for supplemental financial data and corresponding reconciliations to GAAP financial measures for the three months ended September 29, 2006 and September 30, 2005. Non-GAAP financial measures should be viewed in addition to, and not as an alternative for, the Company’s reported results prepared in accordance with GAAP. THE COCA-COLA COMPANY AND SUBSIDIARIES Reconciliation of GAAP to Non-GAAP Financial Measures (UNAUDITED) (In millions except per share data) Three Months Ended September 29, 2006 Three Months Ended September 30, 2005 Items Impacting Comparability Items Impacting Comparability % Change - After After After Asset Considering Considering Considering Equity Impairments/ Certain Tax Asset Write- Resolution of % Change - Items Reported Items Reported Items Investees Restructuring Matters (1) downs Tax Matters Equity Investee Reported (GAAP) (Non-GAAP) (GAAP) (Non-GAAP) (GAAP) (Non-GAAP) Net Operating Revenues $6,454 $6,454 $6,037 $6,037 7 (2) 7 Cost of goods sold 2,265 2,265 2,235 2,235 1 1 Gross Profit 4,189 4,189 3,802 3,802 10 10 Selling, general and administrative expenses 2,488 2,488 2,225 2,225 12 12 Other operating charges 39 ($39) - 85 ($85) - -- -- Operating Income 1,662 39 1,701 1,492 85 1,577 11 8 Interest income 35 35 49 49 (29) (29) Interest expense 47 47 49 49 (4) (4) Equity income - net 231 $3 234 195 4 $5 204 18 15 Other income (loss) - net (55) (55) (34) (34) -- -- Income Before Income Taxes 1,826 3 39 1,868 1,653 89 5 1,747 10 7 Income taxes 366 1 12 $41 420 370 4 $18 - 392 (1) 7 Net Income $1,460 $2 $27 ($41) $1,448 $1,283 $85 ($18) $5 $1,355 14 7 Diluted Net Income Per Share $0.62 $0.00 $0.01 ($0.02) $0.62 (3) $0.54 $0.04 ($0.01) $0.00 $0.57 15 9 Average Shares Outstanding - Diluted 2,343 2,343 2,343 2,343 2,343 2,385 2,385 2,385 2,385 2,385 Gross Margin 64.9% 64.9% 63.0% 63.0% Operating Margin 25.8% 26.4% 24.7% 26.1% Effective Tax Rate 20.0% 22.5% 22.4% 22.5% (4) Note: Items to consider for comparability include primarily charges, gains, and accounting changes. Charges and accounting changes negatively impacting net income are reflected as increases to reported net income. Gains and accounting changes positively impacting net income are reflected as deductions to reported net income. (1) Primarily related to the reversal of a tax valuation allowance. (2) Net operating revenues excluding structural changes: 2006 2005 % Change Reported net operating revenues $6,454 $6,037 7% Structural changes (123) (239) -- Net operating revenues excluding structural changes $6,331 $5,798 9% (3) Per share amounts do not add due to rounding. (4) Effective tax rate calculated on full figures.
- 6. The Company reports its financial results in accordance with U. S. generally accepted accounting principles (GAAP). However, management believes that certain non-GAAP financial measures used in managing the business may provide users of this financial information additional meaningful comparisons between current results and results in prior operating periods. Management believes that these non-GAAP financial measures can provide additional meaningful reflection of underlying trends of the business because they provide a comparison of historical information that excludes certain items that impact the overall comparability. Management also uses these non-GAAP financial measures in making financial, operating and planning decisions and in evaluating the Company's performance. See the Table below for supplemental financial data and corresponding reconciliations to GAAP financial measures for the three months ended December 31, 2006 and December 31, 2005. Non-GAAP financial measures should be viewed in addition to, and not as an alternative for, the Company’s reported results prepared in accordance with GAAP. THE COCA-COLA COMPANY AND SUBSIDIARIES Reconciliation of GAAP to Non-GAAP Financial Measures (UNAUDITED) (In millions except per share data) Three Months Ended December 31, 2006 Items Impacting Comparability After Asset % Change - % Change - After Considering Impairments/ Foundation Certain Tax Reported Considering Items Reported Items Restructuring Equity Investees Transaction Gains Donation Matters (1) (GAAP) (Non-GAAP) (GAAP) (Non-GAAP) Net Operating Revenues $5,932 $5,932 7 7 Cost of goods sold 2,063 ($4) 2,059 3 3 Gross Profit 3,869 4 3,873 9 9 Selling, general and administrative expenses 2,587 ($100) 2,487 (2) 13 8 Other operating charges 70 (70) - -- -- Operating Income 1,212 74 100 1,386 (4) 10 Interest income 41 41 (43) (43) Interest expense 47 47 (23) (23) Equity income - net (467) $615 148 -- (16) Other income (loss) - net 147 ($175) (28) -- -- Income Before Income Taxes 886 74 615 (175) 100 1,500 (35) 6 Income taxes 208 10 57 (76) 38 $37 274 (59) (18) Net Income $678 $64 $558 ($99) $62 ($37) $1,226 (22) 13 Diluted Net Income Per Share $0.29 $0.03 $0.24 ($0.04) $0.03 ($0.02) $0.52 (3) (19) 13 Average Shares Outstanding - Diluted 2,341 2,341 2,341 2,341 2,341 2,341 2,341 Gross Margin 65.2% 65.3% Operating Margin 20.4% 23.4% Effective Tax Rate 23.5% 18.2% (4) Three Months Ended December 31, 2005 Items Impacting Comparability After Considering Resolution of Tax Repatriation of Reported Items HFCS Settlement Matters Foreign Earnings Equity Investee (GAAP) (Non-GAAP) Net Operating Revenues $5,551 $5,551 Cost of goods sold 1,996 $5 2,001 Gross Profit 3,555 (5) 3,550 Selling, general and administrative expenses 2,293 2,293 Operating Income 1,262 (5) 1,257 Interest income 72 72 Interest expense 61 61 Equity income - net 127 $49 176 Other income (loss) - net (27) (27) Income Before Income Taxes 1,373 (5) 49 1,417 Income taxes 509 (2) $10 ($188) 4 333 Net Income $864 ($3) ($10) $188 $45 $1,084 Diluted Net Income Per Share $0.36 $0.00 $0.00 $0.08 $0.02 $0.46 Average Shares Outstanding - Diluted 2,375 2,375 2,375 2,375 2,375 2,375 Gross Margin 64.0% 64.0% Operating Margin 22.7% 22.6% Effective Tax Rate 37.1% 23.5% Note: Items to consider for comparability include primarily charges, gains, and accounting changes. Charges and accounting changes negatively impacting net income are reflected as increases to reported net income. Gains and accounting changes positively impacting net income are reflected as deductions to reported net income. (1) Primarily related to changes in reserves related to certain tax matters. (2) Selling, general and administrative expenses excluding items impacting comparability and structural changes: 2006 2005 % Change Reported selling, general and administrative expenses $2,587 $2,293 13% Donation to The Coca-Cola Foundation (100) -- Structural changes (63) -- Selling, general and administrative expenses excluding items impacting comparability and structural changes $2,424 $2,293 6% (3) Per share amounts do not add due to rounding. (4) Effective tax rate calculated on full figures.
- 7. The Company reports its financial results in accordance with U. S. generally accepted accounting principles (GAAP). However, management believes that certain non-GAAP financial measures used in managing the business may provide users of this financial information additional meaningful comparisons between current results and results in prior operating periods. Management believes that these non-GAAP financial measures can provide additional meaningful reflection of underlying trends of the business because they provide a comparison of historical information that excludes certain items that impact the overall comparability. Management also uses these non-GAAP financial measures in making financial, operating and planning decisions and in evaluating the Company's performance. See the Table below for supplemental financial data and corresponding reconciliations to GAAP financial measures for the years ended December 31, 2006 and December 31, 2005. Non-GAAP financial measures should be viewed in addition to, and not as an alternative for, the Company’s reported results prepared in accordance with GAAP. THE COCA-COLA COMPANY AND SUBSIDIARIES Reconciliation of GAAP to Non-GAAP Financial Measures (UNAUDITED) (In millions except per share data) Year Ended December 31, 2006 Items Impacting Comparability % Change - After After Asset Considering % Change - Considering Impairments/ Equity Transaction Foundation Certain Tax Reported Items Reported Items Restructuring Investees Gains Donation Matters (1) (GAAP) (Non-GAAP) (GAAP) (Non-GAAP) Net Operating Revenues $24,088 $24,088 4 (2) 4 Cost of goods sold 8,164 ($4) 8,160 0 (1) Gross Profit 15,924 4 15,928 7 7 Selling, general and administrative expenses 9,431 ($100) 9,331 8 (3) 7 Other operating charges 185 (185) - -- -- Operating Income 6,308 189 100 6,597 4 7 (4) Interest income 193 193 (18) (18) Interest expense 220 220 (8) (8) Equity income - net 102 $606 708 (85) (1) Other income (loss) - net 195 ($298) (103) -- -- Income Before Income Taxes 6,578 189 606 (298) 100 7,175 (2) 6 Income taxes 1,498 30 57 8 38 ($24) 1,607 (18) 1 Net Income $5,080 $159 $549 ($306) $62 $24 $5,568 4 7 Diluted Net Income Per Share $2.16 $0.07 $0.23 ($0.13) $0.03 $0.01 $2.37 6 9 Average Shares Outstanding - Diluted 2,350 2,350 2,350 2,350 2,350 2,350 2,350 Gross Margin 66.1% 66.1% Operating Margin 26.2% 27.4% Effective Tax Rate 22.8% 22.4% Year Ended December 31, 2005 Items Impacting Comparability Issuances of Accelerated After Repatriation of Stock by Amortization of Considering Reported Resolution of Foreign Equity Stock-Based Asset Write- Items (GAAP) HFCS Settlement Tax Matters Earnings Investees Compensation Equity Investee downs (Non-GAAP) Net Operating Revenues 23,104 $23,104 Cost of goods sold 8,195 $47 8,242 Gross Profit 14,909 (47) 14,862 Selling, general and administrative expenses 8,739 ($50) 8,689 Other operating charges 85 ($85) - Operating Income 6,085 (47) 50 85 6,173 Interest income 235 235 Interest expense 240 240 Equity income - net 680 $33 4 717 Other income (loss) - net (93) (93) Gain on issuances of stock by equity investees 23 ($23) - Income Before Income Taxes 6,690 (47) (23) 50 33 89 6,792 Income taxes 1,818 (18) $101 ($315) (8) 12 2 4 1,596 Net Income $4,872 ($29) ($101) $315 ($15) $38 $31 $85 $5,196 Diluted Net Income Per Share $2.04 ($0.01) ($0.04) $0.13 ($0.01) $0.02 $0.01 $0.04 $2.17 (5) Average Shares Outstanding - Diluted 2,393 2,393 2,393 2,393 2,393 2,393 2,393 2,393 2,393 Gross Margin 64.5% 64.3% Operating Margin 26.3% 26.7% Effective Tax Rate 27.2% 23.5% Note: Items to consider for comparability include primarily charges, gains, and accounting changes. Charges and accounting changes negatively impacting net income are reflected as increases to reported net income. Gains and accounting changes positively impacting net income are reflected as deductions to reported net income. (1) Primarily related to changes in reserves related to certain tax matters. (2) Net operating revenues excluding structural changes: 2006 2005 % Change Reported net operating revenues $24,088 $23,104 4% Structural changes (460) (779) -- Net operating revenues excluding structural changes $23,628 $22,325 6% (3) Selling, general and administrative expenses excluding items impacting comparability and structural changes: 2006 2005 % Change Reported selling, general and administrative expenses $9,431 $8,739 8% Donation to The Coca-Cola Foundation (100) -- Accelerated amortization of stock-based compensation expense (50) -- Structural changes (130) -- Selling, general and administrative expenses excluding items impacting comparability and structural changes $9,201 $8,689 6% (4) Operating income after considering items impacting comparability for the year ended December 31, 2006 includes a negative currency impact of approximately 1%. Currency neutral operating income growth after considering items impacting comparability is 8%. (5) Per share amounts do not add due to rounding.
- 8. The Company reports its financial results in accordance with U. S. generally accepted accounting principles (GAAP). However, management believes that certain non-GAAP financial measures used in managing the business may provide users of this financial information additional meaningful comparisons between current results and results in prior operating periods. Management believes that these non-GAAP financial measures can provide additional meaningful reflection of underlying trends of the business because they provide a comparison of historical information that excludes certain items that impact the overall comparability. Management also uses these non-GAAP financial measures in making financial, operating and planning decisions and in evaluating the Company's performance. See the Table below for supplemental financial data and corresponding reconciliations to GAAP financial measures for the three months ended March 30, 2007 and March 31, 2006. Non-GAAP financial measures should be viewed in addition to, and not as an alternative for, the Company’s reported results prepared in accordance with GAAP. THE COCA-COLA COMPANY AND SUBSIDIARIES Reconciliation of GAAP to Non-GAAP Financial Measures (UNAUDITED) (In millions except per share data) Three Months Ended March 30, 2007 Items Impacting Comparability % Change - After After Asset Gains on % Change - Considering Considering Impairments/ Equity Sales of Certain Tax Reported Items Reported Items Restructuring Investees Assets Matters (1) (GAAP) (Non-GAAP) (GAAP) (Non-GAAP) Net Operating Revenues $6,103 $6,103 17 17 Cost of goods sold 2,145 ($4) 2,141 24 24 Gross Profit 3,958 4 3,962 13 13 Selling, general and administrative expenses 2,325 2,325 13 13 Other operating charges 6 (6) - -- -- Operating Income 1,627 10 1,637 17 14 (2) Interest income 37 37 (47) (47) Interest expense 71 71 13 13 Equity income - net 20 $73 93 (77) (2) Other income (loss) - net 116 ($137) (21) -- -- Income Before Income Taxes 1,729 10 73 (137) 1,675 17 10 Income taxes 467 2 - (73) ($11) 385 27 5 Net Income $1,262 $8 $73 ($64) $11 $1,290 14 11 Diluted Net Income Per Share $0.54 $0.00 $0.03 ($0.03) $0.00 $0.56 (3) 15 14 Average Shares Outstanding - Diluted 2,321 2,321 2,321 2,321 2,321 2,321 Gross Margin 64.9% 64.9% Operating Margin 26.7% 26.8% Effective Tax Rate 27.0% 23.0% Three Months Ended March 31, 2006 Items Impacting Comparability After Asset Considering Impairments/ Equity Certain Tax Items Reported Restructuring Investee Matters (1) (Non-GAAP) (GAAP) Net Operating Revenues $5,226 $5,226 Cost of goods sold 1,726 1,726 Gross Profit 3,500 3,500 Selling, general and administrative expenses 2,060 2,060 Other operating charges 45 ($45) - Operating Income 1,395 45 1,440 Interest income 70 70 Interest expense 63 63 Equity income - net 86 $9 95 Other income (loss) - net (13) (13) Income Before Income Taxes 1,475 45 9 1,529 Income taxes 369 7 1 ($10) 367 Net Income $1,106 $38 $8 $10 $1,162 Diluted Net Income Per Share $0.47 $0.02 $0.00 $0.00 $0.49 Average Shares Outstanding - Diluted 2,366 2,366 2,366 2,366 2,366 Gross Margin 67.0% 67.0% Operating Margin 26.7% 27.6% Effective Tax Rate 25.0% 24.0% Note: Items to consider for comparability include primarily charges, gains, and accounting changes. Charges and accounting changes negatively impacting net income are reflected as increases to reported net income. Gains and accounting changes positively impacting net income are reflected as deductions to reported net income. (1) Primarily related to changes in reserves related to certain tax matters. (2) Operating income after considering items impacting comparability for the three months ended March 30, 2007 includes a positive currency impact of approximately 3%. Currency neutral operating income growth after considering items impacting comparability is 11% (3) Per share amounts do not add due to rounding.
- 9. The Company reports its financial results in accordance with U. S. generally accepted accounting principles (GAAP). However, management believes that certain non- GAAP financial measures used in managing the business may provide users of this financial information additional meaningful comparisons between current results and results in prior operating periods. Management believes that these non-GAAP financial measures can provide additional meaningful reflection of underlying trends of the business because they provide a comparison of historical information that excludes certain items that impact the overall comparability. Management also uses these non-GAAP financial measures in making financial, operating and planning decisions and in evaluating the Company's performance. See the Table below for supplemental financial data and corresponding reconciliations to GAAP financial measures for the three months ended June 29, 2007 and June 30, 2006. Non-GAAP financial measures should be viewed in addition to, and not as an alternative for, the Company’s reported results prepared in accordance with GAAP. THE COCA-COLA COMPANY AND SUBSIDIARIES Reconciliation of GAAP to Non-GAAP Financial Measures (UNAUDITED) (In millions except per share data) Three Months Ended June 29, 2007 Items Impacting Comparability % Change - After After Asset Gains on % Change - Considering Considering Impairments/ Equity Sales of Certain Tax Reported Items Reported Items Restructuring Investees Assets Matters (1) (GAAP) (Non-GAAP) (GAAP) (Non-GAAP) Net Operating Revenues $7,733 $7,733 19 (2) 19 Cost of goods sold 2,736 ($6) 2,730 30 29 Gross Profit 4,997 6 5,003 14 15 Selling, general and administrative expenses 2,685 2,685 17 17 Other operating charges 42 (42) - -- -- Operating Income 2,270 48 2,318 11 12 (3) Interest income 54 54 15 15 Interest expense 102 102 62 62 Equity income - net 190 $89 279 (25) 21 Other income (loss) - net (4) $1 (3) -- -- Income Before Income Taxes 2,408 48 89 1 2,546 1 12 Income taxes 557 12 26 - ($30) 565 0 3 Net Income $1,851 $36 $63 $1 $30 $1,981 1 14 Diluted Net Income Per Share $0.80 $0.02 $0.03 $0.00 $0.01 $0.85 (4) 3 15 Average Shares Outstanding - Diluted 2,326 2,326 2,326 2,326 2,326 2,326 Gross Margin 64.6% 64.7% Operating Margin 29.4% 30.0% Effective Tax Rate 23.1% 22.2% Three Months Ended June 30, 2006 Items Impacting Comparability After Asset Considering Impairments/ Equity Transaction Certain Tax Reported Items Restructuring Investee Gains Matters (1) (GAAP) (Non-GAAP) Net Operating Revenues $6,476 $6,476 Cost of goods sold 2,110 2,110 Gross Profit 4,366 4,366 Selling, general and administrative expenses 2,296 2,296 Other operating charges 31 ($31) - Operating Income 2,039 31 2,070 Interest income 47 47 Interest expense 63 63 Equity income - net 252 ($21) 231 Other income (loss) - net 116 ($123) (7) Income Before Income Taxes 2,391 31 (21) (123) 2,278 Income taxes 555 1 (2) 14 ($22) 546 Net Income $1,836 $30 ($19) ($137) $22 $1,732 Diluted Net Income Per Share $0.78 $0.01 ($0.01) ($0.06) $0.01 $0.74 (4) Average Shares Outstanding - Diluted 2,352 2,352 2,352 2,352 2,352 2,352 Gross Margin 67.4% 67.4% Operating Margin 31.5% 32.0% Effective Tax Rate 23.2% 24.0% Note: Items to consider for comparability include primarily charges, gains, and accounting changes. Charges and accounting changes negatively impacting net income are reflected as increases to reported net income. Gains and accounting changes positively impacting net income are reflected as deductions to reported net income. (1) Primarily related to changes in reserves related to certain tax matters. (2) Net operating revenues excluding structural changes: 2007 2006 % Change Reported net operating revenues $7,733 $6,476 19% Structural changes (474) -- -- Net operating revenues excluding structural changes $7,259 $6,476 12% (3) Operating income after considering items impacting comparability for the three months ended June 29, 2007 includes a positive currency impact of approximately 3%. Currency neutral operating income growth after considering items impacting comparability is 9%. (4) Per share amounts do not add due to rounding.