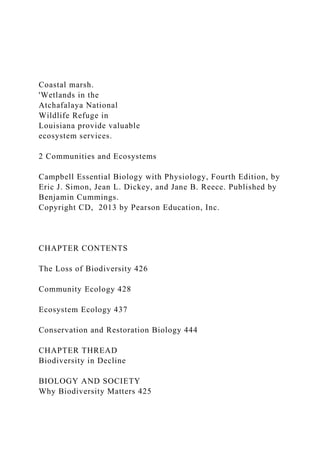
Coastal marsh.
'Wetlands in the
Atchafalaya National
Wildlife Refuge in
Louisiana provide valuable
ecosystem services.
2 Communities and Ecosystems
Campbell Essential Biology with Physiology, Fourth Edition, by Eric J. Simon, Jean L. Dickey, and Jane B. Reece. Published by Benjamin Cummings.
Copyright CD, 2013 by Pearson Education, Inc.
CHAPTER CONTENTS
The Loss of Biodiversity 426
Community Ecology 428
Ecosystem Ecology 437
Conservation and Restoration Biology 444
CHAPTER THREAD
Biodiversity in Decline
BIOLOGY AND SOCIETY
Why Biodiversity Matters 425
THE PROCESS OF SCIENCE
How Does Tropical Forest Fragmentation
Affect Biodiversity? 446
EVOLUTION CONNECTION
Can Biophilia Save Biodiversity? 448
Biodiversity in Decline BIOLOGY AND SOCIETY
Why Biodiversity Matters
As the human population has expanded, hundreds of species have become extinct and thou-
sands more are threatened with extinction. These changes represent a loss in biological di-
versity, or biodiversity. Biodiversity loss goes hand in hand with the disappearance of natural
ecosystems. Only about a quarter of Earth's land surfaces remain untouched by human altera-
tions. We see the evidence of our impact on natural ecosystems every day. We live and work
in altered landscapes. And though we may be less aware of it, our impact on the oceans is also
extensive.
What is the value of biodiversity? Most people appreciate the direct benefits provided by
certain ecosystems. For example, you probably know that we use resources—such as water,
wood, and fish—that come from natural or near-natural ecosystems. These resources have
economic value, as the massive 2010 oil spill in the Gulf of Mexico dramatically demonstrated.
Billions of dollars were lost by fishing, recreation, and other industries as a result of the di-
saster. But human well-being also depends on less obvious services that healthy ecosystems
provide. The coastal wetlands affected by the Gulf oil spill normally act as a buffer against hur-
ricanes, reduce the impact of flooding, and filter pollutants. The wetlands also furnish nesting
sites for birds and marine turtles and breeding areas and nurseries for a wide variety of fish
and shellfish. Natural ecosystems provide other services as well—such as recycling nutrients,
preventing erosion and mudslides, controlling agricultural pests, and pollinating crops. Some
scientists have attempted to assign an economic value to these benefits. They arrived at an
average annual value of ecosystem services of $33 trillion, almost twice the global gross
national product for the year they published their results. Although rough, these estimates
make the important point that we cannot afford to take biodiversity for granted.
In this chapter, we'll examine the interactions among organisms and how those relation-
ships determine the features of communities. On a larger scale, we'll explore the dynamics
of ecosystems. Finally, we'll consi.
Biodiversity and Land Quality Essay
Why Is Ocean Biodiversity Important
Essay On Endangered Plants
Big Idea Biodiversity
biodiversity Essay
Biodiversity Loss And Loss Of Habitat Loss
Biodiversity And Biodiversity
Biodiversity And Its Effects On Biodiversity
Reflection Essay On Biodiversity
Biodiversity And Its Impact On Biodiversity
Biodiversity, Or Biological Diversity
Essay on Biodiversity
Biodiversity, Or Biological Diversity
Paragraph On Conservation Of Biodiversity
Marine Biodiversity : A Global Pattern Essay
Biodiversity In Australia
Persuasive Essay On Biodiversity Conservation
Biodiversity
Essay about The Importance of Biodiversity
Lab Report Biodiversity
Biological diversity or biodiversity is the degree of variation of life forms at all levels of biological systems (i.e. molecular, organism, species, population and ecosystem levels) and is used to measure the health of ecosystems.
Despite the numerous benefits and advantages gotten from biodiversity, it is under serious threat as a result of human activities. The main dangers worldwide are population growth and resource consumption, climate change and global warming, habitat conversion and urbanization, invasive alien species, over-exploitation of natural resources and environmental degradation.
Marine Biodiversity : A Global Pattern Essay
Biodiversity And Biodiversity
Big Idea Biodiversity
Biodiversity And Its Impact On Biodiversity
biodiversity Essay
Biodiversity
Biological Diversity
The Importance Of Biodiversity
Essay about The Importance of Biodiversity
Essay On Endangered Plants
Persuasive Essay On Biodiversity Conservation
Reflection Essay On Biodiversity
Biodiversity Loss And Loss Of Species Essay
Biodiversity And Its Effects On The Environment
Essay on Biodiversity
The Study of Biodiversity
Biodiversity And Its Effects On Biodiversity
Biological Diversity Essay
The Importance of Biodiversity
Environmental conservation Essay example
Persuasive Essay On Rights Of Nature
Essay Arguments for Environmental Conservation
Speech On Wildlife Conservation
Wildlife Conservation Essay
Reflection Paper On Nature
Conservation Ethic Research Paper
Paragraph On Conservation Of Biodiversity
Animal Conservation Essay
Persuasive Essay On Biodiversity Conservation
The Conservation of the Environment
1. Discuss Blockchains potential application in compensation system.docxmonicafrancis71118
1. Discuss Blockchain's potential application in compensation systems (base wages, incentives, rewards).
2. How can a token economy affect employee compensation?
3. Based on your readings, do worldwide executives believe Blockchain has the potential to radical change the future of organizations?
.
1. Describe the characteristics of the aging process. Explain how so.docxmonicafrancis71118
1. Describe the characteristics of the aging process. Explain how some of the characteristics may lead to elder abuse (memory issues, vulnerability, etc.). Discuss the types of consideration a nurse must be mindful of while performing a health assessment on a geriatric patient as compared to a middle-aged adult.
2.
End-of-life care becomes an issue at some point for elderly clients. Even with the emergence of palliative care programs and hospice programs, most elderly people do not die in their own home as is their preference. What are the reasons for this trend? Discuss what you can do as a nurse to support your clients regarding end-of-life care in accordance with their wishes. Support your response with evidence-based literature.
.
1. Dis. 7Should we continue to collect data on race and .docxmonicafrancis71118
1. Dis. 7
Should we continue to collect data on race and ethnicity?
Topic
In what situations should we continue collecting data on race and ethnicity, and in what situations should we stop collecting data on race and ethnicity? (see Desmond & Emirbayer)
2. Jour. 7
We determine whether our society is "colorblind." Our objectives this week are to:
· Describe colorblind racism and new racism;
· Discuss social policy implications of erroneous beliefs that we live in a post-racial or colorblind society; and
· Summarize the perception gap between majority and minority groups and how that impacts support for public policy aimed at combating racial inequality.
Please read all the information provided within the module and the indicated course book readings, then proceed to complete and submit this week's assignments in a timely and effective manner.
Due Thursday
Both 200 each words
.
More Related Content
Similar to Coastal marsh. Wetlands in the Atchafalaya National Wil.docx
Despite the numerous benefits and advantages gotten from biodiversity, it is under serious threat as a result of human activities. The main dangers worldwide are population growth and resource consumption, climate change and global warming, habitat conversion and urbanization, invasive alien species, over-exploitation of natural resources and environmental degradation.
Marine Biodiversity : A Global Pattern Essay
Biodiversity And Biodiversity
Big Idea Biodiversity
Biodiversity And Its Impact On Biodiversity
biodiversity Essay
Biodiversity
Biological Diversity
The Importance Of Biodiversity
Essay about The Importance of Biodiversity
Essay On Endangered Plants
Persuasive Essay On Biodiversity Conservation
Reflection Essay On Biodiversity
Biodiversity Loss And Loss Of Species Essay
Biodiversity And Its Effects On The Environment
Essay on Biodiversity
The Study of Biodiversity
Biodiversity And Its Effects On Biodiversity
Biological Diversity Essay
The Importance of Biodiversity
Environmental conservation Essay example
Persuasive Essay On Rights Of Nature
Essay Arguments for Environmental Conservation
Speech On Wildlife Conservation
Wildlife Conservation Essay
Reflection Paper On Nature
Conservation Ethic Research Paper
Paragraph On Conservation Of Biodiversity
Animal Conservation Essay
Persuasive Essay On Biodiversity Conservation
The Conservation of the Environment
1. Discuss Blockchains potential application in compensation system.docxmonicafrancis71118
1. Discuss Blockchain's potential application in compensation systems (base wages, incentives, rewards).
2. How can a token economy affect employee compensation?
3. Based on your readings, do worldwide executives believe Blockchain has the potential to radical change the future of organizations?
.
1. Describe the characteristics of the aging process. Explain how so.docxmonicafrancis71118
1. Describe the characteristics of the aging process. Explain how some of the characteristics may lead to elder abuse (memory issues, vulnerability, etc.). Discuss the types of consideration a nurse must be mindful of while performing a health assessment on a geriatric patient as compared to a middle-aged adult.
2.
End-of-life care becomes an issue at some point for elderly clients. Even with the emergence of palliative care programs and hospice programs, most elderly people do not die in their own home as is their preference. What are the reasons for this trend? Discuss what you can do as a nurse to support your clients regarding end-of-life care in accordance with their wishes. Support your response with evidence-based literature.
.
1. Dis. 7Should we continue to collect data on race and .docxmonicafrancis71118
1. Dis. 7
Should we continue to collect data on race and ethnicity?
Topic
In what situations should we continue collecting data on race and ethnicity, and in what situations should we stop collecting data on race and ethnicity? (see Desmond & Emirbayer)
2. Jour. 7
We determine whether our society is "colorblind." Our objectives this week are to:
· Describe colorblind racism and new racism;
· Discuss social policy implications of erroneous beliefs that we live in a post-racial or colorblind society; and
· Summarize the perception gap between majority and minority groups and how that impacts support for public policy aimed at combating racial inequality.
Please read all the information provided within the module and the indicated course book readings, then proceed to complete and submit this week's assignments in a timely and effective manner.
Due Thursday
Both 200 each words
.
1. Differentiate crisis intervention from other counseling therapeut.docxmonicafrancis71118
1. Differentiate crisis intervention from other counseling therapeutic interventions. Provide examples to support your rationale. For follow-up discussion, critique the examples provided by your peers for validity.
2. Is the use of standard psychotherapeutic interventions appropriate during a crisis? Why or why not?
.
1. Describe the ethical challenges faced by organizations operating .docxmonicafrancis71118
1. Describe the ethical challenges faced by organizations operating globally. 550 words .
2. Pick one of the following terms for your research: code of ethics, conscious capitalism, corporate social responsibility (CSR), culture, ethical dilemma, external adaptation, mission culture, social capital, values-based leadership, or whistle-blowing. 500 words
.
1. Describe in your own words the anatomy of a muscle. This sho.docxmonicafrancis71118
1. Describe in your own words the anatomy of a muscle. This should include from the muscle down to the myofibrils.
2. Explain in your own words how an action potential results in a muscle contraction.
3. List and describe in your own words the characteristics of skeletal muscle (aka the abilities that a skeletal muscle has).
4. Muscle Tissue
: Describe the appearance of the three types of muscle tissue.
a. Skeletal muscle:
b. Cardiac muscle:
c. Smooth muscle:
5. Muscle Anatomy
: Put the structures in anatomical order from superficial to deep.
Sarcolemma
Perimysium
Endomysium
Epimysium
6. Muscle Identification
: Palpate or locate each of the following muscles and list its origin, insertion, and action.
a. Masseter
b. Upper, middle, and lower trapezius
c. Sternocleidomastoid
d. Temporalis
e. Occipitofrontalis
f. Erector spinae
g. Scalenes
h. External/internal intercostalis
i. Rectus abdominis
j. External/internal oblique
k. Transverse abdominis
l. Rhomboids
m. Serratus anterior
n. Pectoralis major and minor
o. Teres major and minor
p. Latissimius Dorsi
q. Infraspinatus
r. Suprasinatus
s. Subscapularis
t. Deltoid
u. Triceps brachii
v. Biceps brachii
w. Brachialis
x. Brachioradialis
y. Wrist and finger flexors
z. Wrist and finger extensors
aa. Iliopsoas
bb. Tensor fasciae latae
cc. Gluteus maximus
dd. Gluteus medius
ee. Quadriceps
ff. Hamstrings
gg. Sartorius
hh. Adductor longus
ii. Gracilis
jj. Tibialis anterior
kk. Gastrocnemius
ll. Soleus
mm. Peroneals
.
1. Describe how your attitude of including aspects of health literac.docxmonicafrancis71118
1. Describe how your attitude of including aspects of health literacy changed during this course.
2. Describe your approach to incorporating evidence-based literature in health teaching.
3. Describe one theory of teaching or learning that you applied it to your power point presentation.
4. Describe two ways that you have grown as a health educator by taking health promotion course
.
1. Choose a behavior (such as overeating, shopping, Internet use.docxmonicafrancis71118
1. Choose a behavior (such as overeating, shopping, Internet use, etc.) Identify examples of each of the stages of change—pre-contemplation through maintenance—using the behavior you selected as the focus.
2. What are your thoughts on using the readiness assessment tool for addictive behaviors?
What is the stage of readiness in each of these areas for Brian and/or Alyssa?
Need for change
Commitment to change
Self-awareness
Environmental awareness
Personal closeness
Identify a possible next step in the process for the individual you selected that you feel will assist them in their readiness for change.
Be sure to rate each of the readiness assessment areas. Your next steps should be appropriate to the data you discuss in the readiness assessment.
see attachment:
.
1. Case 3-4 Franklin Industries’ Whistleblowing (a GVV Case)Natali.docxmonicafrancis71118
1. Case 3-4 Franklin Industries’ Whistleblowing (a GVV Case)
Natalie got the call she had been waiting for over six long months. Her complaint to the human resources department of Franklin Industries had been dismissed. It was HR’s conclusion that she was not retaliated against for reporting an alleged embezzlement by the Accounting Department manager. In fact, HR ruled there was no embezzlement at all. Natalie had been demoted from assistant manager of the department to staff supervisor seven months ago after informing Stuart Masters, the controller, earlier in 2015, about the embezzlement. Her blood started to boil as she thought about all the pain and agony she’d experienced these past six months without any level of satisfaction for her troubles.
Natalie Garson is a CPA who works for Franklin Industries, a publicly owned company and manufacturer of trusses and other structural components for home builders throughout the United States. Six months ago she filed a complaint with HR after discussing a sensitive matter with her best friend and coworker, Roger Harris. Natalie trusted Harris, who had six years of experience at Franklin. The essence of the discussion was that Natalie was informed by the accounting staff of what appeared to be unusual transactions between Denny King, the department manager, and an outside company no one had never heard of before. The staff had uncovered over $5 million in payments, authorized by King, to Vic Construction. No one could find any documentation about Vic, so the staff dug deeper and discovered that the owner of Vic Construction was Victoria King. Further examination determined that Victoria King and Denny King were siblings.
Once Natalie was convinced there was more to the situation than meets the eye, she informed the internal auditors, who investigated and found that Vic Construction made a $5 million electronic transfer to a separate business owned by Denny King. One thing lead to another, and it was determined by the internal auditors that King had funneled $5 million to Vic Construction, which, at a later date, transferred the money back to King. It was a $5 million embezzlement from Franklin Industries.
Natalie met with Roger Harris that night and told him about the HR decision that went against her. She was concerned whether the internal auditors would act now in light of that decision She knew the culture at Franklin was “don’t rock the boat.” That didn’t matter to her. She was always true to her values and not afraid to act when a wrongdoing had occurred. She felt particularly motivated in this case—it was personal. She felt the need to be vindicated. She hoped Roger would be supportive.
As it turned out, Roger cautioned Natalie about taking the matter any further. He had worked for Franklin a lot longer than Natalie and knew the board of directors consisted mostly of insider directors. The CEO of Franklin was also the chair of Page 181the board. It was well known in the company that whatev.
1. Cryptography is used to protect confidential data in many areas. .docxmonicafrancis71118
1. Cryptography is used to protect confidential data in many areas. Chose one type of cryptography attack and briefly explain how it works (examples include: ciphertext-only attack, known-plain-test attack, chosen-plaintext, chosen-ciphertext attack, timing attack, rubber hose attack, adaptive attack).
2. Select one type of cryptography or encryption and explain it in detail. Include the benefits as well as the limitations of this type of encryption. Your summary should be 2-3 paragraphs in length and uploaded as a TEXT DOCUMENT
.
1. Compare and contrast steganography and cryptography.2. Why st.docxmonicafrancis71118
1. Compare and contrast steganography and cryptography.
2. Why steganography and how does it work? List examples of suitable carriers of steganographic payloads.
3. Experiment with the tool – Steganography Online (http://stylesuxx.github.io/steganography/) to get a feel of how the steganographic tool works.
4. In steganalysis, which methods are used to detect steganography?
Briefly describe how cryptography is applied in ATM, SSL, digital signatures, hashes and drive encryption.
.
1. Date September 13, 2017 – September 15, 2017 2. Curr.docxmonicafrancis71118
1. Date: September 13, 2017 – September
15, 2017
2. Current Exchange Rate ($ / rupee):
1/64.16
3. During the past week (or since your last entry), what has been the major economic or
business news relating to
India? http://www.thehindu.com/business/Industry/economy-suffers-as-firms-tackle-
debt/article19677814.ece
In India this year, there are a fair amount of firms and businesses that are having issues paying off
interest on their loans. On top of this, fewer loans are happening and the state’s GDP growth rate has
lowered this year. The article lists several factors, one of which is pretty simple; interest rates are high
at the moment. This article on business interested me because this is an issue that is relatable to every
modernized country on Earth, how to pay off debt when you aren’t making enough this year to cover
costs? You can’t, so the unpaid portions add up. I didn’t feel like there was a strong bias in this article,
but I’m also not accustomed to the Indian financial market or its businesses. How is this story relevant
to my understanding of India? It lets me take an inside look at the current economy and how they might
be fairing in comparison. It also shows that business and banking policies are not that different on some
levels.
4. During the past week (or since your last entry), what has been the major political
news in India? http://www.thehindu.com/news/national/andhra-pradesh/patronising-congress-
again-a-historic-necessity/article19679153.ece
First, why do I consider this major political news in India? The discussions and accusations being talked
about in the article are serious and can definitely effect votes for the mentioned political parties, which
in turn can change or add new laws, regulations, taxes, and etc. The title seemed incredibly familiar to
what we always see in American newspapers about our politics. I felt that the author, or maybe the
newspaper, might actually lean more towards the BJP and TDP’s opposing forces. Other than that, there
were tons of biased quotes from both parties. So, why do I think this topic is relevant to my
understanding of India? Simply put, just as with business and banking, there is this kind of familiarity in
a way. This article lets me get an inside view on the current parties and the accusations being made,
showing me that politics is a somewhat universal language, one part attack ads, one part confusion, and
one part progress.
5. What new information have you found related to religion in
India?http://www.thehindu.com/society/faith/tendencies-of-
prakriti/article19656107.ece
We talked a lot about how the culture of India and the religions of it can definitely be intertwined. This
short article tells of the three ‘gunas’, which I didn’t know much about if anything really. As far as biases
go, you could say that the article is biased to what it is teaching about this religious aspect, but honestly,
it feels more informative. Why is thi.
1. compare and contrast predictive analytics with prescriptive and d.docxmonicafrancis71118
1. compare and contrast predictive analytics with prescriptive and descriptive analytics. Use examples. (250 words and two references no plagiarism)
2. Discuss the process that generates the power of AI and discuss the differences between machine learning and deep learning.(250 words and two references no plagiarism)
.
1. Creating and maintaining relationships between home and schoo.docxmonicafrancis71118
1. Creating and maintaining relationships between home and school are pivotal to the overall success of our ELL students. Discuss some ways you might cultivate these partnerships throughout the school year.
2. There is research supporting the theory that students who are literate in their home language are more likely to be literate in their second or subsequent language. Thinking of this, what are the potential effects of home language on the development of English and classroom learning?
.
1. Compare and contrast Strategic and Tactical Analysis and its .docxmonicafrancis71118
1. Compare and contrast Strategic and Tactical Analysis and its application to street crimes such as robbery and property crimes such as burglary. In your opinion is one more suited in addressing criminal behavior?
Strategic analysis involves the analysis over the long-term, whereas tactical analysis involves analysis in a more direct manner. Each has analysis scheme has their uses in addressing criminal behavior. To use an example with drug activity strategic analysis would be better suited to understanding who could be the future customers of drug dealers, where are possible locations that could facilitate such deals, and helping law-enforcement and community leaders come up with measures to combat drug sales. However, the tactical analysis would focus more on finding out where the current supply of drugs is coming in from, who the leader(s) is(are), and cracking down on local dealers. While there is overlap between the two, I believe that tactical analysis is the best when addressing criminal behavior, because of the more immediate results that it provides.
2. What is CPTED? Please elaborate on how CPTED may be an effective means to reduce a criminals Modus operandi? Provide an example.
CPTED is an acronym that stands for crime prevention through environmental design which is “The proper design and effective use of the built environment can lead to a reduction in the fear and incidence of crime, and an improvement in the quality of life” (Cozens, Saville, & Hillier, 2005). This means that CPTED is all of the passive defenses that the environment provides law-abiding citizens against criminally minded individuals. These defenses can be broken down into six different aspects that work together to create CPTED they are: territoriality, surveillance, access control, target hardening, image/maintenance, and active support (Cozens, Saville, & Hillier, 2005). All of these aspects work together to decrease crime in the area.
respond to this discussion question in 250 words
.
1. Coalition ProposalVaccination Policy for Infectious Disease P.docxmonicafrancis71118
1. Coalition Proposal
Vaccination Policy for Infectious Disease Prevention and Control
Scope of the Problem
Vaccines have done an excellent job at preventing many diseases, some of which can be deadly if not prevented. When bacteria or viruses enter the body, they immediately begin to attack and multiply, which then causes an infection. The immune system will then fight off the infection and establish antibodies, which will help recognize and fight off the same disease in the future. For this very reason, it has been important for children to be vaccinated at an early age so that they may establish those antibodies their bodies need. Vaccines act as the disease so that the body may produce antibodies, but the good thing is that it won’t cause an infection (CDC, 2017).
There are current policies that mandate vaccinations in the U.S., for example, all children are required to be up to date on their vaccines before beginning school. The problem is that there are many loopholes and exceptions to the rule, whether it’s due to religious reasons or other medical issues. Because of this, there are still many children and adults who have yet to be fully compliant with vaccine requirements
Some important statistics to note (Johns Hopkins Medicine):
· CDC estimated 2,700 new cases of hepatitis A in the U.S.
· It is estimated that in 2011, 19,000 new cases of hepatitis B and 17,000 cases of hepatitis C occurred.
· In 2012, nearly 10,000 new cases of tuberculosis were reported.
· Approximately 36,000 people per year die from influenza and pneumonia.
· 50,000 new cases of HIV infection occur annually.
· In 2012, new cases of STD’s were reported, including HPV, Chlamydia, Gonorrhea, HIV, and Syphilis.
Who is affected by this problem? Identify.
Children are mainly affected by this problem due to parents’ hesitancy for vaccinations. Although law mandates for children to be vaccinated for school enrollment, parents have the option to use exemptions to avoid having their children vaccinated. Currently, medical exemptions are allowed for medical reasons in all states, and it is estimated that one to three percent of children are excused from vaccinations because of these exemptions. Parents have continued to use reasons to avoid vaccinations, for example, the belief that the decline in vaccine-preventable diseases is due to improved health care, hygiene, and sanitation (Ventola, C. L., 2016).
Health disparities among Blacks, Hispanics, and Whites have played a huge role in terms of vaccination coverage. Studies have shown that health insurance has a direct impact on the vaccination coverage in adults, therefore, low-income families who can’t afford health insurance will most likely not get the vaccines they need. With that being said, uninsured prevalence was higher among non-Hispanic blacks (19.5%) and Hispanics (30.1%) compared with non-Hispanic whites (11.1%) (Lu, P., et al, 2015).
What has been written on the issue and policy options?
There ha.
1. Company Description and Backgrounda. Weight Watchers was cr.docxmonicafrancis71118
1. Company Description and Background
a. Weight Watchers was created by Jean Nindetch in 1963 when she began to invite her friends and neighbors so that they can discuss their weight loss issues and how they could lose weight successfully. The basic concept of WW plan consisted of two components: the WW program and group support. Comprised of a food plan and an activity plan. WW eliminated counting calories by introducing a point system.
b. Targeted women 25 to 55
c. 2017 about 1 million members who attended 32,000 WW meetings around the world organized by more then 9,000 leaders who had successful lost weight using WW.
d. Record high revenue 2011 $1.8 billion, in 2012 a slight reduction occurred but beat all pre-2011 numbers, in 2013 is when business began take a turn for the worse.
e. December 2015, WW launched a SmartPoints system which was a scale for food management. It was introduced to work along with a new weight management program called “Beyond the Scale.” Even thought doctors and nutrition’s approved the program, then-CEO David Kirchhoff felt it wasn’t enough because the programs didn’t take into account social, environmental and behavioral factors that led members to fail at their weight loss journey. Shortly after in August 2013, CEO Kirchhoff resigned in order to “pursue other opportunities” which left WW struggling to adjust their business strategy in the Internet Age.
2. Problems Posed In The Case
a. CEO Jim Chambers resigned in September 2016 afterward a tumultuous year with stock prices dropping 54% that year alone and seven straight quarters of declining sales.
b. Next generation diet programs and online apps like MyFitnessPal and FitBit were providing the same services for free of charge. CEO Chambers admitted that “consumers have changed and that WW hadn’t kept the pace.”
c. As obesity levels increased worldwide, the market for weight loss products was growing exponentially, however, WW had to increase customer value and seek new target segments to fend off competitors from traditional rivalry’s like Nutrisystem, Slim Fast, Medifast, Jenny Craig and the Biggest Loser.
d. Emergence of fad diets
e. Decreased effectiveness of marketing and advertising programs
f. The need for developing new and innovative products and services that could be delivered online or via mobile apps
g. WW International faced stock price volatility because of rival weight management options such as the over-the-counter weight-loss drug Alli launched by GlaxoSmithKline in June 2006 and the development of Allergan’s Lap-Band device.
h. Worldwide Health Organization estimated 2.3 billion people to be overweight by 2015 and more than 700 million obese.
i. The development of effective weight-management methods i.e. pharmaceuticals, surgical options such as the Lap-Band.
3. Financial Analysis
a. In 2017, revenue was 1.3 billion and in 2018 revenue was up by 5.77% at 1.5 billion.
4. Strategic Options
a. During the dot-com era they creat.
1. Come up with TWO movie ideas -- as in for TWO screenplays that .docxmonicafrancis71118
1. Come up with TWO movie ideas -- as in for TWO screenplays that you'd be interested in writing.
You will eventually choose ONE screenplay to live with for the duration of this course. You will distill each idea into a single sentence. We call this a LOGLINE.
A good logline: 1. Must include your PROTAGONIST. 2. Must be under 50 words. 3. Must contain the word "BUT" ("but" signifies conflict).
After you write the logline. Tell us about your PROTAGONIST. What is her/his most pressing DESIRE? What are some of the potential OBSTACLES that can get in the way?
TRY TO KEEP IT SIMPLE!
Here's an example:
MOVIE IDEA #1
WORKING TITLE: "COLLATERAL"
LOGLINE: A cab driver dreams of starting his own limo company, BUT when a hitman gets into his cab, our hero must figure out how to survive the night.
PROTAGONIST: Max (Cab Driver)
DESIRE: To stop Vincent (the Hitman)
POTENTIAL OBSTACLES: The HITMAN who never fails. THE COPS who think Max is the hitman. THE GANGSTERS who want the hitman dead. MAX’s own timid and hesitant nature.
2.What is the INCITING INCIDENT in your two film ideas? What is the 1stACT BREAK?
Example:
MOVIE TITLE: COLLATERAL
INCITING INCIDENT: Vincent gets into Max’s cab, makes Max an offer
1STACT BREAK: Body drops on Max’s cab; Reveal Vincent is a Hitman
(To discover your inciting incident possibly contemplate what the worst thing that could happen to your particular character would be)
Interview questions
1. Do you have a specific reason why you wanted to become a physical therapist?
2. Why do think it’s a good idea to be a physical therapist?
3. What did you get your bachelor degree on?
4. Were you in any kind of program for PT?
5. What kind of opportunities were there for you after getting your bachelor degree?
6. What were some of the difficulties you faced when you were looking for jobs?
7. What are some things I should know before I continue?
8. What are some jobs that I can apply to, to get experience with what a want to pursue?
9. How long did it take you to finish school and start your job?
10. What are some skills a person should have that wants to do DPT?
Unal 2
Seyma Unal
English 101 Z02N
Ms. Claytor
24 June 2019
Isabella Mia Interview as a Physical Therapist
Isabella Mia is a physical therapist who is working in the US as a therapist for the last 10 years. I have selected her for the interview because the physical therapist is a tough job and it is important to consider a person who has worked in it for a long time to get the right insights. She is a very dedicated person towards her work and this the reason behind her success in this field. I met her for this interview on a coffee shop and following is the information that I got from her.
Seyma Unal : Do you have a specific reason why you wanted to become a physical therapist?
Isabella Mia : I believe that this is a very rewarding career. I always wanted to do something that can ease other people and in this profession, we have contact with customers .
1. Choose a case for the paper that interests you. Most choose a .docxmonicafrancis71118
1. Choose a case for the paper that interests you. Most choose a case that they experienced on the job (e.g., company merger, reorganization, adoption of innovation or new procedure). If you have never experienced anything remotely like this, then you could choose a case in your community that interested you (e.g., political issues like taxes, land acquisition, school boards). If none of those apply then you can choose a case that is personal to you (e.g., getting a raise, selling something to a client or customer). If you have never worked, then choose a case you may experienced as an intern or student. I am pretty liberal about the kind of case that you choose.
2. Choose a case that involved a failed change attempt or proposes a change that has never been attempted. DO NOT CHOOSE A CASE THAT WAS SUCCESSFUL. The outline is hard to use when describing successful change attempts.
3. Write the paper as an expanded outline. That means writing paragraphs under the lower level headings. By using the outline as headings, you won’t leave something out.
4. With regard to length, some overwrite Section I. I think they get into describing the problem and go on a tirade. Although cathartic, it eats space. Section II should be relatively brief and the shortest of the three sections. Section III is where you should be writing a lot. That is where you are showing me that you can use the course content to propose an effective change.
5. Remember that you will be sending the paper to me as an attachment. I will grade it and make comments in the file. I will return it to you at the SAME address from which I received it. IF FOR SOME REASON, YOU DON’T WANT ANYONE TO SEE THE PAPER, USE YOUR STUDENT EMAIL ADDRESS. DO NOT USE YOUR WORK ADDRESS.
6. I will erase all papers at the end of the term. I never share papers with others.
Below I will give you some insights into the outline.
SUGGESTED OUTLINE FOR CHANGE MANAGEMENT PAPERS
I. Statement of problem area. In this section, describe the change attempt and the key players.
A. Background of change attempt.
1. Nature of change (What is being proposed?).
In this section, provide an overview of the change including a brief history.
2. Issues (Why is it being proposed?).
If you are writing about a failed change, indicate why it was proposed and how it failed. If you are writing about a proposed change, then describe the problem it is intended to resolve.
3. Change Agent(s). This section is focused on the people who proposed or will propose the change. If there are only a few change agents, you can describe what each on is like. If you are there many, then describe their general characteristics.
4.
A. Personality. What are they like? If you want, you can refer to the personalities I mention in the handout on integrative bargaining.
B. Power. What kind of power do the change agents have and how much? Is their power formal (e.g., authority) and/or or informal (e.g., expertise, chari.
Francesca Gottschalk - How can education support child empowerment.pptxEduSkills OECD
Francesca Gottschalk from the OECD’s Centre for Educational Research and Innovation presents at the Ask an Expert Webinar: How can education support child empowerment?
Welcome to TechSoup New Member Orientation and Q&A (May 2024).pdfTechSoup
In this webinar you will learn how your organization can access TechSoup's wide variety of product discount and donation programs. From hardware to software, we'll give you a tour of the tools available to help your nonprofit with productivity, collaboration, financial management, donor tracking, security, and more.
Macroeconomics- Movie Location
This will be used as part of your Personal Professional Portfolio once graded.
Objective:
Prepare a presentation or a paper using research, basic comparative analysis, data organization and application of economic information. You will make an informed assessment of an economic climate outside of the United States to accomplish an entertainment industry objective.
Biological screening of herbal drugs: Introduction and Need for
Phyto-Pharmacological Screening, New Strategies for evaluating
Natural Products, In vitro evaluation techniques for Antioxidants, Antimicrobial and Anticancer drugs. In vivo evaluation techniques
for Anti-inflammatory, Antiulcer, Anticancer, Wound healing, Antidiabetic, Hepatoprotective, Cardio protective, Diuretics and
Antifertility, Toxicity studies as per OECD guidelines
Introduction to AI for Nonprofits with Tapp NetworkTechSoup
Dive into the world of AI! Experts Jon Hill and Tareq Monaur will guide you through AI's role in enhancing nonprofit websites and basic marketing strategies, making it easy to understand and apply.
Operation “Blue Star” is the only event in the history of Independent India where the state went into war with its own people. Even after about 40 years it is not clear if it was culmination of states anger over people of the region, a political game of power or start of dictatorial chapter in the democratic setup.
The people of Punjab felt alienated from main stream due to denial of their just demands during a long democratic struggle since independence. As it happen all over the word, it led to militant struggle with great loss of lives of military, police and civilian personnel. Killing of Indira Gandhi and massacre of innocent Sikhs in Delhi and other India cities was also associated with this movement.
June 3, 2024 Anti-Semitism Letter Sent to MIT President Kornbluth and MIT Cor...Levi Shapiro
Letter from the Congress of the United States regarding Anti-Semitism sent June 3rd to MIT President Sally Kornbluth, MIT Corp Chair, Mark Gorenberg
Dear Dr. Kornbluth and Mr. Gorenberg,
The US House of Representatives is deeply concerned by ongoing and pervasive acts of antisemitic
harassment and intimidation at the Massachusetts Institute of Technology (MIT). Failing to act decisively to ensure a safe learning environment for all students would be a grave dereliction of your responsibilities as President of MIT and Chair of the MIT Corporation.
This Congress will not stand idly by and allow an environment hostile to Jewish students to persist. The House believes that your institution is in violation of Title VI of the Civil Rights Act, and the inability or
unwillingness to rectify this violation through action requires accountability.
Postsecondary education is a unique opportunity for students to learn and have their ideas and beliefs challenged. However, universities receiving hundreds of millions of federal funds annually have denied
students that opportunity and have been hijacked to become venues for the promotion of terrorism, antisemitic harassment and intimidation, unlawful encampments, and in some cases, assaults and riots.
The House of Representatives will not countenance the use of federal funds to indoctrinate students into hateful, antisemitic, anti-American supporters of terrorism. Investigations into campus antisemitism by the Committee on Education and the Workforce and the Committee on Ways and Means have been expanded into a Congress-wide probe across all relevant jurisdictions to address this national crisis. The undersigned Committees will conduct oversight into the use of federal funds at MIT and its learning environment under authorities granted to each Committee.
• The Committee on Education and the Workforce has been investigating your institution since December 7, 2023. The Committee has broad jurisdiction over postsecondary education, including its compliance with Title VI of the Civil Rights Act, campus safety concerns over disruptions to the learning environment, and the awarding of federal student aid under the Higher Education Act.
• The Committee on Oversight and Accountability is investigating the sources of funding and other support flowing to groups espousing pro-Hamas propaganda and engaged in antisemitic harassment and intimidation of students. The Committee on Oversight and Accountability is the principal oversight committee of the US House of Representatives and has broad authority to investigate “any matter” at “any time” under House Rule X.
• The Committee on Ways and Means has been investigating several universities since November 15, 2023, when the Committee held a hearing entitled From Ivory Towers to Dark Corners: Investigating the Nexus Between Antisemitism, Tax-Exempt Universities, and Terror Financing. The Committee followed the hearing with letters to those institutions on January 10, 202
Model Attribute Check Company Auto PropertyCeline George
In Odoo, the multi-company feature allows you to manage multiple companies within a single Odoo database instance. Each company can have its own configurations while still sharing common resources such as products, customers, and suppliers.
Palestine last event orientationfvgnh .pptxRaedMohamed3
An EFL lesson about the current events in Palestine. It is intended to be for intermediate students who wish to increase their listening skills through a short lesson in power point.
Embracing GenAI - A Strategic ImperativePeter Windle
Artificial Intelligence (AI) technologies such as Generative AI, Image Generators and Large Language Models have had a dramatic impact on teaching, learning and assessment over the past 18 months. The most immediate threat AI posed was to Academic Integrity with Higher Education Institutes (HEIs) focusing their efforts on combating the use of GenAI in assessment. Guidelines were developed for staff and students, policies put in place too. Innovative educators have forged paths in the use of Generative AI for teaching, learning and assessments leading to pockets of transformation springing up across HEIs, often with little or no top-down guidance, support or direction.
This Gasta posits a strategic approach to integrating AI into HEIs to prepare staff, students and the curriculum for an evolving world and workplace. We will highlight the advantages of working with these technologies beyond the realm of teaching, learning and assessment by considering prompt engineering skills, industry impact, curriculum changes, and the need for staff upskilling. In contrast, not engaging strategically with Generative AI poses risks, including falling behind peers, missed opportunities and failing to ensure our graduates remain employable. The rapid evolution of AI technologies necessitates a proactive and strategic approach if we are to remain relevant.
The Roman Empire A Historical Colossus.pdfkaushalkr1407
The Roman Empire, a vast and enduring power, stands as one of history's most remarkable civilizations, leaving an indelible imprint on the world. It emerged from the Roman Republic, transitioning into an imperial powerhouse under the leadership of Augustus Caesar in 27 BCE. This transformation marked the beginning of an era defined by unprecedented territorial expansion, architectural marvels, and profound cultural influence.
The empire's roots lie in the city of Rome, founded, according to legend, by Romulus in 753 BCE. Over centuries, Rome evolved from a small settlement to a formidable republic, characterized by a complex political system with elected officials and checks on power. However, internal strife, class conflicts, and military ambitions paved the way for the end of the Republic. Julius Caesar’s dictatorship and subsequent assassination in 44 BCE created a power vacuum, leading to a civil war. Octavian, later Augustus, emerged victorious, heralding the Roman Empire’s birth.
Under Augustus, the empire experienced the Pax Romana, a 200-year period of relative peace and stability. Augustus reformed the military, established efficient administrative systems, and initiated grand construction projects. The empire's borders expanded, encompassing territories from Britain to Egypt and from Spain to the Euphrates. Roman legions, renowned for their discipline and engineering prowess, secured and maintained these vast territories, building roads, fortifications, and cities that facilitated control and integration.
The Roman Empire’s society was hierarchical, with a rigid class system. At the top were the patricians, wealthy elites who held significant political power. Below them were the plebeians, free citizens with limited political influence, and the vast numbers of slaves who formed the backbone of the economy. The family unit was central, governed by the paterfamilias, the male head who held absolute authority.
Culturally, the Romans were eclectic, absorbing and adapting elements from the civilizations they encountered, particularly the Greeks. Roman art, literature, and philosophy reflected this synthesis, creating a rich cultural tapestry. Latin, the Roman language, became the lingua franca of the Western world, influencing numerous modern languages.
Roman architecture and engineering achievements were monumental. They perfected the arch, vault, and dome, constructing enduring structures like the Colosseum, Pantheon, and aqueducts. These engineering marvels not only showcased Roman ingenuity but also served practical purposes, from public entertainment to water supply.
Digital Tools and AI for Teaching Learning and Research
Coastal marsh. Wetlands in the Atchafalaya National Wil.docx
1. Coastal marsh.
'Wetlands in the
Atchafalaya National
Wildlife Refuge in
Louisiana provide valuable
ecosystem services.
2 Communities and Ecosystems
Campbell Essential Biology with Physiology, Fourth Edition, by
Eric J. Simon, Jean L. Dickey, and Jane B. Reece. Published by
Benjamin Cummings.
Copyright CD, 2013 by Pearson Education, Inc.
CHAPTER CONTENTS
The Loss of Biodiversity 426
Community Ecology 428
Ecosystem Ecology 437
Conservation and Restoration Biology 444
CHAPTER THREAD
Biodiversity in Decline
BIOLOGY AND SOCIETY
Why Biodiversity Matters 425
2. THE PROCESS OF SCIENCE
How Does Tropical Forest Fragmentation
Affect Biodiversity? 446
EVOLUTION CONNECTION
Can Biophilia Save Biodiversity? 448
Biodiversity in Decline BIOLOGY AND SOCIETY
Why Biodiversity Matters
As the human population has expanded, hundreds of species
have become extinct and thou-
sands more are threatened with extinction. These changes
represent a loss in biological di-
versity, or biodiversity. Biodiversity loss goes hand in hand
with the disappearance of natural
ecosystems. Only about a quarter of Earth's land surfaces
remain untouched by human altera-
tions. We see the evidence of our impact on natural ecosystems
every day. We live and work
in altered landscapes. And though we may be less aware of it,
our impact on the oceans is also
extensive.
What is the value of biodiversity? Most people appreciate the
direct benefits provided by
certain ecosystems. For example, you probably know that we
use resources—such as water,
wood, and fish—that come from natural or near-natural
ecosystems. These resources have
economic value, as the massive 2010 oil spill in the Gulf of
Mexico dramatically demonstrated.
Billions of dollars were lost by fishing, recreation, and other
industries as a result of the di-
saster. But human well-being also depends on less obvious
3. services that healthy ecosystems
provide. The coastal wetlands affected by the Gulf oil spill
normally act as a buffer against hur-
ricanes, reduce the impact of flooding, and filter pollutants. The
wetlands also furnish nesting
sites for birds and marine turtles and breeding areas and
nurseries for a wide variety of fish
and shellfish. Natural ecosystems provide other services as
well—such as recycling nutrients,
preventing erosion and mudslides, controlling agricultural pests,
and pollinating crops. Some
scientists have attempted to assign an economic value to these
benefits. They arrived at an
average annual value of ecosystem services of $33 trillion,
almost twice the global gross
national product for the year they published their results.
Although rough, these estimates
make the important point that we cannot afford to take
biodiversity for granted.
In this chapter, we'll examine the interactions among organisms
and how those relation-
ships determine the features of communities. On a larger scale,
we'll explore the dynamics
of ecosystems. Finally, we'll consider how scientists are
working to save biodiversity. And
throughout the chapter, you'll learn how an understanding of
ecology can help us manage
Earth's resources wisely.
Campbell Essential Biology with Physiology, Fourth Edition, by
Eric J. Simon, Jean L. Dickey, and Jane B. Reece. Published by
Benjamin Cummings.
Copyright C 2013 by Pearson Education, Inc.
4. CHAPTER 20
COMMUNITIES
AND ECOSYSTEMS
V Figure 20.1 Einkorn
wheat, one of the wild
relatives of modern
cultivated varieties.
HI CHECKPOINT
How does the loss of
genetic diversity endanger
a population?
.96uutp
of astiodsai ur aniona 0.141pqo Ssal
say Aps,aup J4atia5 pasoanap
10141 UOIJOindOd UaArak
The Loss of Biodiversity
Species Diversity As mentioned previously, biodiversity is short
for biological diversity, the variety of living things that you
learned about in Unit 3. It includes genetic diversity,
species diversity, and ecosystem diversity. Thus, the loss
of biodiversity encompasses more than just the fate of
individual species.
Genetic Diversity
When species are lost, so are their unique genes. The
genetic diversity within a population is the raw material
that makes microevolution and adaptation to the
environment possible. If local populations are lost, then
5. the number of individuals in the species declines, and so
do the genetic resources for that species. Severe reduc-
tion in genetic variation threatens the survival of a
species. The enormous genetic diversity of all the
organisms on Earth has great potential benefit for
people, too. Many researchers and biotechnology
leaders are enthusiastic about the potential that genetic
"bioprospecting" holds for future development of new
medicines, industrial chemicals, and other products.
Bioprospecting may also hold the key to the world's
food supply. For example, researchers are currently
scrambling to stop the spread of a deadly new strain of
wheat stem rust, a fungal pathogen that has devastated
harvests in eastern Africa and central Asia. At least 75%
of the wheat varieties planted worldwide are susceptible
to this pathogen, but researchers hope to find a resis-
tance gene in the wild relatives of wheat (Figure 20.1). F4
In view of the damage we are doing to the biosphere,
ecologists believe that we are pushing species toward
extinction at an alarming rate. The present rate of spe-
cies loss may be as much as 100 times higher than at any
time in the past 100,000 years. Some researchers esti-
mate that at the current rate of destruction, over half of
all currently living plant and animal species will be gone
by the end of this century. Figure 20.2 shows two recent
victims. Here are some examples of where things stand:
• Approximately 12% of the 10,027 known bird
species and 21% of the 5,490 known mammalian
species in the world are threatened with extinction.
• More than 20% of the known freshwater fishes in
the world have either become extinct during human
history or are seriously threatened.
7. one species can have a negative effect on the entire
ecosystem. The disappearance of natural ecosystems
results in the loss of ecosystem services, functions
performed by an ecosystem that directly or indirectly
benefit people. These vital services include air and water
purification, climate regulation, and erosion control.
For example, forests absorb and store carbon from the
atmosphere, a service that vanishes when forests are
destroyed or degraded (see Figure 18.39). Coral reefs
not only are rich in species diversity (Figure 20.3) but
also provide a wealth of benefits to people, including
food, storm protection, and recreation. An estimated
20% of the world's coral reefs have already been de-
stroyed by human activities. A study published in 2011
found that 75% of the remaining reefs are threatened, a
percentage expected to top 90% by 2030 if current
abuses continue. IM
V Figure 20.3 A coral reef, a colorful display of
biodiversity.
Causes of Declining
Biodiversity
Ecologists have identified four main factors responsible for
the loss of biodiversity: habitat destruction and fragmenta-
tion, invasive species, overexploitation, and pollution. The
ever-expanding size and dominance of the human popula-
tion are at the root of all four factors. In addition, scientists
expect global climate change to become a leading cause of
extinctions in the near future (see Chapter 18).
Habitat Destruction
The massive destruction and fragmentation of habitats
caused by agriculture, urban development, forestry, and
mining pose the single greatest threat to biodiversity
(Figure 20.4). According to the International Union for
8. the Conservation of Nature, which compiles informa-
tion on the conservation status of species worldwide,
habitat destruction affects more than 85% of all birds,
mammals, and amphibians that are threatened with
extinction. We'll take a closer look at the consequences
of habitat fragmentation later in this chapter.
Invasive Species
Ranking second behind habitat loss as a cause of biodi-
versity loss is the introduction of invasive species. Uncon-
trolled population growth of human-introduced
species to non-native habitats has caused
havoc when the introduced species
have competed with, preyed on, or
parasitized native species (see
Chapter 19). The lack of n -
teractio n s with other species
that could keep the newcom-
ers in check is often a key
factor in a non-native spe-
cies becoming invasive.
GI CHECKPOINT
When ecosystems are
destroyed, the services
they provide are lost. What
are some examples of
ecosystem services?
pool Pup
poom so tans 'aidoad Aq
9. pasn saamosa! puo !uogoapai
:Aqua, uo!som liopoinBal
aiouv 'uogroyund fabom pup
aPnPui sa3WaS ,95Dd s719
uo sp Na H sp uopas Appos
pup Zap:1g alp u! pauopuau
amo SlaMSUD arpssod Aannsuv
Figure 20.4 Habitat
destruction. In a contro-
versial method known as
mountaintop removal, mining
companies blast the tops off of
mountains and then scoop out
coal. The earth removed from
the mountain is dumped into
a neighboring valley.
427
Campbell Essential Biology with Physiology, Fourth Edition, by
Eric J. Simon, Jean L. Dickey, and Jane B. Reece. Published by
Benjamin Cummings.
Copyright tilD 2013 by Pearson Education, Inc.
CHAPTER 20
COMMUNITIES
AND ECOSYSTEMS
Si CHECKPOINT
What are the four main
10. causes of declining
biodiversity?
uofinllod
pua 'uoporpoidralano tapads
a,,,sonut tiopruzsap :Dpqog Ltgmsuv
Figure 20.6 Diverse species interacting in a Kenyan savanna
community.
Overexploitation
Unsustainable marine fisheries (see Figure 19.13) demon-
strate how people can overexploit wildlife by harvesting
at rates that exceed the ability of populations to rebound.
Among the many terrestrial species whose numbers
have been drastically reduced by excessive commercial
harvesting, poaching, or sport hunting are the American
bison, Galapagos tortoises, and tigers. Overharvesting
also threatens some plants, including rare trees such as
mahogany and rosewood that produce valuable wood.
Pollution
Air and water pollution (Figure 20.5) is a contributing
factor in declining populations of hundreds of species
worldwide. The global water cycle can transport pollut-
ants from terrestrial to aquatic ecosystems hundreds of
miles away. Pollutants that are emitted into the atmo-
sphere may be carried aloft for thousands of miles before
falling to earth in the form of acid precipitation. 12
Figure 20.5 A pelican stuck in oil from the 2010
Gulf of Mexico disaster. Wildlife is often the most visible
casualty of pollution, but the impact extends throughout the
ecosystem.
11. Community Ecology
On your next walk through a field or woodland, or
even across campus or your own backyard, observe
the variety of species present. You may see birds in
trees, butterflies on flowers, dandelions in the grass of
a lawn, or lizards darting for cover as you approach.
Each of these organisms interacts with other organisms
as it goes about looking for food, nesting sites, living
space, or shelter. An organism's biotic environment
includes not just individuals from its own popula-
tion, but also populations of other species living in the
same area. Ecologists call such an assemblage of species
living close enough together for potential interaction
a community. In Figure 20.6, the lion, the zebra, the
hyena, the vultures, the plants, and the unseen microbes
are all members of an ecological community in Kenya.
Interspecific Interactions
Our study of communities begins with interspecific
interactions—that is, interactions between species.
Interspecific interactions can be classified according to
the effect on the populations concerned, which may be
helpful (+) or harmful (—). In some cases, two popula-
tions in a community vie for a resource such as food or
space. The effect of this interaction is generally negative
for both species ( —/--)—neither species has access to
the full range of resources offered by the habitat. On the
other hand, some interspecific interactions benefit both
parties (+1+). For example, the interactions between
flowers and their pollinators are mutually beneficial.
In a third type of interspecific interaction, one species
exploits another species as a source of food. The effect
of this interaction is clearly beneficial to one popula-
tion and harmful to the other (+/—). In the next several
pages, you will learn more about these interspecific
12. interactions and how they affect communities. We will
also look at some examples of interspecific interactions
as powerful agents of natural selection.
Campbell Essential Biology with Physiology, Fourth Edition, by
Eric J. Simon, Jean L. Dickey, and Jane B. Reece. Published by
Benjamin Cummings.
Copyright 0 2013 by Pearson Education, Inc.
V Figure 20.8 Competitive exclusion in laboratory
populations of Paramecium.
Paramecium aurae
R
e l
at
iv
e
p
op
ul
at
io
n
de
ns
ity
13. P. aurelia P caudatum
Paramecium caudatum
51 CHECKPOINT
In another experiment,
Gause found that
Paramecium caudatum and
P. bursorio could coexist in
the same habitat, but both
populations were smaller
than when each species
occupied the habitat alone.
How would you explain
these results?
•sapinosai
lopuassa Jo) Japo eq saladuJoalno
wads iaipau UanamoH VD1ILU.IS
aJo sepu /D3160103d nag/ 10
spadso auos—uogoindod woe
of digrNIDAD sa3Jnosai aqJ sapnpai
euesmq - d puo wrileprin .c1
upanniaq uoppadwo3 :Jamsuv
V Figure 20.7 Species that use similar resources.
If; (a) Virginia's warbler (b) Orange-crowned warbler
14. COMMUNITY ECOLOGY Interspecific Competition (—/—)
In the logistic model of population growth (see
Figure 19.6), increasing population density reduces
the amount of resources available for each individual.
This intraspecific (within-species) competition for
limited resources ultimately limits population growth.
In interspecific competition (between-species competi-
tion), the population growth of a species may be limited
by the population densities of competing species as well
as by the density of its own population.
What determines whether populations in a com-
munity compete with each other? Each species has an
ecological niche, defined as its total use of the biotic
and abiotic resources in its environment. For example,
the ecological niche of a small bird called the Virginia's
warbler (Figure 20.7a) includes its nest sites and nest-
building materials, the insects it eats, and climatic
conditions such as the amount of precipitation and the
temperature and humidity that enable it to survive. In
other words, the ecological niche encompasses every-
thing the Virginia's warbler needs for its existence.
The ecological niche of the orange-crowned warbler
(Figure 20.7b) includes some of the same resources used
by the Virginia's warbler. Consequently, when these two
species inhabit the same area, they are competitors.
Ecologists investigated the effects of interspecific
competition between populations of these two birds in
a community in central Arizona. When they removed
either Virginia's warblers or orange-crowned warblers
from the study site, members of the remaining species
were significantly more successful in raising their off-
spring. This study showed that interspecific competition
15. can have a direct, negative effect on reproductive fitness.
If the ecological niches of two species are too similar,
they cannot coexist in the same place. Ecologists call this
the competitive exclusion principle, a concept
introduced by Russian ecologist G. F. Gause, who
demonstrated this effect with an elegant series of
experiments. Gause used two closely related species of
protists, Paramecium caudatum and P. aurelia. First, he
established the carrying capacity for each species
separately under the conditions used to culture (grow)
them in the laboratory (Figure 20.8, top graph). Then he
cultured the two species in the same habitat. Within two
weeks, the P. caudatum population had crashed (bottom
graph). Gause concluded that the requirements of
these two species were so similar that the superior
competitor—in this case, P. aurelia— deprived
P. caudatum of essential resources. II
429
2
ci)
Campbell Essential Biology with Physiology, Fourth Edition, by
Eric J. Simon, Jean L. Dickey, and Jane B. Reece. Published by
Benjamin Cummings.
Copyright C 2013 by Pearson Education, Inc.
Figure 20.9 Mutualism. Coral
polyps are inhabited by unicellular
algae. Why aren't
16. popular with
show-offs
predators?
CHAPTER 20
COMMUNITIES
AND ECOSYSTEMS
Y Figure 20.10 Cryptic
coloration. Camouflage
conceals the pygmy
seahorse from predators.
Mutualism (+1+)
In mutualism, both species benefit from an interac-
tion. Some mutualisms occur between symbiotic
species—those in which the organisms have a close
physical association with each other. For example, in the
symbiotic root-fungus associations known as
mycorrhizae (see the Biology and Society essay
in Chapter 16), the fungus delivers mineral nu-
trients to the plant and receives organic nutri-
ents in return. Coral reef ecosystems depend on
the mutualism between certain species of coral
animals and millions of unicellular algae that
live in the cells of each coral polyp (Figure 20.9).
Reefs are constructed by successive generations
of colonial corals that secrete an external cal-
cium carbonate skeleton. The formation
of the skeleton must outpace ero-
sion and competition for space
from fast-growing seaweeds.
The sugars that the algae produce
by photosynthesis provide at
17. least half of the energy used by
the coral animals. In return, the algae
gain a secure shelter that allows access
to light. They also use the coral's waste products, includ-
ing CO, and ammonia, a valuable source of nitrogen.
Mutualism can also occur between species that are not
symbiotic, such as flowers and their pollinators (see
Figure 13.28).
Predation (+/—)
Predation refers to an interaction in which one spe-
cies (the predator) kills and eats another (the prey).
Because predation has such a negative impact on the
reproductive success of the prey, numerous adaptations
for predator avoidance have evolved in prey popula-
tions through natural selection. For example, some prey
species, like the pronghorn antelope, run fast enough to
escape their predators (see the Evolution Connection
section in Chapter 19). Others, like rabbits, flee into
shelters. Still other prey species rely on mechanical de-
fenses, such as the porcupine's sharp quills or the hard
shells of clams and oysters.
Adaptive coloration is a type of defense that has
evolved in many species of animals. Camouflage, called
cryptic coloration, makes potential prey
difficult to spot against its background
(Figure 20.10). Warning coloration,
bright patterns of yellow, red, or orange
in combination with black, often marks ani-
mals with effective chemical defenses.
Predators learn to associate these color
18. patterns with undesirable consequences,
such as a noxious taste or painful sting,
and avoid potential prey with similar markings. The
vivid colors of the poison dart frog (Figure 20.11), an
inhabitant of Costa Rican rain forests, warn of noxious
chemicals in the frog's skin.
A prey species may also gain significant protection
through mimicry, a "copycat" adaptation in which one
species looks like another. For example, the pattern of
alternating red, yellow, and black rings of the harmless
scarlet king snake resembles the bold color pattern of
the venomous eastern coral snake (Figure 20.12).
Some insects have combined protective coloration
with adaptations of body structures in elaborate
disguises. For instance, there are insects that
resemble twigs, leaves, and bird droppings. Some
► Figure 20.11 Warning coloration of a poison
dart frog.
430
Campbell Essential Biology with Physiology, Fourth Edition, by
Eric J. Simon, Jean L. Dickey, and Jane B. Reece. Published by
Benjamin Cummings.
Copyright 2013 by Pearson Education, Inc.
♦ Figure 20.13 An insect mimicking a snake. When disturbed,
this
sphinx moth larva flips over (left) and resembles a snake
(right).
19. T Figure 20.14 Flavorful plants.
Peppermint Parts of the
Cloves. The cloves used in
peppermint plant yield a
cooking are the flower buds
pungent oil. of this plant.
Cinnamon. Cinnamon comes from the inner bark of this tree.
A Figure 20.12 Mimicry in snakes. The color pattern of the
nonvenomous scarlet king snake (left) is similar to that of the
venomous eastern coral snake (right).
81 CHECKPOINT
People find most bitter-
tasting foods objectionable.
Why do you suppose we
have taste receptors for
bitter-tasting chemicals?
..1a6uoi awns
OJ snip put, pool JO] pa&uoj Aal,q
ualim Ruot d *TV Allogualod Alaudo,
of suoumq Jo =swim aqJ paiqoua
Arlotunsad sicortualp iapq
angisuas vox/war alsoi :Iamsute
even do a passable imitation of a vertebrate. For
20. example, the colors on the dorsal side of certain cater-
pillars are an effective camouflage, but when disturbed,
the caterpillar flips over to reveal the snakelike eyes of
its ventral side (Figure 20.13). Eyespots that resemble
vertebrate eyes are common in several groups of moths
and butterflies. A flash of these large "eyes" startles
would-be predators. In other species, an eyespot may
deflect a predator's attack away from vital body parts.
Herbivory (+/—)
Herbivory is the consumption of plant parts or algae by
an animal. Although herbivory is not usually fatal to
plants, a plant whose body parts have been partially
eaten by an animal must expend energy to replace the
loss. Consequently, numerous defenses against herbi-
vores have evolved in plants. Spines and thorns are
obvious anti-herbivore devices, as anyone who has
plucked a rose from a thorny rosebush or brushed
against a spiky cactus knows. Chemical toxins are also
very common in plants. Like the chemical defenses of
animals, toxins in plants are distasteful, and herbivores
learn to avoid them. Among such chemical weapons are
the poison strychnine, produced by a tropical vine
called Strychnos toxifera; morphine, from the opium
poppy; nicotine, produced by the tobacco plant; mesca-
line, from peyote cactus; and tannins, from a variety of
plant species. Other defensive compounds that are not
toxic to humans but may be distasteful to herbivores are
responsible for the familiar flavors of peppermint,
cloves, and cinnamon (Figure 20.14). Some plants even
produce chemicals that
cause abnormal develop-
ment in insects that eat
them. Chemical compa-
nies have taken advan-
22. CHAPTER 20
COMMUNITIES
AND ECOSYSTEMS
Parasites and Pathogens (+/—)
Both plants and animals may be victimized by parasites
or pathogens. These interactions are beneficial to one
species (the parasite or pathogen) and harmful to the
other, known as the host. A parasite lives on or in a
host from which it obtains nourishment. Pathogens are
disease-causing bacteria, viruses, fungi, or protists that
can be thought of as microscopic parasites. Invertebrate
parasites include flatworms, such as flukes and tape-
worms, and a variety of roundworms, which live inside
a host organism's body. External parasites, such as
ticks, lice, mites, and mosquitoes, attach to their victims
temporarily to feed on blood or other body fluids. Plants
are also attacked by parasites, including roundworms
and aphids, tiny insects that tap into the phloem to suck
plant sap (see Figure 19.10). In any parasite population,
reproductive success is greatest for individuals that are
best at locating and feeding on their hosts. For example,
some aquatic leeches first locate a host by detecting
movement in the water and then confirm its identity
based on the host's body temperature and chemical cues
on its skin.
Non-native pathogens, whose impact can be rapid
and dramatic, have provided some opportunities to
investigate the effects of pathogens on communities. In
one example, ecologists studied the consequences of the
epidemic of chestnut blight, a disease caused by a
protist. The loss of chestnuts, massive canopy trees that
once dominated many forest communities in North
23. America, had a significant impact on community
composition and structure. Trees such as oaks and
hickories that had formerly competed with chestnuts
became more numerous; overall, the diversity of tree
species increased. Dead chestnut trees also furnished
niches for other organisms, such as insects, cavity-
nesting birds, and, eventually, decomposers. I
Trophic Structure
Now that we have looked at how populations in a
community interact with one another, let's consider
the community as a whole. The feeding relationships
among the various species in a community are referred
to as its trophic structure. A community's trophic
structure determines the passage of energy and nutri-
ents from plants and other photosynthetic organisms to
herbivores and then to predators. The sequence of food
transfer between trophic levels is called a food chain.
Figure 20.15 shows two food chains, one terrestrial and
one aquatic. At the bottom of both chains is the trophic
level that supports all others. This level consists of auto-
trophs, which ecologists call producers. Photosynthetic
producers transform light energy to chemical energy
stored in the bonds of organic compounds. Plants are
the main producers on land. In water, the producers are
mainly photosynthetic protists and cyanobacteria, collec-
tively called phytoplankton. Multicellular algae and aquatic
plants are also important producers in shallow waters. In a
few communities, such as those surrounding hydrothermal
vents, the producers are chemosynthetic prokaryotes.
All organisms in trophic levels above the produc-
ers are heterotrophs, or consumers, and all consumers
depend directly or indirectly on the output of produc-
24. ers. Herbivores, which eat plants, algae, or phytoplank-
ton, are the primary consumers. Primary consumers
on land include grasshoppers and many other insects,
snails, and certain vertebrates, such as grazing mam-
mals and birds that eat seeds and fruits. In aquatic
environments, primary consumers include a variety of
V Figure 20.15 Examples of food chains. The arrows trace
the transfer of food from one trophic level to the next in
terrestrial and aquatic communities.
432
Campbell Essential Biology with Physiology, Fourth Edition, by
Eric J. Simon, Jean L. Dickey, and Jane B. Reece. Published by
Benjamin Cummings.
Copyright 0 2013 by Pearson Education, Inc.
COMMUNE TY f COLOGY zooplankton (mainly protists and
microscopic animals
such as small shrimps) that eat phytoplankton.
Above the primary consumers, the trophic levels are
made up of carnivores, which eat the consumers from
the level below. On land, secondary consumers include
many small mammals, such as the mouse shown in
Figure 20.15 eating an herbivorous insect, and a great
variety of birds, frogs, and spiders, as well as lions and
other large carnivores that eat grazers. In aquatic com-
munities, secondary consumers are mainly small fishes
that eat zooplankton. Higher trophic levels include
tertiary consumers (third-level consumers), such as
snakes that eat mice and other secondary consumers.
Most communities have secondary and tertiary con-
25. sumers. As the figure indicates, some also have a higher
level—quaternary consumers (fourth-level consumers).
These include hawks in terrestrial communities and
killer whales in the marine environment. There are no
fifth-level consumers—you'll find out why shortly.
Figure 20.15 shows only those consumers that eat
living organisms. Some consumers derive their energy
from detritus, the dead material left by all trophic levels,
including animal wastes, plant litter, and dead bodies.
Different organisms consume detritus in different stages
of decay. Scavengers, which are large animals such as
crows and vultures, feast on carcasses left behind by pred-
ators or speeding cars. The diet of detritivores is made up
primarily of decaying organic material. Earthworms and
millipedes are examples of detritivores. Decomposers,
mainly prokaryotes and fungi, secrete enzymes that
digest molecules in organic material and convert them
to inorganic forms. Enormous numbers of microscopic
decomposers in the soil and in the mud at the bottom of
lakes and oceans break down organic materials to inor-
ganic compounds—the raw materials used by plants and
phytoplankton to make new organic materials that may
eventually become food for consumers. Many garden-
ers keep a compost pile, using the services of detritivores
Y Figure 20.16 Adding compost to a garden. As it decays,
the rich organic material of compost provides a slow-release
source of inorganic nutrients for plants.
and decomposers to break down organic material from
kitchen scraps and yard trimmings (Figure 20.16).
Biological Magnification
Organisms can't metabolize many of the toxins produced
by industrial wastes or applied as pesticides; after con-
26. sumption, the chemicals remain in the body. These toxins
become concentrated as they pass through a food chain,
a process called biological magnification. Figure 20.17
shows the biological magnification of chemicals called
PCBs (organic compounds used in electrical equipment
until 1977) in a Great Lakes food chain. Zooplankton-
represented by the base of the pyramid—feed on phyto-
plankton contaminated by PCBs in the water. Smelt (small
fish) feed on contaminated zooplankton. Because each
smelt consumes many zooplankton, the concentration of
PCBs is higher in smelt than in zooplankton. For the same
reason, the concentration of PCBs in trout is higher than
in smelt. The top-level predators—herring gulls in this
example—have the highest concentrations of PCBs in the
food chain and are the organisms most severely affected
by any toxic compounds in the environment. In this case,
fewer of the contaminated eggs hatched, resulting in a
decline in the reproductive success of herring gulls. Many
other synthetic chemicals that cannot be degraded by
microorganisms, including DDT and mercury, can also
become concentrated through biological magnification.
Since people are top-level predators, too, eating fish from
contaminated waters can be dangerous.
Concentration
of PCBs
Herring
gut eggs
124 ppm
Lake trout
4.83 ppm
-4 Figure 20.17 Biological
magnification of PCBs in
27. a Great Lakes food chain
in the early 1960s.
Smelt
1.04 ppm
Zooplankton
0.123 ppm Phytoplankton
0.025 ppm 433
Campbell Essential Biology with Physiology, Fourth Edition, by
Eric J. Simon, Jean L. Dickey, and Jane B. Reece. Published by
Benjamin Cummings.
Copyright C> 2013 by Pearson Education, Inc.
CHAPTER 20
COMMUNITIES
AND ECOSYSTEMS
Food Webs
Few, if any, communities are so simple that they are
characterized by a single unbranched food chain.
Several types of primary consumers usually feed on the
same plant species, and one species of primary con-
sumer may eat several different plants. Such branching
of food chains occurs at the other trophic levels as well.
Thus, the feeding relationships in a community are
woven into elaborate food webs.
Consider the grasshopper mouse in Figure 20.18, the
secondary consumer shown crunching on a grasshopper
28. in Figure 20.15. Its diet also includes plants, making it a
primary consumer, too. It is an omnivore, an animal
that eats producers as well as consumers of different
levels. The rattlesnake that eats the mouse also feeds on
more than one trophic level. The blue arrow leading to
the rattlesnake indicates that it eats primary
consumers—it is a secondary consumer. The purple
arrow shows that it eats secondary consumers, so it is
also a tertiary consumer. Sound complicated? Actually,
Figure 20.18 shows a simplified food web. An actual
food web would involve many more organisms at each
trophic level, and most of the animals would have a
more diverse diet than shown in the figure. 12
s Figure 20.18 A
simplified food web for a
Sonoran desert community.
As in the food chains of
Figure 20.15, the arrows in
this web indicate "who eats
whom," the direction of
nutrient transfers. We also
continue the color coding
introduced in Figure 20.15
for the trophic levels and
food transfers.
S CHECKPOINT
You're eating a pizza. At
which trophic level(s) are
you feeding?
-Dzzrd atp uo paw JO as,aay.)
Ina noA uatiAA JawnsuopkopuoDas
29. D aJ,noA puo 'aanos ojowoj puo
(;S11.0 ayj u!) inog la; noA uaym
Jawnsuopkowyd D al,(70A :10MSUV
434
Campbell Essential Biology with Physiology, Fourth Edition, by
Eric J. Simon, Jean L. Dickey, and Jane B. Reece. Published by
Benjamin Cummings.
Copyright 6> 2013 by Pearson Education, Inc.
COMMUNITY ECOLOGY
Figure 20.20 Relative
abundance of tree
species in woodlands
A and B.
V Figure 20.21 A Pisaster
sea star.
■ Woodland A
al Woodland B
1S
E'
N
1
-2
30. 69
-4
3
8
6
-
El CHECKPOINT
How could a community
appear to have relatively
little diversity even though it
is rich in species?
aloe 6ufaq
sapads Jaw acp gpm 5f11000-1LUOD
ay; u! SUIS100510 alp /10 150101D
Joy palunapo sapads aS.IdAlp
ow to MO] o io auo yr :.ramSuV
435
Species Diversity in Communities
The species diversity of a community—the variety of
species that make up the community—has two com-
ponents. The first component is species richness, or
the number of different species in the community. The
other component is the relative abundance of the dif-
ferent species, the proportional representation of each
species in a community. To understand why both
components are important for describing species
diversity, imagine walking through the woodlands shown
31. in Figure 20.19. On the path through woodland A, you
would pass by four different species of trees, but most of
the trees you encounter would be the same species. Now
imagine walking on a path through woodland B. You
would see the same four species of trees that you saw in
woodland A—the species richness of the two woodlands
is the same. However, woodland B might seem more
diverse to you because no single species predominates.
As Figure 20.20 shows, the relative abundance of one
species in woodland A is much higher than the relative
abundances of the other three species. In woodland B,
all four species are equally abundant. As a result, species
diversity is greater in woodland B. Because plants pro-
vide food and shelter for many animals, a diverse plant
community promotes animal diversity.
Although the abundance of a dominant species such
as a forest tree can have an impact on the diversity of
V Figure 20.19 Which woodland is more diverse?
Woodland A
Woodland B
other species in the community, a nondominant species
may also exert control over community composition. A
keystone species is a species whose impact on its com-
munity is much larger than its total mass or abundance
indicates. The term keystone species was derived from the
wedge-shaped stone at the top of an arch that locks the
other pieces in place. If the keystone is removed, the arch
collapses. A keystone species occupies an ecological
niche that holds the rest of its community in place.
To investigate the role of a potential keystone
33. COMMUNITIES
AND ECOSYSTEMS
Disturbances in Communities
Most communities are constantly changing in response
to disturbances. Disturbances are episodes that damage
biological communities, at least temporarily, by destroy-
ing organisms and altering the availability of resources
such as mineral nutrients and water. Examples of natu-
ral disturbances are storms, fire, floods, and droughts,
but people are by far the most significant agents of
disturbance today.
Understanding the effects of disturbance is espe-
cially important because of the potential impact on the
human population. For instance, one consequence of
human-caused disturbance is the emergence of previ-
ously unknown infectious diseases. Three-
quarters of emerging diseases have jumped to
humans from another vertebrate species. In
many cases, people come into contact with the
pathogens through activities such as clearing land for ag-
riculture, road building, or hunting in previously isolated
ecosystems. HIV, which may have been transmitted to
people from the blood of primates butchered for food,
is probably the best-known example. Others include po-
tentially fatal hemorrhagic fevers, such as Ebola. Habitat
destruction may also cause pathogen-carrying animals to
venture closer to human dwellings in search of food.
Small-scale natural disturbances often have positive
effects on a biological community. For example, when a
large tree falls in a windstorm, it creates new habitats
34. (Figure 20.22). More light may now reach the forest
floor, giving small seedlings the opportunity to grow; or
the depression left by the tree's roots may fill with water
and be used as egg-laying sites by frogs, salamanders,
and numerous insects. Eil
Ecological Succession
Communities change drastically following a severe dis-
turbance that strips away vegetation and even soil. The
disturbed area may be colonized by a variety of species,
which are gradually replaced by a succession of other
species, in a process called ecological succession.
When ecological succession begins in a virtually
lifeless area with no soil, it is called primary succession
(Figure 20.23). Examples of such areas are cooled lava
flows on volcanic islands and the rubble left by a retreat-
ing glacier. Often the only life-forms initially present
are autotrophic bacteria. Lichens and mosses, which
grow from windblown spores, are commonly the first
multicellular photosynthesizers to colonize the area.
Soil develops gradually as rocks weather and organic
matter accumulates from the decomposed remains of
the early colonizers. Lichens and mosses are eventually
overgrown by grasses and shrubs that sprout from seeds
blown in from nearby areas or carried in by animals.
Finally, the area is colonized by plants that become the
community's prevalent form of vegetation. Primary
succession can take hundreds or thousands of years.
CHECKPOINT
Why might the effect of a
small-scale natural distur-
bance, such as a forest tree
felled by wind, be consid-
35. ered positive?
311.1SlUDDIO
JaLDO .10.1 Qo2igoy ,vau sapinoid
pup JsaJoy ap to Lplod vows p 1.11
10lluns pup Jatom so ypns stolpoi
asoigp paw Pap uallod y :JaAntly
Where do deadly new diseases
like Ebola come from?
V Figure 20.22 A small-scale disturbance. When this tree fell
during a windstorm, its
root system and the surrounding soil uplifted, resulting in a
depression that filled with water.
The dead tree, the root mound, and the water-filled depression
are new habitats.
V Figure 20.23 Primary succession under way
on a lava flow in Volcanoes National Park,
Hawaii.
436
Campbell Essential Biology with Physiology, Fourth Edition, by
Eric J. Simon, Jean L. Dickey, and Jane B. Reece. Published by
Benjamin Cummings.
Copyright @ 2013 by Pearson Education, Inc.
ECOSYSTEM ECOLOGY
CI CHECKPOINT
36. What is the main abiotic fac-
tor that distinguishes primary
from secondary succession?
UOISSaJDDS 10
lasuo alp )D (uo,ssamns kopuoaas)
pos p awasagi sown (uqssaaans
A/D(1*K) pos p apuasqo aamsuv
♦ Figure 20.25 A terrarium ecosystem. Though it is small and
artificial, this
sealed terrarium illustrates the two major ecosystem processes:
energy flow and
chemical cycling.
Heat
energy
Bacteria,
protists,
and fungi
437
Secondary succession occurs where a disturbance
has destroyed an existing community but left the soil
intact. For example, secondary succession occurs as
areas recover from floods or fires (Figure 20.24).
Disturbances that lead to secondary succession are also
caused by human activities. Even before colonial times,
people were clearing the temperate deciduous forests
of eastern North America for agriculture and settle-
ments. Some of this land was later abandoned as the
soil was depleted of its chemical nutrients or the
37. residents moved west to new territories. Whenever
human intervention stops, secondary succession
begins. IS
V Figure 20.24 Secondary succession after a fire.
Ecosystem Ecology
In addition to the community of species in a given
area, an ecosystem includes all the abiotic factors,
such as energy, soil characteristics, and water. Let's
look at a small-scale ecosystem—a terrarium—to see
how the community interacts with these abiotic fac-
tors (Figure 20.25). A terrarium microcosm exhibits the
two major processes that sustain all ecosystems: energy
flow and chemical cycling. Energy flow is the passage
of energy through the components of the ecosystem.
Chemical cycling is the use and reuse of chemical ele-
ments such as carbon and nitrogen within the ecosystem.
Energy enters the terrarium in the form of sunlight
(yellow arrows). Plants (producers) convert light energy
to chemical energy through the process of photosynthe-
sis. Animals (consumers) take in some of this chemical
energy in the form of organic compounds when they
eat the plants. Detritivores and decomposers in the soil
obtain chemical energy when they feed on the dead
remains of plants and animals. Every use of chemical
energy by organisms involves a loss of some energy to
the surroundings in the form of heat (red arrows). Be-
cause so much of the energy captured by photosynthesis
is lost as heat, this ecosystem would run out of energy
if it were not powered by a continuous inflow of energy
from the sun.
In contrast to energy flow, chemical cycling (blue
arrows in Figure 20.25) involves the transfer of materi-
38. als within the ecosystem. While most ecosystems have
a constant input of energy from sunlight or another
source, the supply of the chemical elements used to
construct molecules is limited. Chemical elements such
as carbon and nitrogen are cycled between the abiotic
components of the ecosystem, including air, water, and
soil, and the biotic components of the ecosystem (the
community). Plants acquire these elements in inorganic
c•';
Er)
form from the air and soil and fix them into organic
molecules. Animals, such as the snail in Figure 20.25,
consume some of these organic molecules. When the
plants and animals become detritus, decomposers
return most of the elements to the soil and air in inorganic
form. Some elements are also returned to the air and soil
as the by-products of plant and animal metabolism.
In summary, both energy flow and chemical cycling
involve the transfer of substances through the trophic
levels of the ecosystem. However, energy flows through,
and ultimately out of, ecosystems, whereas chemicals
are recycled within and between ecosystems.
Campbell Essential Biology with Physiology, Fourth Edition, by
Eric J. Simon, Jean L. Dickey, and Jane B. Reece. Published by
Benjamin Cummings.
Copyrighte 2013 by Pearson Education, Inc.
V Figure 20.26 Primary production of different ecosystems.
Primary production is the amount of biomass created by the
39. producers of an ecosystem over a unit of time, in this case a
year.
Aquatic ecosystems are color-coded blue in these histograms;
terrestrial ecosystems are green.
Open ocean
Estuaiy
Algal beds and coral reefs
Desert and semidesert scrub
Tundra
Temperate grassland
Cultivated land
em coniferous forest (taiga)
Savanna
Temperate broadleaf forest
Tropical rain forest
0 500 1,000 1,500 2,000 2,500
Average Ornery production (g/m 2/yr)
438
Cellular
respiration
40. Is. Figure 20.27
What becomes of a
caterpillar's food?
Only about 15% of
the calories of plant
material this herbivore
consumes will be
stored as biomass
available to the next
link in the food chain.
at material
by caterpillar
15 kcal
CHAPTER 20
COMMUNITIES
AND ECOSYSTEMS
Energy Flow in Ecosystems
All organisms require energy for growth, maintenance,
reproduction, and, in many species, locomotion. In this
section, we take a closer look at energy flow through eco-
systems. Along the way, we'll answer two key questions:
What limits the length of food chains? and How do les-
sons about energy flow apply to people's use of resources?
Primary Production and the Energy
Budgets of Ecosystems
Each day, Earth receives about 10 19 kcal of solar en-
ergy, the energy equivalent of about 100 million atomic
bombs. Most of this energy is absorbed, scattered, or
reflected by the atmosphere or by Earth's surface. Of the
visible light that reaches plants, algae, and cyanobacte-
ria, only about 1% is converted to chemical energy by
41. photosynthesis.
Ecologists call the amount, or mass, of living organic
material in an ecosystem the biomass. The rate at which
an ecosystem's producers convert solar energy to the
chemical energy stored in biomass is called primary
production. The primary production of the entire bio-
sphere is roughly 165 billion tons of biomass per year.
Different ecosystems vary considerably in their
primary production (Figure 20.26) as well as in their
contribution to the total production of the biosphere.
Tropical rain forests are among the most productive
terrestrial ecosystems and contribute a large portion of
the planet's overall production of biomass. Coral reefs
also have very high production, but their contribution
to global production is small because they cover such a
small area. Interestingly, even though the open ocean
has very low production, it contributes the most to
Earth's total net primary production because of its huge
size—it covers 65% of Earth's surface area. Whatever the
ecosystem, primary production sets the spending limit
for the energy budget of the entire ecosystem because
consumers must acquire their organic fuels from
producers. Now let's see how this energy budget is
divided among the different trophic levels in an eco-
system's food web. S
Ecological Pyramids
When energy flows as organic matter through the
trophic levels of an ecosystem, much of it is lost at each
link in the food chain. Consider the transfer of organic
matter from plants (producers) to herbivores (primary
consumers). In most ecosystems, herbivores manage
to eat only a fraction of the plant material produced,
42. and they can't digest all of what they do consume. For
example, a caterpillar feeding on leaves passes about half
the energy in the leaves as feces (Figure 20.27). Another
35% of the energy is expended in cellular respiration.
Only about 15% of the energy in the caterpillar's food is
transformed into caterpillar biomass. Only this biomass
(and the energy it contains) is available to the consumer
that eats the caterpillar.
Figure 20.28, called a pyramid of production, illus-
trates the cumulative loss of energy with each transfer
in a food chain. Each tier of the pyramid represents all
of the organisms in one trophic level, and the width of
each tier indicates how much of the chemical energy of
the tier below is actually incorporated into the organic
matter of that trophic level. Note that producers convert
Growth
El CHECKPOINT
Deserts and semidesert
scrub cover about the same
amount of surface area
as tropical rain forests but
contribute less than toio of
Earth's primary production,
while rain forests contribute
220/0. Explain this difference.
.qnas pasappas pLID paw
to iwaw aionbs D so ssouroN ipnw
so sawg or cow afoul sa3npard
44. 1,000,000 kcal of sunlight
Traphic level
IS
B
N
1-
2
6
9
-4
3
5
8
6
Vegetarians
Meat-eaters
Cattle
only about 1% of the energy in the sunlight available to
them to primary production. In this generalized pyra-
mid, 10% of the energy available at each trophic level
becomes incorporated into the next higher level. Actual
efficiencies of energy transfer are usually in the range
of 5-20%. In other words, 80-95% of the energy at one
trophic level never reaches the next.
45. An important implication of this stepwise decline of
energy in a trophic structure is that the amount of energy
available to top-level consumers is small compared with
that available to lower-level consumers. Only a tiny frac-
tion of the energy stored by photosynthesis flows through
a food chain to a tertiary consumer, such as a snake feed-
ing on a mouse. This explains why top-level consumers
such as lions and hawks require so much geographic ter-
ritory: It takes a lot of vegetation to support trophic levels
so many steps removed from photosynthetic produc-
tion. You can also understand why most food chains are
Ecosystem Energetics and
Human Resource Use
The dynamics of energy flow apply to the
human population as much as to other
organisms. The two production pyramids in
Figure 20.29 are based on the same general-
ized model used to construct Figure 20.28,
with roughly 10% of the energy in each
trophic level available for consumption by
the next trophic level. The pyramid on the left shows energy
flow from producers (represented by corn) to people as
primary consumers—vegetarians. The pyramid on the right
illustrates energy flow from the same corn crop, with people
as secondary consumers, eating beef. Clearly, the human
population has less energy available to it when people eat at
higher trophic levels than as primary consumers.
Eating meat of any kind is both economically and
environmentally expensive. Compared with growing plants
for direct human consumption, producing Are vegetarians
greener?
meat usually requires that more land be
cultivated, more water be used for irrigation, more fossil
46. fuels be burned, and more chemical fertilizers and pesti-
cides be applied to croplands used for growing grain. In
many countries, people cannot afford to buy meat and are
vegetarians by necessity. As countries become more
affluent, the demand for meat increases—and so do the
environmental costs of food production. E
limited to three to five levels; there is sim-
ply not enough energy at the very top of
an ecological pyramid to support another
trophic level. There are, for example, no
nonhuman predators of lions, eagles, and
killer whales; the biomass in populations
of these top-level consumers is insufficient
to supply yet another trophic level with a
reliable source of nutrition.
ECOSYSTEM ECOLOGY
♦ Figure 20.29 Food energy available to the human population
at different trophic levels.
GI CHECKPOINT
Why is the energy at
different trophic levels
represented as a pyramid in
Figure 20.28?
.uo os
puo 'siatunsuco kowyd p lanai alp
w Abiaus p Junotuo ang.)aip, asp
UDIp .A310a16 sr (Rwadd alp p asoq
47. sip) lanai fampand sip 10 Athaua
p Junotuo arupalp3atp tnui ixau
asp 01 /045/ auo U.10.11 Jaisuati
tpoa spun no s1 A6fau3 •Jamsuv
439
Campbell Essential Biology with Physiology, Fourth Edition, by
Eric J. Simon, Jean L. Dickey, and Jane B. Reece. Published by
Benjamin Cummings.
Copyright CD 2013 by Pearson Education, Inc.
Nutrients
available
to producers
CHAPTER 20
COM M
AND LC.0'.3YST
Chemical Cycling in Ecosystems
V Figure 20.30 Plant
growth on fallen tree. In
the temperate rain forest of
Olympic National Park, in
Washington State, plants—
including other trees—quickly
take advantage of the min-
eral nutrients supplied by
decomposing "nurse logs."
The sun (or in some cases Earth's interior) supplies
48. ecosystems with a continual input of energy, but aside
from an occasional meteorite, there are no extrater-
restrial sources of chemical elements. Life, therefore,
depends on the recycling of chemicals. While an organ-
ism is alive, much of its chemical stock changes con-
tinuously, as nutrients are acquired and waste products
are released. Atoms present in the complex molecules
of an organism at the time of its death are returned to
the environment by the action of decomposers, re-
plenishing the pool of inorganic nutrients that plants
and other producers use to build new organic matter
(Figure 20.30). In a sense, each living thing only bor-
rows an ecosystem's chemical elements, returning what
is left in its body after it dies. Let's take a closer look at
how chemicals cycle between organisms and the abiotic
components of ecosystems.
The General Scheme of Chemical Cycling
Because chemical cycles in an ecosystem involve both
biotic components (organisms and nonliving organic
material) and abiotic (geologic and atmospheric)
components, they are called biogeochemical cycles.
Figure 20.31 is a general scheme for the cycling of a
mineral nutrient within an ecosystem. Note that the
cycle has an abiotic reservoir (white box) where a
chemical accumulates or is stockpiled outside of living
organisms. The atmosphere, for example, is an abiotic
reservoir for carbon. Phosphorus, on the other hand,
is available only from the soil. The water of aquatic
ecosystems contains dissolved carbon, nitrogen, and
phosphorus compounds.
Let's trace our way around our general biogeochemi-
cal cycle. () Producers incorporate chemicals from the
abiotic reservoir into organic compounds. 0 Consum-
ers feed on the producers, incorporating some of the
49. chemicals into their own bodies. 0 Both producers and
consumers release some chemicals back to the environ-
ment in waste products. 0 Decomposers
play a central role by break-
ing down the complex
organic molecules in
detritus such as
plant litter, ani-
mal wastes, and
dead organisms. The products of this metabolism are
inorganic molecules that replenish the abiotic reservoirs.
Geologic processes such as erosion and the weathering
of rock also contribute to the abiotic reservoirs. Produc-
ers use the inorganic molecules from abiotic reservoirs
as raw materials for synthesizing new organic molecules
(carbohydrates and proteins, for example), and the cycle
continues.
Biogeochemical cycles can be local or global. Soil is
the main reservoir for nutrients in a local cycle, such as
phosphorus. In contrast, for those chemicals that spend
part of their time in gaseous form—carbon and nitro-
gen are examples—the cycling is essentially global. For
instance, some of the carbon a plant acquires from the
air may have been released into the atmosphere by the
respiration of a plant or animal on another continent.
Now let's examine three important biogeochemical
cycles more closely: the cycles for carbon, phosphorus,
and nitrogen. As you study the cycles, look for the four
basic steps we described, as well as the geologic pro-
cesses that may move chemicals around and between
51. Primary
consumers
ECOSYST EM ECOLOGY
V Figure 20.32 The carbon cycle.
V Figure 20.33 The phosphorus cycle.
441
Phosphates
in soil
(inorganic)
Weathering
of rock
The Carbon Cycle
Carbon, the major ingredient of all organic molecules,
has an atmospheric reservoir and cycles globally.
Other abiotic reservoirs of carbon include fossil fuels
and dissolved carbon compounds in the oceans.
The reciprocal metabolic processes of photosynthe-
sis and cellular respiration, which you may recall
from previous chapters, are mainly responsible for
the cycling of carbon between the biotic and abiotic
worlds (Figure 20.32). 0 Photosynthesis removes CO,
from the atmosphere and incorporates it into organic
molecules, which are 0 passed along the food chain
by consumers. 0 Cellular respiration returns CO, to
the atmosphere. 0 Decomposers break down the car-
bon compounds in detritus; that carbon, too, is even-
tually released as CO,. On a global scale, the return of
52. CO, to the atmosphere by respiration closely balances
its removal by photosynthesis. However, increasing
levels of CO, caused by 0 the burning of wood and
fossil fuels (coal and petroleum) are contributing to
global climate change (see Figure 18.46).
The Phosphorus Cycle
Organisms require phosphorus as an ingredient of
nucleic acids, phospholipids, and ATP and (in verte-
brates) as a mineral component of bones and teeth. In
contrast to the carbon cycle and the other major biogeo-
chemical cycles, the phosphorus cycle does not have an
atmospheric component. Rocks are the only source of
phosphorus for terrestrial ecosystems; in fact, rocks that
have high phosphorus content are mined for fertilizer.
At the center of Figure 20.33,0 the weathering
(breakdown) of rock gradually adds inorganic phosphate
(P043- ) to the soil. 0 Plants absorb dissolved phosphate
from the soil and assimilate it by building the phos-
phorus atoms into organic compounds. 0 Consumers
obtain phosphorus in organic form by eating plants.
0 Phosphates are returned to the soil by the action of
decomposers on animal waste and the remains of dead
plants and animals. 0 Some of the phosphates drain
from terrestrial ecosystems into the sea, where they may
settle and eventually become part of new rocks. Phos-
phorus removed from the cycle in this way will not be
available to living organisms until 0 geologic processes
uplift the rocks and expose them to weathering.
Phosphates move from land to aquatic ecosystems
much more rapidly than they are replaced, and soil
characteristics may also decrease the amount of phos-
phate available to plants. As a result, phosphate is a
limiting factor in many terrestrial ecosystems. Farmers and
53. gardeners often use phosphate fertilizer, such as crushed
phosphate rock or bone meal (finely ground bones from
(1, slaughtered livestock or fish), to boost plant growth.
fr,
51:
to
to
Campbell Essential Biology with Physiology, Fourth Edition, by
Eric J. Simon, Jean L. Dickey, and Jane B. Reece. Published by
Benjamin Cummings.
Copyright 2013 by Pearson Education, Inc.
IS CHECKPOINT
What are the abiotic reser-
voirs of nitrogen? In what
form does nitrogen occur in
each reservoir?
'ON Pup
:pos :aiaLidsouijo :lamsuv
Nitrogen letaion
Assimilation
by plants
Nitrogen-fixing
bacteria in
root nodules
54. Free-living
nitrogen-fixing
bacteria
CHAPTER 20
COMMUNITIES
AND ECOSYSTEMS
The Nitrogen Cycle
As an ingredient of proteins and nucleic acids, nitrogen is
essential to the structure and functioning of all organisms.
Nitrogen has two abiotic reservoirs, the atmosphere and
the soil. The atmospheric reservoir is huge; almost 80%
of the atmosphere is nitrogen gas (NO. However, plants
cannot use nitrogen gas. The process of nitrogen fixation
converts gaseous N2 to nitrogen compounds that plants
can assimilate. Most of the nitrogen available in natural
ecosystems comes from biological fixation performed by
certain bacteria. Without these organisms, the reservoir of
usable soil nitrogen would be extremely limited.
Figure 20.34 illustrates the actions of two types of
nitrogen-fixing bacteria. 0 Some bacteria live symbiot-
ically in the roots of certain species of plants, supplying
their hosts with a direct source of usable nitrogen. The
largest group of plants with this mutualistic relationship
is the legumes, a family that includes peanuts and soy-
beans. Many farmers improve soil fertility by alternating
crops of legumes, which add nitrogen to the soil, with
plants such as corn that require nitrogen fertilizer.
0 Free-living nitrogen-fixing bacteria in soil or water
convert N2 to ammonia (NH 3), which then picks up
another H± to become ammonium (NH 41.
55. 0 After nitrogen is "fixed," some of the ammonium
is taken up and used by plants. 0 Nitrifying bacteria in
the soil also convert some of the ammonium to nitrate
(NO3- ), 0 which is more readily assimilated by plants.
Plants use this nitrogen to make molecules such as
amino acids, which are then incorporated into proteins.
When an herbivore (represented here by a rabbit)
eats a plant, it digests the proteins into amino acids and
then uses the amino acids to build the proteins it needs.
Higher-order consumers get nitrogen from the organic
molecules of their prey. Because animals form nitrogen-
containing waste products during protein metabolism,
consumers excrete some nitrogen into the soil or water.
The urine that rabbits and other mammals excrete
contains urea, a nitrogen compound that is widely used
as fertilizer.
Organisms that are not consumed eventually die and
become detritus, which is decomposed by bacteria and
fungi. 0 Decomposition releases ammonium from
organic compounds back into the soil, replenishing that
abiotic reservoir. Under low-oxygen conditions, how-
ever, 0 soil bacteria known as denitrifying bacteria strip
the oxygen atoms from nitrates, releasing N2 back into
the atmosphere and depleting the soil of usable nitrogen.
Human activities are disrupting the nitrogen cycle by
adding more nitrogen to the biosphere each year than
natural processes do. Combustion of fossil fuels and
modern agricultural practices are two major sources of
nitrogen. For example, many farmers use enormous
amounts of synthetic nitrogen fertilizer to supplement
natural nitrogen. However, less than half the fertilizer
applied is actually used by the crop plants. Some
nitrogen escapes to the atmosphere, where it forms
57. uopoindod sasno3 Apopp# uopopod
Itklylou .4q uogDzolapano Jamsuy
Mississippi River
V Figure 20.36 The Gulf of Mexico dead zone.
Nutrient Pollution
Low nutrient levels, especially of phosphorus and nitro-
gen, often limit the growth of algae and cyanobacteria
in aquatic ecosystems. Nutrient pollution occurs when
human activities add excess amounts of these chemicals
to aquatic ecosystems.
In many areas, phosphate pollution comes from agri-
cultural fertilizers and runoff of animal waste from live-
stock feedlots (where hundreds of animals are penned
together). Phosphates are also a common ingredient in
dishwasher detergents, making the outflow from sewage
treatment facilities—which also contains phosphorus
from human waste—a major source of
phosphate pollution. Phosphate pollu-
tion of lakes and rivers results in heavy
growth of algae and cyanobacteria
(Figure 20.35). Microbes consume a
great deal of oxygen as they decompose the extra bio-
mass, a process that depletes the water of oxygen. These
changes lead to reduced diversity of aquatic species and
a much less appealing body of water.
Agricultural sources of nitrogen include feedlots
and the large amounts of inorganic nitrogen fertiliz-
ers that are routinely applied to crops. Lawns and golf
courses also receive sizable applications of nitrogen
fertilizers. Crop and lawn plants take up some of the
nitrogen compounds, and denitrifiers convert some to
58. atmospheric N 2, but nitrate is not bound tightly by soil
particles and is easily washed out of the soil by rain or
irrigation. As a result, chemical fertilizers often exceed
T Figure 20.35 Algal growth resulting from nutrient
pollution. The flat green area in this photo is not a lawn, but
rather the surface of a polluted pond.
h-phosphate
detergents
any states?
the soil's natural recycling capacity. Nitrogen pollu-
tion may also come from sewage treatment facilities
when extreme conditions (such as unusual storms) or
malfunctioning equipment prevent them from meeting
water quality standards.
In an example of how far-reaching this problem can
be, nitrogen runoff from midwestern farm fields has
been linked to an annual summer "dead zone" in the
Gulf of Mexico (Figure 20.36). Vast algal blooms extend
outward from where the Mississippi River deposits its
nutrient-laden waters. As the algae die, decomposition
of the huge quantities of biomass diminishes the supply
of dissolved oxygen over an area that
ranges from 13,000 km 2 (roughly the
area of Connecticut) to 22,000 km 2
(about the area of Michigan). Oxygen
depletion disrupts benthic communi-
ties, displacing fish and invertebrates that can move and
killing organisms that are attached to the substrate.
More than 400 recurring and permanent coastal dead
zones totaling approximately 245,000 km 2 have been
60. enterprises. But the science of ecology is not just useful
for telling us how things have gone wrong. Ecological
research is also the foundation for finding solutions to
these problems and for reversing the negative conse-
quences of ecosystem alteration. Thus, we end the ecol-
ogy unit by highlighting these beneficial applications of
ecological research.
Conservation biology is a goal-oriented science that
seeks to understand and counter the loss of biodiversity.
Conservation biologists recognize that biodiversity can
be sustained only if the evolutionary mechanisms that
have given rise to species and communities of organ-
isms continue to operate. Thus, the goal is not simply
to preserve individual species but to sustain ecosystems,
where natural selection can continue to function, and to
maintain the genetic variability on which natural selec-
tion acts. The expanding field of restoration ecology
uses ecological principles to develop methods of return-
ing degraded areas to their natural state.
Biodiversity "Hot Spots"
Conservation biologists are applying their understand-
ing of population, community, and ecosystem dynamics
in establishing parks, wilderness areas, and other legally
protected nature reserves. Choosing locations for these
protected zones often focuses on biodiversity hot spots.
These relatively small areas have a large number of
endangered and threatened species and an exceptional
concentration of endemic species, species that are
found nowhere else. Together, the "hottest" of Earth's
biodiversity hot spots, shown in Figure 2037, total less
than 1.5% of Earth's land surface but are home to a third
of all species of plants and vertebrates. For example, all
lemurs are endemic to Madagascar, a large island off
61. the eastern coast of Africa that is home to more than
50 species of lemurs. In fact, almost all of the mammals,
reptiles, amphibians, and plants that inhabit Mada-
gascar are endemic. There are also hot spots in aquatic
ecosystems, such as certain river systems and coral reefs.
Because biodiversity hot spots can also be hot spots of
extinction, they rank high on the list of areas demand-
ing strong global conservation efforts.
Concentrations of species provide an opportunity to
protect many species in very limited areas. However, the
"hot spot" designation tends to favor the most notice-
able organisms, especially vertebrates and plants.
Invertebrates and microorganisms are often overlooked.
Furthermore, species endangerment is a global problem,
and focusing on hot spots should not detract from
efforts to conserve habitats and species diversity in other
areas. Finally, even the protection of a nature reserve
does not shield organisms from the effects of climate
change or other threats, such as invasive species or
infectious disease. The golden toad you saw in Figure 20.2
went extinct despite living in a protected reserve—a
victim of changing weather patterns, airborne pollution,
and disease. To stem the tide of biodiversity loss, we will
have to address environmental problems globally as well
as locally. IS
T Figure 20.37 Earth's terrestrial biodiversity hot spots (purple).
IS CHECKPOINT
What is a biodiversity
hot spot?
62. wads
pwa5uopua 5upopur trapads jo
Jaquinu Apt Aprouop.iodadslip
lt) Apitoatai o '4aMSAIV Da 111X115
444
Campbell Essential Biology with Physiology, Fourth Edition, by
Eric J. Simon, Jean L. Dickey, and Jane B. Reece. Published by
Benjamin Cummings.
Copyright 2013 by Pearson Education, Inc.
CONSERVATION AND
RESTORATION BIOLOGY Conservation at the Ecosystem
Level
Most conservation efforts in the past have focused on
saving individual species, and this work continues. (You
have already learned about one example, the red-cockaded
woodpecker, see Figure 19.12.) More and more, however,
conservation biology aims at sustaining the biodiversity of
entire communities and ecosystems. On an even broader
scale, conservation biology considers the biodiversity of
whole landscapes. Ecologically, a landscape is a regional
assemblage of interacting ecosystems, such as an area with
forest, adjacent fields, wetlands, streams, and streamside
habitats. Landscape ecology is the application of ecologi-
cal principles to the study of land-use patterns. Its goal is
to make ecosystem conservation a functional part of the
planning for land use.
63. V Figure 20.38 Edges between ecosystems within
a landscape.
Natural edges. Forests border grassland ecosystems in Lake
Clark National
Park, Alaska.
Edges created by human activity. Pronounced edges (roads)
surround
J> clear-cuts in this photograph of a heavily logged rain forest
in Malaysia.
rt.
Edges between ecosystems are prominent features
of landscapes, whether natural or altered by people
(Figure 20.38). Such edges have their own sets of physical
conditions—such as soil type and surface features—that
differ from the ecosystems on either side of them. Edges
also may have their own type and amount of distur-
bance. For instance, the edge of a forest often has more
blown-down trees than a forest interior because the edge
is less protected from strong winds. Because of their spe-
cific physical features, edges also have their
own communities of organisms. Some or-
ganisms thrive in edges because they require
resources found only there. For instance, whitetail deer
browse on woody shrubs found in edge areas between
woods and fields, and their populations often expand
when forests are logged or interrupted by development.
Edges can have both positive and negative effects on
biodiversity. A recent study in a tropical rain forest in
western Africa indicated that natural edge communities
are important sites of speciation. On the other hand,
landscapes where human activities have produced edges
often have fewer species.
64. Another important landscape feature, especially
where habitats have been severely fragmented, is the
movement corridor, a narrow strip or series of small
clumps of suitable habitat connecting otherwise isolated
patches. In places where there is extremely heavy
human impact, artificial corridors are sometime
constructed (Figure 20.39). Corridors can promote
dispersal and help sustain populations, and they are
especially important to species that migrate between
different habitats seasonally. But a corridor can also be
harmful—as, for example, in the spread of disease,
especially among small subpopulations in closely
situated habitat patches. II
Figure 20.39 An
artificial corridor.
This bridge over a
road provides an
artificial corridor for
animals in Banff
National Park,
Canada.
CHECKPOINT
How is a landscape different
from an ecosystem?
11015a1
owes atp w swols4scoo 6up10/a1ul
pianos io Rs sum y Jotp ui anIsnpur
stow s! aothspuo!
65. Why do some animals prefer
living on the edge?
445
Campbell Essential Biology with Physiology, Fourth Edition, by
Eric J. Simon, Jean L. Dickey, and Jane B. Reece. Published by
Benjamin Cummings.
Copyright 0 2013 by Pearson Education, Inc.
CHAPTER 20
COMMUNITIES
AND ECOSYSTEMS
Biodiversity In Decline THE PROCESS OF SCIENCE
How Does Tropical Forest Fragmentation
Affect Biodiversity?
Long-term studies are essential for learning how we
might best conserve biodiversity and other natural
resources. One site for such studies is the Biological
Dynamics of Forest Fragmentation Project (BDFFP), a
1,000-Ian' ecological "laboratory" located deep in the
Amazonian forest of Brazil. When the project was begun
in 1979, laws required landowners who cleared forest
for ranching or other agricultural operations to leave
scattered tracts of untouched forest. Biologists recruited
some of these landowners to create reserves in isolated
fragments of 1 ha (roughly 2.5 acres), 10 ha, and 100 ha.
Figure 20.40 shows some of these forest "islands." Be-
fore each area was isolated from the main forest, a small
army of specialists inventoried the organisms present
and measured the trees.
66. Hundreds of researchers have used the BDFFP sites
to investigate the effects of forest fragmentation on all
levels of ecological study. The initial observations
for these investigations were gleaned from the results
V Figure 20.40 Fragments of forest in the Amazon
that were created as part of the Biological
Dynamics of Forest Fragmentation Project. The
patch of forest on the right is a 1-ha fragment.
of other ecological studies—for example, the effects of
fragmentation in temperate forests or differences in the
biodiversity of small islands compared with mainland
ecosystems. These observations led many researchers to
ask the question, How does fragmentation of tropical
forests affect species diversity within the fragments?
Based on previous research on numerous species, a rea-
sonable hypothesis might be: Species diversity declines
as the size of the forest fragment decreases. An ecologist
studying large predators such as jaguars and pumas,
which require large hunting territories, might therefore
make the prediction that predators will only be found
in the largest areas. The BDFFP is unique because it
allows researchers to test their predictions with new
observations that compare species diversity in forest
fragments with a comparable control: species diversity
in the same area when it was intact. An undisturbed
area of 25,400 acres is also available for comparison with
fragmented areas. In addition, data can be collected over
a period of years or even decades.
Since the BDFFP was established, scientists have
studied many different groups of plants and animals.
In general, the results have shown that fragmentation
of forest into smaller pieces leads to a decline in spe-
cies diversity. Species richness decreases as a result of
67. local extinctions of many species of large mammals,
insects, and insectivorous birds. The popula-
tion density of remaining species often
declines. Researchers also documented
edge effects, such as those described
in the previous section. Changes in
abiotic factors along the fragment
edges, including increased wind
disturbance, higher temperature,
and decreased soil moisture,
played a role in community
alterations. For example, ecolo-
gists found that tree mortality
was higher than normal at frag-
ment edges. They also observed
changes in the composition of
communities of invertebrates
that inhabit the soil and leaf
litter.
Campbell Essential Biology with Physiology, Fourth Edition, by
Eric J. Simon, Jean L Dickey, and Jane B. Reece. Published by
Benjamin Cummings.
Copyright 0 2013 by Pearson Education, Inc.
446
CONSERVATION AND
RESTORATION BIOLOGY
68. 151 CHECKPOINT
The water in the Kissimmee
River eventually flows into
the Everglades. How will the
Kissimmee River Restoration
Project affect water quality in
the Everglades ecosystem?
-sapo/6san3 ail ul rtaionb
_swam aacpciwi pain palord as
alpiras wasAscoa sup &moral As
wparguaiop &moll woy uognpod
araganu Ruanard ipapo 'gaup/
lain#MLIOD ANN SPUDIJaM AWASUV
V Figure 20.42 The Kissimmee River Restoration Project.
Widened
canal
Water control
structure remaining
Water control
ti.....- ----- structure removed
River channel
restored
Former canal
Phase 1
completed
69. backfilled
• .,„)),
control
structure to
be removed in
phase 2
Kissimmee
River BM
Floodplain
0 10
Lake
Miles Okeechobee
Restoring Ecosystems
One of the major strategies in restoration ecology is
bioremediation, the use of living organisms to detoxify
polluted ecosystems. For example, bacteria have been
used to clean up old mining sites and oil spills (see
Figure 15.18). Researchers are also investigating the po-
tential of using plants to remove toxic substances such
as heavy metals and organic pollutants (for example,
PCBs) from contaminated soil (Figure 20.41).
Some restoration projects have the broader goal of
returning ecosystems to their natural state, which may
involve replanting vegetation, fencing out non-native
animals, or removing dams that restrict water flow.
Hundreds of restoration projects are currently under
way in the United States. One of the most ambitious
endeavors is the Kissimmee River Restoration Project in
70. south-central Florida.
The Kissimmee River was once a meandering shallow
river that wound its way from Lake Kissimmee south-
ward into Lake Okeechobee. Periodic flooding of the
river covered a wide floodplain during about half of the
year, creating wetlands that provided habitat for large
numbers of birds, fishes, and invertebrates. And as the
floods deposited the river's load of nutrient-rich silt on
the floodplain, they boosted soil fertility and maintained
the water quality of the river.
V Figure 20.41 Bioremediation using plants. A
researcher from the U.S. Department of Agriculture
investigates the use of canola plants to reduce toxic levels
of selenium in contaminated soil.
Between 1962 and 1971, the U.S. Army Corps of
Engineers converted the 166-km wandering river to a
straight canal 9 m deep, 100 m wide, and 90 km long.
This project, designed to allow development on the
floodplain, drained approximately 31,000 acres of
wetlands, with significant negative impacts on fish and
wetland bird populations. Without the marshes to help
filter and reduce agricultural runoff, the river trans-
ported phosphates and other excess nutrients from Lake
Okeechobee to the Everglades ecosystem to the south.
The restoration project involves removing water
control structures such as dams, reservoirs, and channel
modifications and filling in about 35 km of the canal
(Figure 20.42). The first phase of the project was
completed in 2004. The photo shows a section of the
Kissimmee canal that has been plugged, diverting flow
into the remnant river channels. Birds and other wildlife
have returned in unexpected numbers to the
71. 11,000 acres of wetlands that have been restored. The
marshes are filled with native vegetation, and game
fishes again swim in the river channels. GI
447
Campbell Essential Biology with Physiology, Fourth Edition, by
Eric J. Simon, Jean L. Dickey, and Jane B. Reece. Published by
Benjamin Cummings.
Copyright 2013 by Pearson Education, Inc.
CHAPTER 20
COMMUNITIES
AND ECOSYSTEMS
HI CHECKPOINT
What is meant by sustainable
development?
suogruaua5
aininj J saamosai ...winotona put)
pirtiou Aiddns awnbapo (JD
SariSii9 uxli 4uatudoianap Jamsuv
The Goal of Sustainable Development
The demand for the "provisioning" services of ecosys-
tems, such as food, wood, and water, is increasing as the
world population grows and becomes more affluent.
Although these demands are currently being met, they
are satisfied at the expense of other critical ecosystem
services, such as climate regulation and protection
against natural disasters. Clearly, we have set ourselves
72. and the rest of the biosphere on a precarious path into
the future. How can we best manage Earth's resources to
ensure that all generations inherit an adequate supply of
natural and economic resources and a relatively stable
environment?
Many nations, scientific associations, corporations,
and private foundations have embraced the concept of
sustainable development. The Ecological Society of
America, the world's largest organization of ecologists,
endorses a research agenda called the Sustainable Bio-
sphere Initiative. The goal of this initiative is to acquire
the ecological information necessary for the responsible
development, management, and conservation of Earth's
resources. The research agenda includes the search for
ways to sustain the productivity of natural and artifi-
cial ecosystems and studies of the relationship between
biological diversity, global climate change, and ecologi-
cal processes.
Sustainable development depends on more than
continued research and application of ecological knowl-
edge. It also requires that we connect the life sciences
with the social sciences, economics, and humanities.
Conservation of biodiversity is only one side of sustain-
able development; the other key factor is improving the
human condition. Public education and the political
commitment and cooperation of nations are essential to
the success of this endeavor.
An awareness of our unique ability to alter the
biosphere and jeopardize the existence of other species,
as well as our own, may help us choose a path toward a
sustainable future. The risk of a world without ad-
equate natural resources for all its people is not a vision
73. of the distant future. It is a prospect for your children's
lifetime, or perhaps even your own. But although the
current state of the biosphere is grim, the situation is
far from hopeless. Now is the time to take action by
aggressively pursuing greater knowledge about the
diversity of life on our planet and by working toward
long-term sustainability. El
Biodiversity in Decline EVOLUTION CONNECTION
Can Biophilia Save Biodiversity?
For millions of years, the diversity of life has flourished
via evolutionary adaptation in response to environ-
mental change. For many species, however, the pace of
evolution can't match the breakneck speed at which hu-
mans are changing the environment (see the Evolution
Connection sections in Chapters 18 and 19). Perhaps
those species are doomed to extinction. Or perhaps they
can be saved by one human characteristic that works in
their favor: biophilia.
Biophilia, which literally means "love of life," is a
term that Edward 0. Wilson, one of the world's fore-
most experts on biodiversity and conserva-
tion, uses for the human desire to affiliate with
other life in its many forms (Figure 20.43). People de-
velop close relationships with pets, nurture houseplants,
r. Figure 20.43 Doing what comes naturally. Edward 0.
Wilson has helped teach scientists and the general public a
greater respect for Earth's biodiversity. This photograph finds
biophiliac Wilson in the woods near Massachusetts's Walden
Pond, a landscape immortalized by another great naturalist and
writer, Henry David Thoreau.
74. 448
Are you a biophiliac?
Campbell Essential Biology with Physiology, Fourth Edition, by
Eric J. Simon, Jean L. Dickey, and Jane B. Reece. Published by
Benjamin Cummings.
Copyright it) 2013 by Pearson Education, Inc.
CONSERVATION AND
RESTORATION BIOLOGY
invite avian visitors with backyard feeders, and flock to
zoos, gardens, and nature parks (Figure 20.44). Our at-
traction to pristine landscapes with clean water and lush
vegetation is also testimony to our biophilia. Wilson
proposes that our biophilia is innate, an evolutionary
product of natural selection acting on a brainy species
whose survival depended on a close connection to the
environment and a practical appreciation of plants and
animals. We evolved in natural environments rich in
biodiversity, and we still have an affinity for such set-
tings. Our behavior reflects remnants of our ancestral
attachment to nature and the diversity of life.
It will come as no surprise that many biologists have
embraced the concept of biophilia. After all, these are
people who have turned their passion for nature into ca-
reers. But biophilia strikes a chord with biologists for an-
other reason. If biophilia is evolutionarily embedded in
our genome, then there is hope that we can become bet-
ter custodians of the biosphere. If we all pay more atten-
tion to our biophilia, a new environmental ethic could
75. catch on among individuals and societies. And that ethic
is a resolve never to knowingly allow a single species to
become extinct as a result of our actions or any ecosys-
tem to be destroyed as long as there are reasonable ways
to prevent it. Yes, we should be motivated to preserve
biodiversity because we depend on it for food, medicine,
building materials, fertile soil, flood control, habitable
climate, drinkable water, and breathable air. But maybe
we can also work harder to prevent the extinction of
other forms of life just because it is the ethical thing for
us to do. Again, Wilson sounds the call: "Right now,
we're pushing the species of the world through a bottle-
neck. We've got to make it a major moral principle to get
as many of them through this as possible. It's the chal-
lenge now and for the rest of the century. And there's
one good thing about our species: We like a challenge!"
Biophilia is a fitting capstone for this unit. Modern
biology is the scientific extension of our human ten-
dency to feel connected to and curious about all forms
of life. We are most likely to save what we appreciate,
and we are most likely to appreciate what we
understand. We hope that our discussion of
biodiversity has deepened your biophilia
and broadened your education.
V Figure 20.44 Biophilia. Whether we seek other organisms in
their own habitats
or invite them into ours, we clearly find pleasure in the
diversity of life.
Campbell Essential Biology with Physiology, Fourth Edition, by
Eric J. Simon, Jean L. Dickey, and Jane B. Reece. Published by
Benjamin Cummings.
Copyright C 2013 by Pearson Education, Inc.
76. 449
THE COMPONENTS OF BIODIVERSITY
Ecosystem Diversity
The current rate of species
Loss of genetic diversity extinctions is extremely high
threatens the survival of a compared to the rate of
species and eliminates natural extinctions over the
potential benefits to people. past 100,000 years.
Destruction of ecosystems
results in the loss of essential
ecosystem services.
Genetic Diversity Species Diversity
III SUMMARY OF KEY CONCEPTS
Go to www.masteringbicdogy.com for homework assignments,
practice quizzes, MR Pearson eText, and more.
The Loss of Biodiversity
Causes of Declining Biodiversity
Habitat destruction is the leading cause of extinctions. Invasive
species,
overexploitation, and pollution are also significant factors.
Community Ecology
Interspecific Interactions
Populations in a community interact in a variety of ways that
77. can be gener-
ally categorized as being beneficial (+) or harmful (—) to the
populations.
Because +/— interactions (exploitation of one species by
another species)
may have such a negative impact on the individual that is
harmed, defensive
evolutionary adaptations are common.
INTERACTIONS BETWEEN SPECIES IN A COMMUNITY
Interspecific Interaction Effect on
Species 1
Effect on Interspecific Interaction Effect on Effect on
Species 2 Species 1 Species 2
CHAPTER 20
COMMUNITIES
AND ECOSYSTEMS Chapter Review
Trophic Structure
The trophic structure of a community defines the feeding
relationships
among organisms. These relationships are sometimes organized
into food
chains or food webs. Toxins may accumulate by the process of
biological
magnification as they are passed up a food chain to the top
predators.
Increasing PCB concentration
Species Diversity in Communities
Diversity within a community includes species richness and
relative
78. abundance of different species. A keystone species is a species
that has a
great impact on the composition of the community despite
relatively low
abundance or biomass.
Disturbances in Communities
Disturbances are episodes that damage communities, at least
temporarily,
by destroying organisms or altering the availability of resources
such as
mineral nutrients and water. People are the most significant
cause of
disturbances today.
Ecological Succession
The sequence of changes in a community after a disturbance is
called
ecological succession. Primary succession occurs where a
community arises
in a virtually lifeless area with no soil. Secondary succession
occurs where a
disturbance has destroyed an existing community but left the
soil intact.
450
Campbell Essential Biology with Physiology, Fourth Edition, by
Eric J. Simon, Jean L. Dickey, and Jane B. Reece. Published by
Benjamin Cummings.
Copyright 2013 by Pearson Education, Inc.
Approximately 90%
loss of energy at
79. each trophic level
Autotrophs
Producer
Heterotrophs
Herbivore
(primary
consumer)
Carnivore
(secondary
consumer)
CHAPTER REVIEW
Ecosystem Ecology
Energy Flow in Ecosystems
An ecosystem is a biological community and the abiotic factors
with
which the community interacts. Energy must flow continuously
through an
ecosystem, from producers to consumers and decomposers.
Chemical
elements can be recycled between an ecosystem's living
community and
the abiotic environment. Trophic relationships determine an
ecosystem's
routes of energy flow and chemical cycling.
Light
80. Primary production is the rate at which plants and other
producers build
biomass. Ecosystems vary considerably in their productivity.
Primary
production sets the spending limit for the energy budget of the
entire
ecosystem because consumers must acquire their organic fuels
from
producers. In a food chain, only about 10% of the biomass at
one trophic
level is available to the next, resulting in a pyramid of
production.
When people eat producers instead of consumers, less
photosynthetic
production is required, which reduces the impact on the
environment
Z. Z.
Chemical Cycling in Ecosystems
Biogeochemical cycles involve biotic and abiotic components.
Each circuit
has an abiotic reservoir through which the chemical cycles.
Some chemical
elements require "processing" by certain microorganisms before
they are
available to plants as inorganic nutrients. A chemical's specific
route through
an ecosystem varies with the element and the trophic structure
of the
ecosystem. Phosphorus is not very mobile and is cycled locally.
Carbon and
nitrogen spend part of their time in gaseous form and are cycled
globally.
Runoff of nitrogen and phosphorus, especially from agricultural
81. land, causes
algal blooms in aquatic ecosystems, lowering water quality and
sometimes
depleting the water of oxygen.
Conservation and Restoration Biology
Biodiversity "Hot Spots"
Conservation biology is a goal-oriented science that seeks to
counter the
loss of biodiversity. The front lines for conservation biology are
biodiversity
"hot spots," relatively small geographic areas that are especially
rich in
endangered species.
Conservation at the Ecosystem Level
Increasingly, conservation biology aims at sustaining the
biodiversity of entire
communities, ecosystems, and landscapes. Edges between
ecosystems
are prominent features of landscapes, with positive and negative
effects on
biodiversity. Corridors can promote dispersal and help sustain
populations.
Restoring Ecosystems
In some cases, toxic substances such as heavy metals can be
removed from
an ecosystem by microbes or plants. Ecologists are working to
revitalize
some ecosystems by planting native vegetation, removing
barriers to wildlife,
and other means. The Kissimmee River Restoration Project is an
attempt
to undo the ecological damage done when the river was
82. engineered into
straight channels.
The Goal of Sustainable Development
Balancing the needs of people with the health of the biosphere,
sustainable
development has the goal of long-term prosperity of human
societies and
the ecosystems that support them.
Evolution Connection:
Biophilia and an Environmental Ethic
Biophilia is a term used by biologist E. 0. Wilson to describe
the innate
affinity people have for nature and for other organisms.
Wilson—and many
other biologists—hope that our biophilia will help us develop an
environmental ethic of preserving biodiversity.
451
Campbell Essential Biology with Physiology, Fourth Edition, by
Eric J. Simon, Jean L. Dickey, and Jane B. Reece. Published by
Benjamin Cummings.
Copyright 0 2013 by Pearson Education, Inc.
CHAPTER 20
COMMUNITIES
AND ECOSYSTEMS
THE PROCESS OF SCIENCE
11. An ecologist studying desert plants performed the following
experiment.
83. She staked out two identical plots that included a few sagebrush
plants
and numerous small annual wildflowers. She found the same
five
wildflower species in similar numbers in both plots. Then she
enclosed
one of the plots with a fence to keep out kangaroo rats, the most
common herbivores in the area. After two years, four species of
wildflowers were no longer present in the fenced plot, but one
wildflower species had increased dramatically. The unfenced
control plot
had not changed significantly in species composition. Using the
concepts discussed in the chapter, what do you think happened?
12. Imagine that you have been chosen as the biologist for the
design team
implementing a self-contained space station to be assembled in
orbit. It
will be stocked with the organisms you choose, creating an
ecosystem
that will support you and five other people for two years.
Describe the
main functions you expect the organisms to perform. List the
types of
organisms you would select, and explain why you chose them.
13. Biologists in the United States are concerned that
populations of many
migratory songbirds, such as warblers, are declining. Evidence
suggests
that some of these birds might be victims of pesticides. Most of
the
pesticides implicated in songbird mortality have not been used
in the
United States since the 1970s. Suggest a hypothesis to explain
84. the
current decline in songbird numbers. Design an experiment that
could
test your hypothesis.
FIBIOLOGY AND SOCIETY
14. Some organizations are starting to envision a sustainable
society—one
in which each generation inherits sufficient natural and
economic
resources and a relatively stable environment. The Worldwatch
Institute,
an environmental policy organization, estimates that we must
reach
sustainability by the year 2030 to avoid economic and
environmental
collapse. In what ways is our current system not sustainable?
What
might we do to work toward sustainability, and what are the
major
roadblocks to achieving it? How would your life be different in
a
sustainable society?
15. The Biological Dynamics of Forest Fragmentation Project,
which has
contributed so much to our understanding of threats to
biodiversity, is
itself endangered. Encouraged by Brazilian government
agencies, urban
sprawl and intensive forest settlement are closing in on the
study site.
Activities such as clear-cutting, burning, hunting, and logging
threaten
the integrity of the surrounding forest. Researchers at the