Economics of Climate Change Adaptation Training - Session 9
Co2 levels assignment
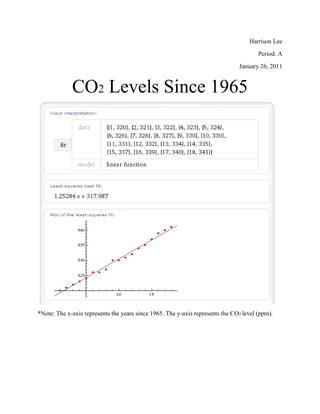
1. Harrison Lee<br />Period: A<br />January 26, 2011<br />CO2 Levels Since 1965<br />*Note: The x-axis represents the years since 1965. The y-axis represents the CO2 level (ppm). <br />Questions<br />Use your equation to predict what the carbon dioxide concentration should been in the year 2008 if the trends depicted in your graph continue. Show all your work. <br />y=14/9x+b<br />y=14/9(44)+324.8<br />y=616/9+324.8<br />y=393.24<br />Look up the carbon dioxide concentration(ppm – parts per million). Does your equation make a reasonable prediction.<br />The carbon dioxide concentration is approximately 385.57 ppm by 2008. No my equation did not make a reasonable prediction.<br />Do a percent error calculation comparing your predicted value with researched value. <br />Percent Error Formula:<br />Accepted-Experimental * 100%<br /> Accepted<br />=Percent Error <br />385.57-393.24<br /> 385.57<br /> -7.67 *100%<br /> 385.57<br />1.9% Error <br />*Note: Accepted is the researched result. Experimental is the result found by using your original formula for finding CO2 <br />