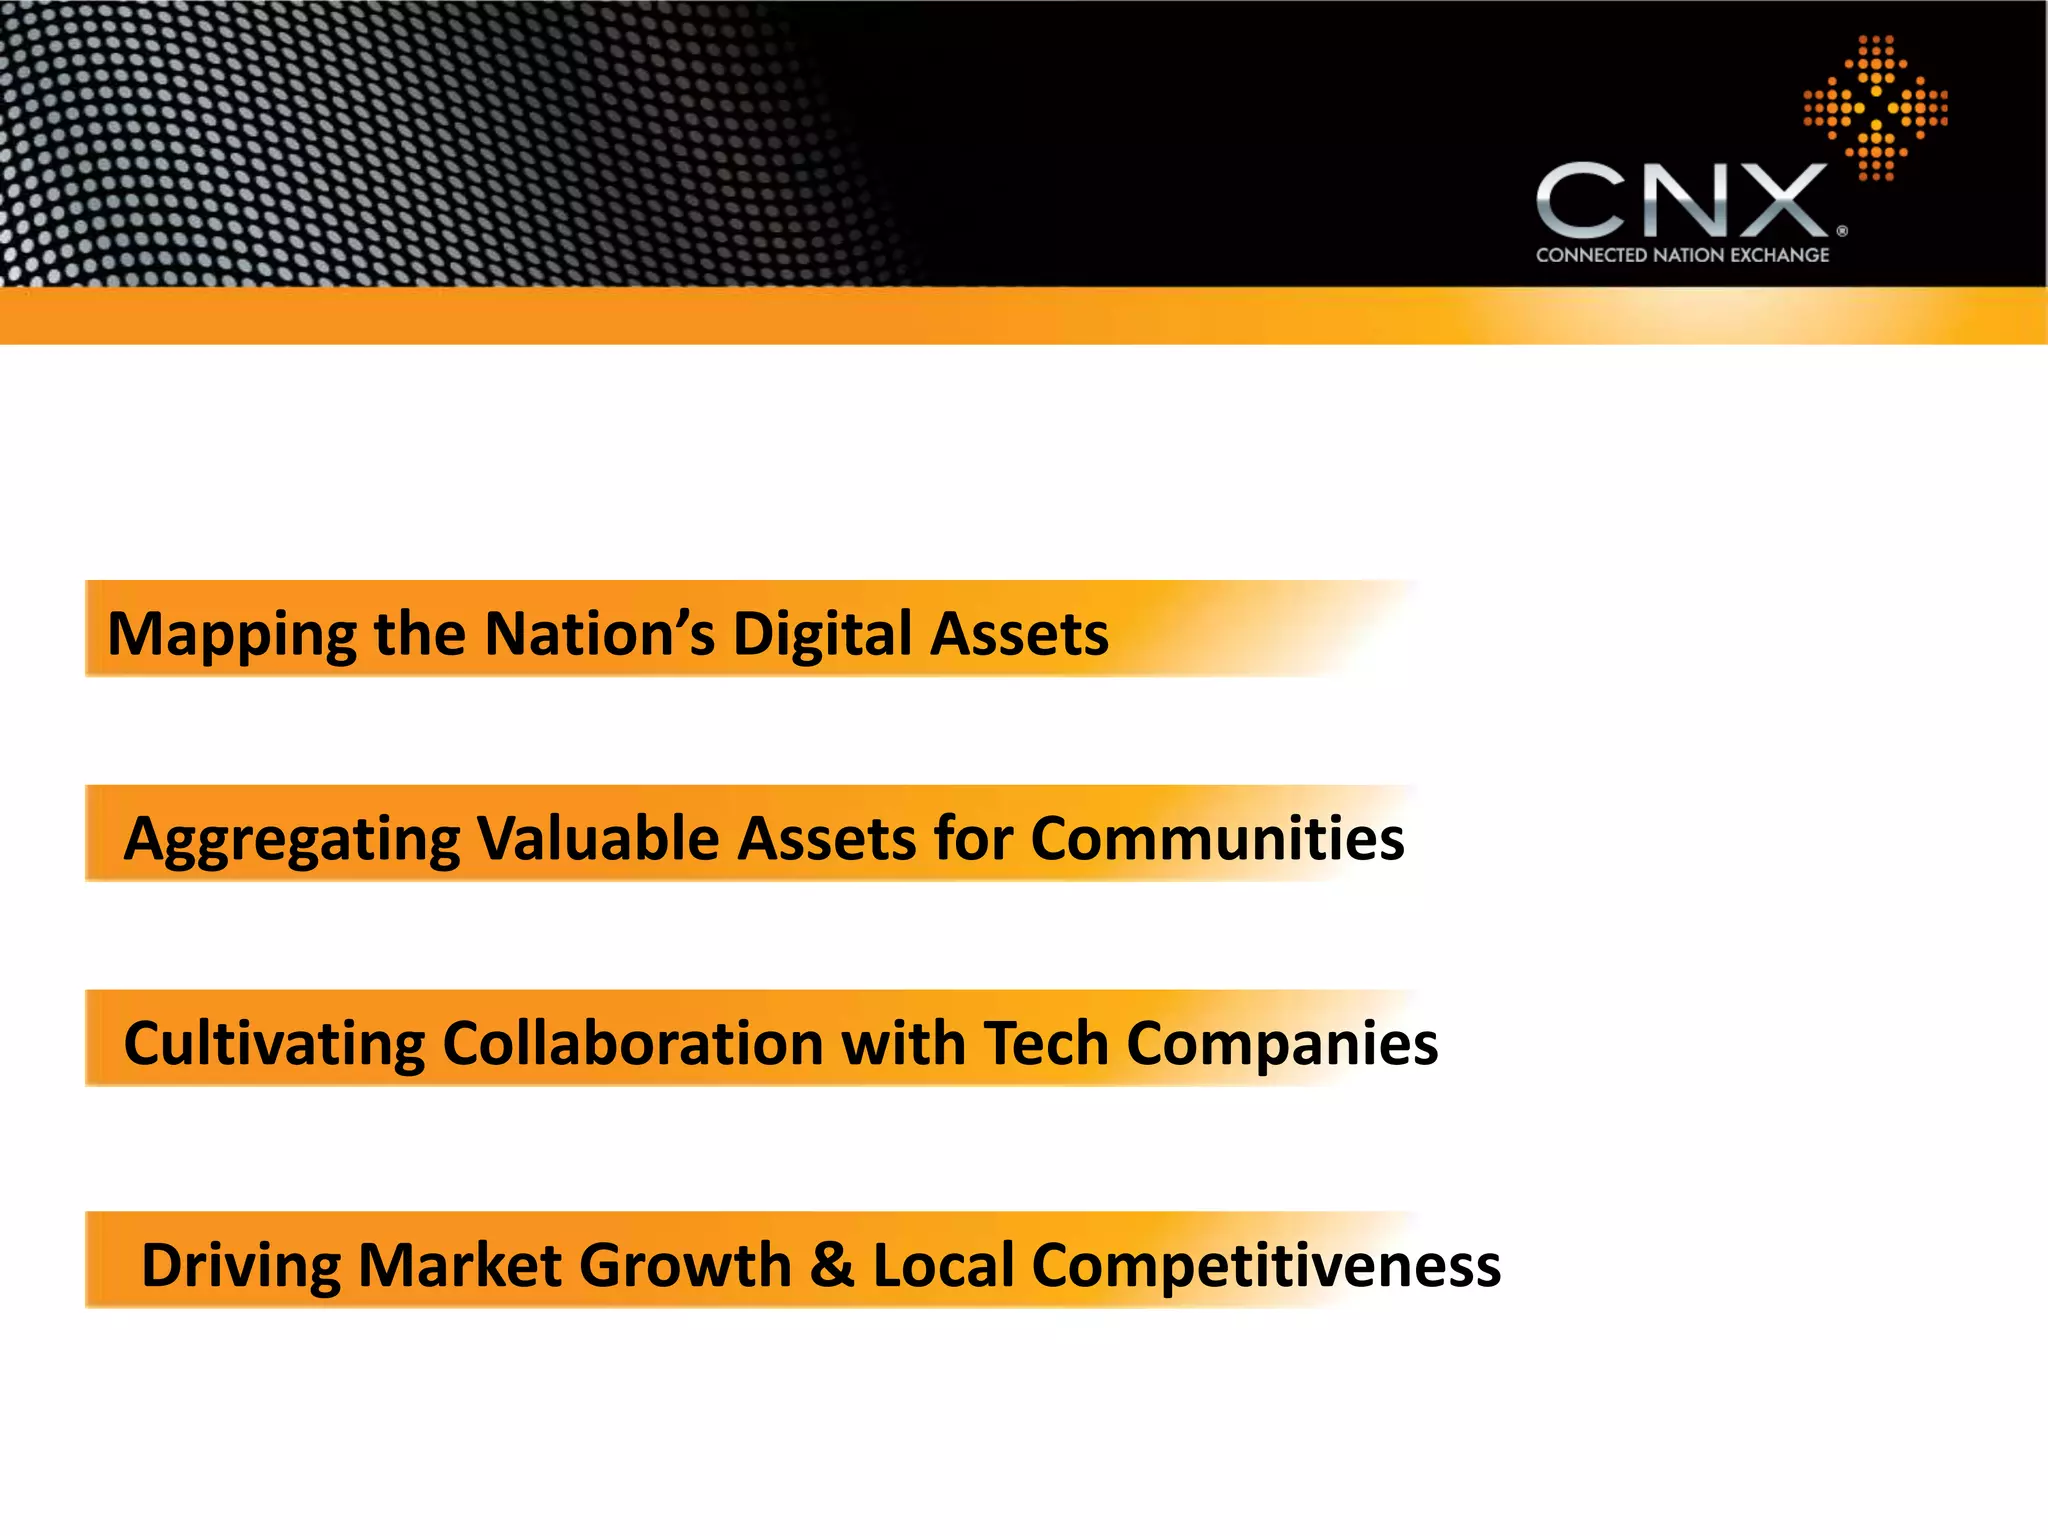
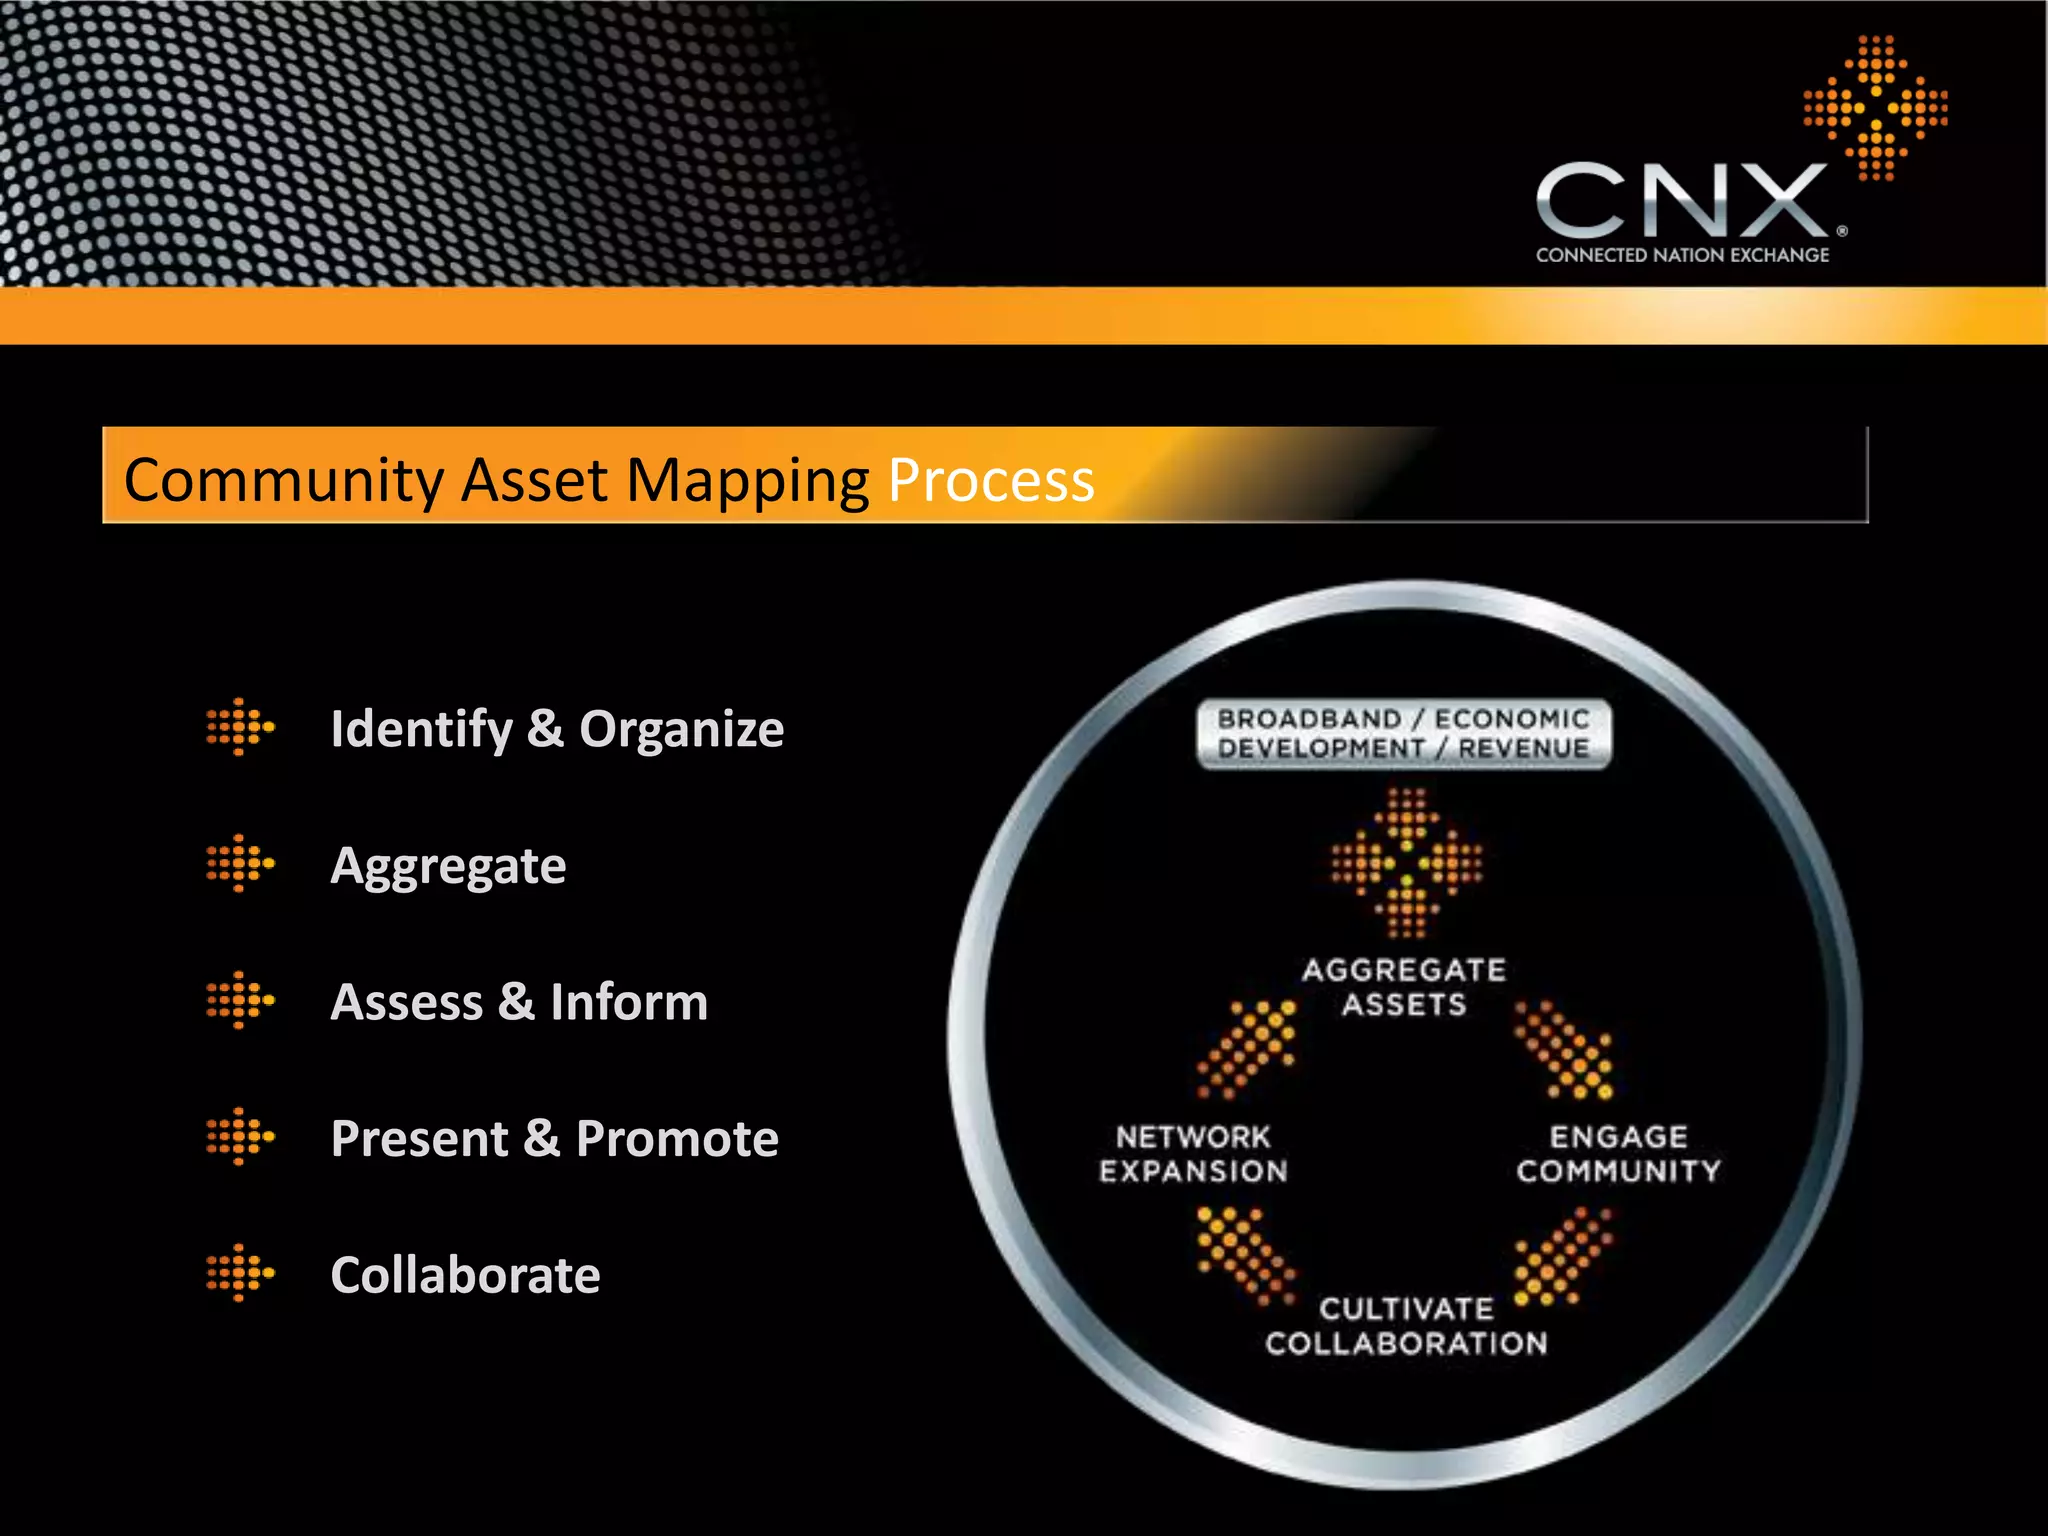
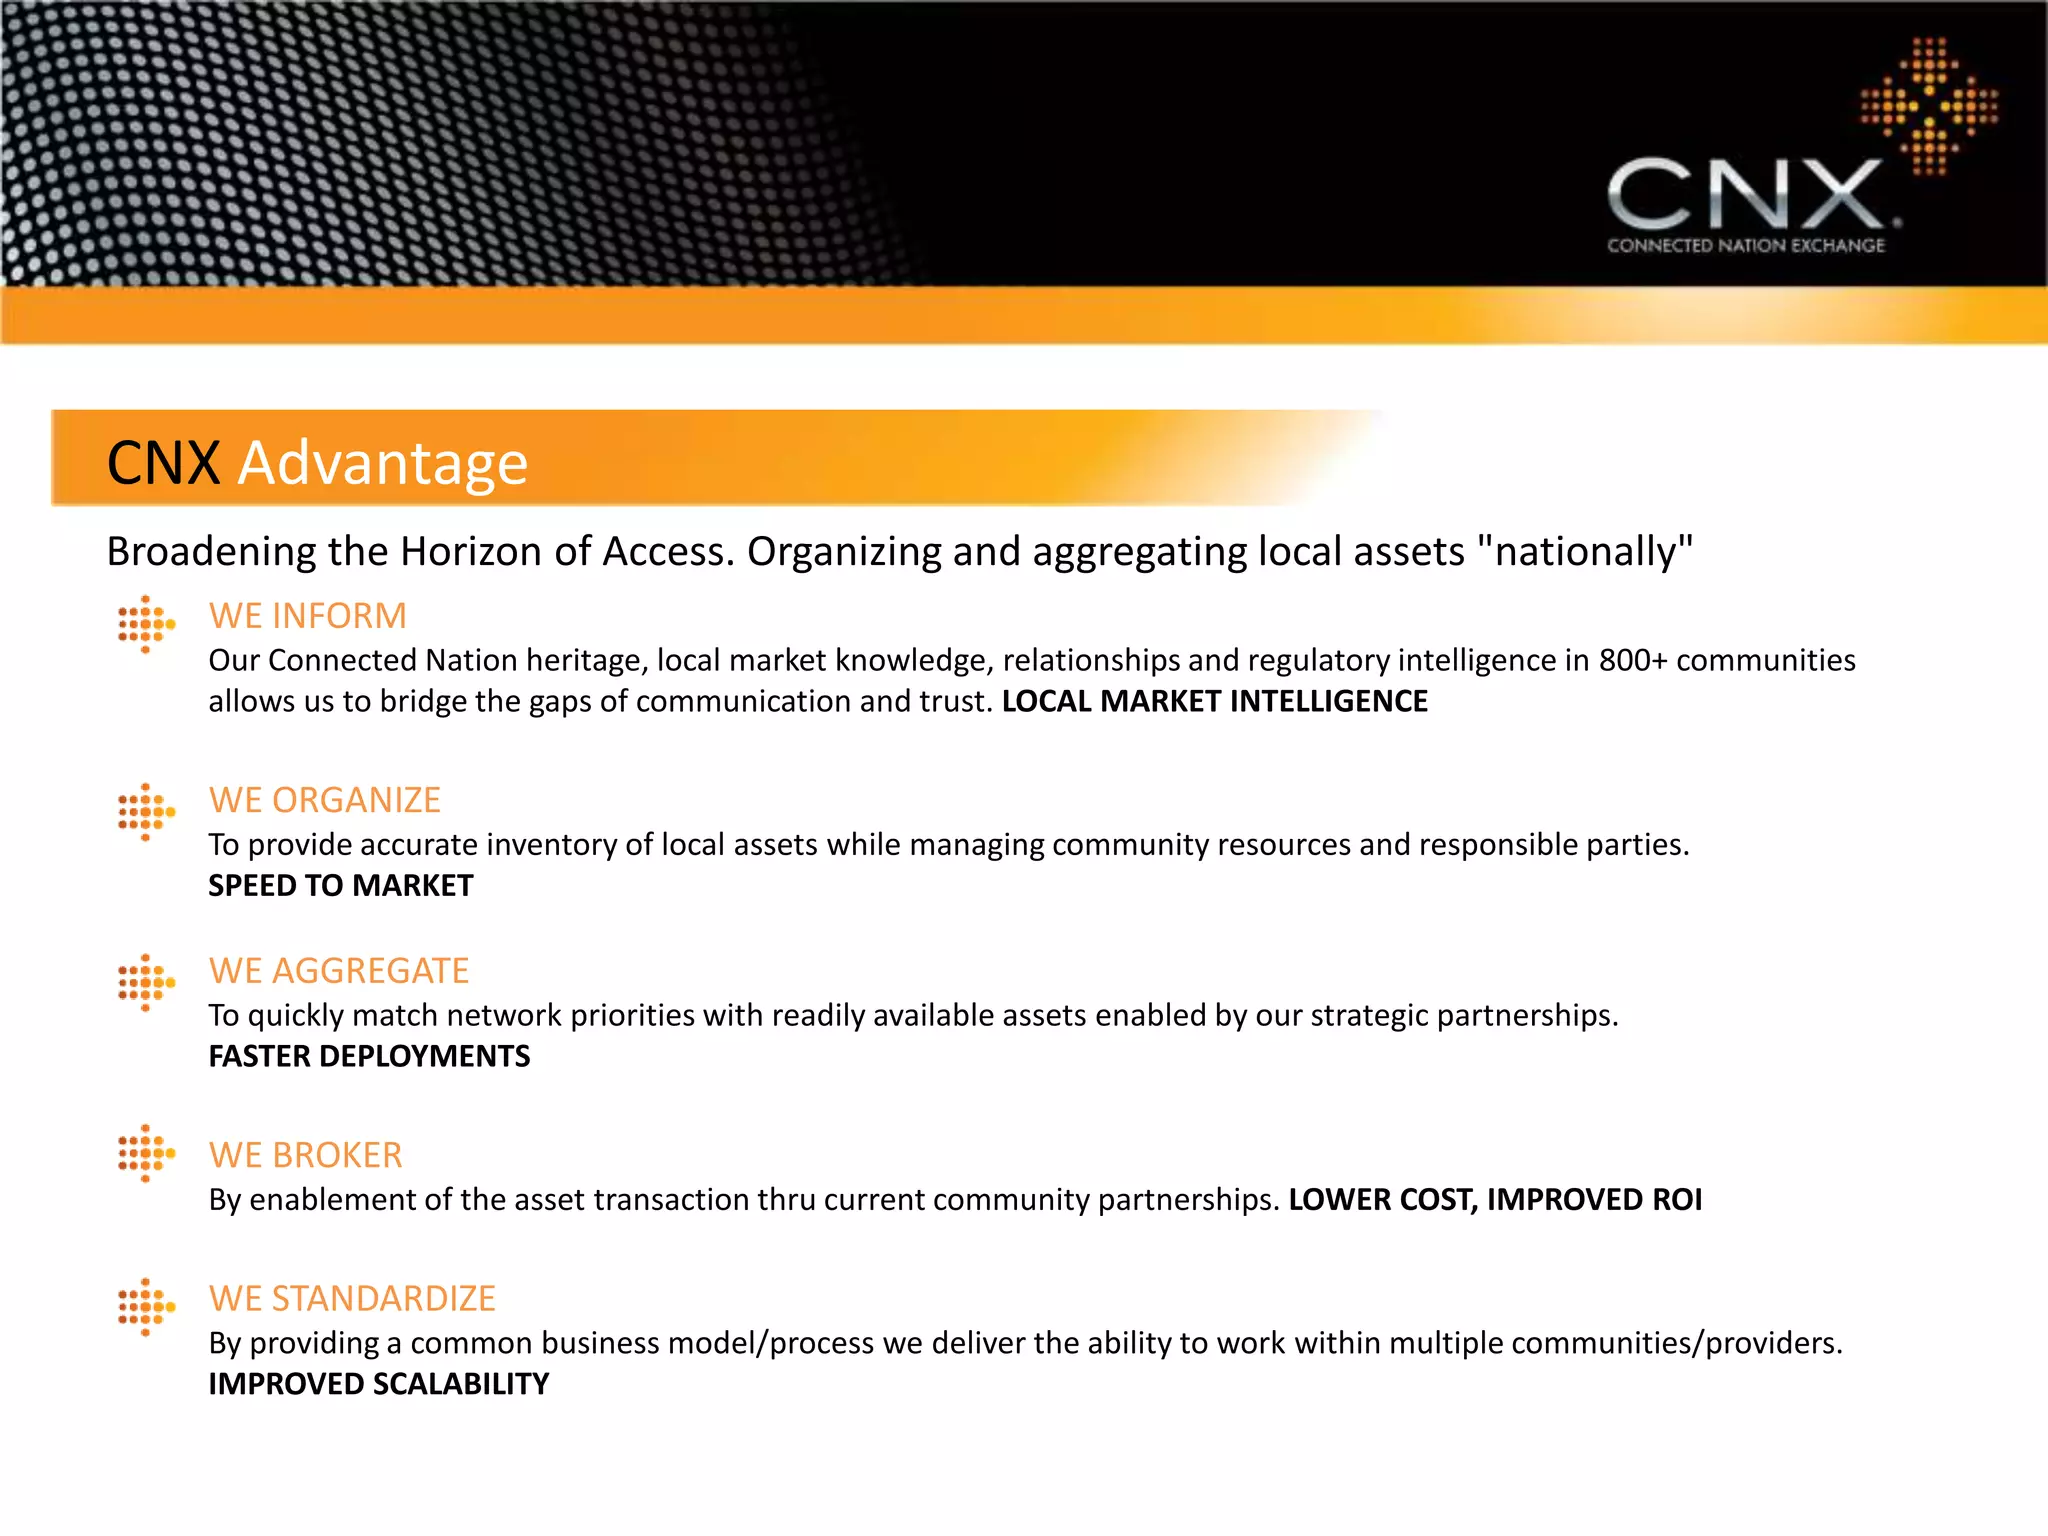
WHERE TECHNOLOGY COMPANIES & COMMUNITIES
                 COLLABORATE AND CONNECT
Mapping the Nation’s Digital Assets


Aggregating Valuable Assets for Communities

Cultivating Collaboration with Tech Companies


 Driving Market Growth & Local Competitiveness
Communities control many levers that
impact broadband investment equation

                                   • Vertical Assets
                                   • Rights of Way
                                   • Dark fiber
                                   • Pole attachment
                                   • Regulatory/burea
                                     ucracy costs
                                   • Demand
                                     aggregation
                                   • Partnerships
Case Study – Warren County KY
Market Data + Technical Data + Collaboration = Investment
THE MARKET
The Market
2012: 80 million smart phones in US growing at 25% per year

2012-2016 Broadband demand increased 25-35 times

2012: 250,000 cell towers estimated in US
      estimated growth of 7% per year through 2016

Macro Cell (Towers) are 2.5 – 8 times more expensive than Distributed
Antenna Systems (DAS) and Small Cell (Micro, Pico) Technologies

What does that tell us ?
THINK small
THE DAS & MICRO SMALL CELL MARKET

2010-2011: 23% YEAR OVER YEAR GROWTH

2012-2016: Revenue Growth from $100mm to $1.0B

Communities:

$1,500 – 2,500 common for new leases on community owned facilities
John W. Pestle, Varnum LLP


Strategic position for FirstNet implementation, economic development,
education, etc.
Site acquisition is the single barrier to expansion of networks
Operators know how to acquire sites for macro cells, from locating the best sites within search rings, to negotiating site
rental leases and management agreements. Many operators also have longstanding relationships with tower companies.
Metro cells, however, are not placed on towers or rooftops, but rather in new locations, such as lampposts, utility poles, and
on the interior and exterior walls of buildings. Another difference is that metro cells are deployed in mass, requiring the
acquisition of many sites all at once.


Forming strategic relationships or partnerships with
municipalities, utilities and other companies that own or have
access to infrastructure suitable for the deployment of metro
cells offers an effective means of doing this. Municipalities
own lampposts, traffic lights, and other structures.
By forming strategic relationships and partnerships, operators can negotiate right-to-use agreements with municipalities and
companies that have infrastructure within those targeted locations. This facilitates the availability of highly suitable sites
when metro cells need to be deployed. Additionally, by negotiating right-to-use agreements for many sites at one time, the
MSP is able to keep rental fees for individual sites low.

ALCATEL-LUCENT
Community Asset Mapping Process


      Identify & Organize

      Aggregate

      Assess & Inform

      Present & Promote

      Collaborate
CNX Advantage
Broadening the Horizon of Access. Organizing and aggregating local assets "nationally"
     WE INFORM
     Our Connected Nation heritage, local market knowledge, relationships and regulatory intelligence in 800+ communities
     allows us to bridge the gaps of communication and trust. LOCAL MARKET INTELLIGENCE

     WE ORGANIZE
     To provide accurate inventory of local assets while managing community resources and responsible parties.
     SPEED TO MARKET

     WE AGGREGATE
     To quickly match network priorities with readily available assets enabled by our strategic partnerships.
     FASTER DEPLOYMENTS

     WE BROKER
     By enablement of the asset transaction thru current community partnerships. LOWER COST, IMPROVED ROI

     WE STANDARDIZE
     By providing a common business model/process we deliver the ability to work within multiple communities/providers.
     IMPROVED SCALABILITY
InstalyticsTM
CNX POINT AND CLICK MAP SIMPLICITY FOR ASSETS, SPECS

      POINT AND CLICK MAP SIMPLICITY FOR ASSETS, MARKET SPECS


      HEAT MAPPING FOR MARKET ANALYSIS & TARGETING


      SINGLE POINT OF PROCUREMENT FOR FACILITY AGREEMENTS


      INTERACTIVE MARKET ANALYSIS TO VALIDATE ROI ASSUMPTIONS
CNX Presentation

CNX Presentation

  • 1.
    WHERE TECHNOLOGY COMPANIES& COMMUNITIES COLLABORATE AND CONNECT
  • 2.
    Mapping the Nation’sDigital Assets Aggregating Valuable Assets for Communities Cultivating Collaboration with Tech Companies Driving Market Growth & Local Competitiveness
  • 3.
    Communities control manylevers that impact broadband investment equation • Vertical Assets • Rights of Way • Dark fiber • Pole attachment • Regulatory/burea ucracy costs • Demand aggregation • Partnerships
  • 4.
    Case Study –Warren County KY
  • 5.
    Market Data +Technical Data + Collaboration = Investment
  • 6.
    THE MARKET The Market 2012:80 million smart phones in US growing at 25% per year 2012-2016 Broadband demand increased 25-35 times 2012: 250,000 cell towers estimated in US estimated growth of 7% per year through 2016 Macro Cell (Towers) are 2.5 – 8 times more expensive than Distributed Antenna Systems (DAS) and Small Cell (Micro, Pico) Technologies What does that tell us ?
  • 7.
  • 8.
    THE DAS &MICRO SMALL CELL MARKET 2010-2011: 23% YEAR OVER YEAR GROWTH 2012-2016: Revenue Growth from $100mm to $1.0B Communities: $1,500 – 2,500 common for new leases on community owned facilities John W. Pestle, Varnum LLP Strategic position for FirstNet implementation, economic development, education, etc.
  • 9.
    Site acquisition isthe single barrier to expansion of networks Operators know how to acquire sites for macro cells, from locating the best sites within search rings, to negotiating site rental leases and management agreements. Many operators also have longstanding relationships with tower companies. Metro cells, however, are not placed on towers or rooftops, but rather in new locations, such as lampposts, utility poles, and on the interior and exterior walls of buildings. Another difference is that metro cells are deployed in mass, requiring the acquisition of many sites all at once. Forming strategic relationships or partnerships with municipalities, utilities and other companies that own or have access to infrastructure suitable for the deployment of metro cells offers an effective means of doing this. Municipalities own lampposts, traffic lights, and other structures. By forming strategic relationships and partnerships, operators can negotiate right-to-use agreements with municipalities and companies that have infrastructure within those targeted locations. This facilitates the availability of highly suitable sites when metro cells need to be deployed. Additionally, by negotiating right-to-use agreements for many sites at one time, the MSP is able to keep rental fees for individual sites low. ALCATEL-LUCENT
  • 10.
    Community Asset MappingProcess Identify & Organize Aggregate Assess & Inform Present & Promote Collaborate
  • 11.
    CNX Advantage Broadening theHorizon of Access. Organizing and aggregating local assets "nationally" WE INFORM Our Connected Nation heritage, local market knowledge, relationships and regulatory intelligence in 800+ communities allows us to bridge the gaps of communication and trust. LOCAL MARKET INTELLIGENCE WE ORGANIZE To provide accurate inventory of local assets while managing community resources and responsible parties. SPEED TO MARKET WE AGGREGATE To quickly match network priorities with readily available assets enabled by our strategic partnerships. FASTER DEPLOYMENTS WE BROKER By enablement of the asset transaction thru current community partnerships. LOWER COST, IMPROVED ROI WE STANDARDIZE By providing a common business model/process we deliver the ability to work within multiple communities/providers. IMPROVED SCALABILITY
  • 12.
    InstalyticsTM CNX POINT ANDCLICK MAP SIMPLICITY FOR ASSETS, SPECS POINT AND CLICK MAP SIMPLICITY FOR ASSETS, MARKET SPECS HEAT MAPPING FOR MARKET ANALYSIS & TARGETING SINGLE POINT OF PROCUREMENT FOR FACILITY AGREEMENTS INTERACTIVE MARKET ANALYSIS TO VALIDATE ROI ASSUMPTIONS