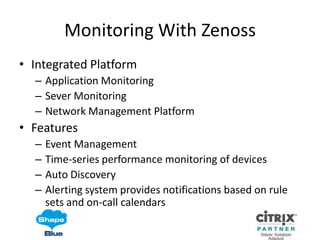
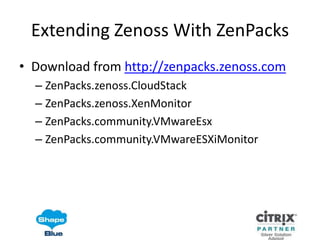
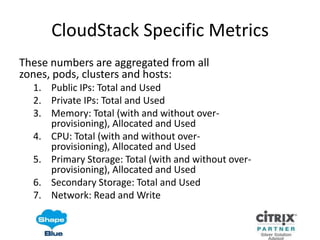
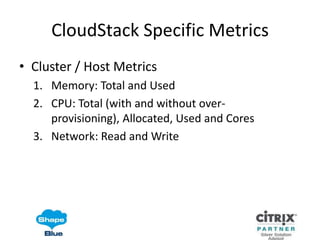
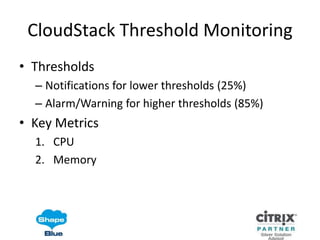
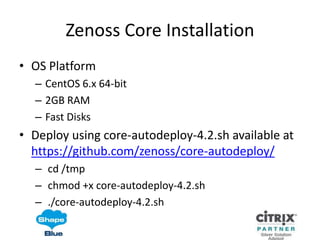
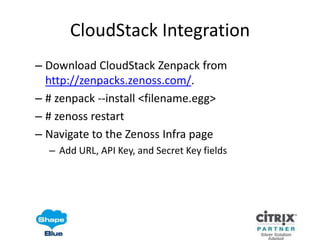
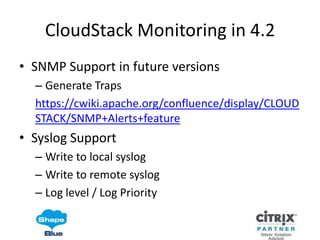
Zenoss Core is an open source network monitoring tool based on the Zope application server. It provides a web interface for system administrators to monitor availability, inventory, performance, and events of network devices. Zenoss Core uses technologies like Zope, Python, Net-SNMP, RRDtool, MySQL, and Twisted. It can monitor the availability of network devices using protocols like SNMP, SSH, and WMI. It also monitors network services and host resources. Zenoss Core automatically discovers network resources and changes and includes alerting rules and notifications. It has a flexible architecture with user, collection, and data layers and uses daemons to gather device information.
The NRPE addon allows Nagios to monitor local resources on remote Linux/Unix machines. It consists of the check_nrpe plugin on the monitoring machine and the NRPE daemon on remote machines. When Nagios needs to check a remote resource, the check_nrpe plugin contacts the NRPE daemon, which runs the plugin and returns results to Nagios via the check_nrpe plugin. NRPE allows monitoring of both direct local resources like CPU and memory usage as well as indirect checks of services reachable by the remote machine but not the monitoring host.
### Delivered at grrcon.com ###
One of the primary data sources we use on the Splunk Security Research Team is attack data collected from various corners of the globe. We often obtain this data in the wild using honeypots, with the goal of uncovering new or unusual attack techniques and other malicious activities for research purposes. The nirvana state is a honeypot tailored to mimic the kind of attack/attacker you are hoping to study. To do this effectively, the honeypot must very closely resemble a legitimate system. As a principal security research at Splunk, co-founder of Zenedge (Now part of Oracle), and Security Architect at Akamai I have spent many years protecting organizations from targeted as well as internet-wide attacks, and honeypots has been extremely useful (at times better than threat intel) tool at capturing and studying active malicious actors.
In this talk, I aim to provide an introduction to honeypots, explain some of the experiences and lessons learned we have had running Cowrie a medium interaction SSH honeypot base on Kippo. How we modified cowrie to make it more realistic and mimic the systems and attack we are trying to capture as well as our approach for the next generation of honeypots we plan to use in our research work. The audience in this talk will learn how to deploy and use cowrie honeypot as a defense mechanism in their organization. Also, we will share techniques on how to modify cowrie in order to masquerade different systems and vulnerabilities mimicking the asset(s) being defended. Finally, share example data produced by the honeypot and analytic techniques that can be used as feedback to improve the deployed honeypot. We will close off the talk by sharing thoughts on how we are evolving our approach for capturing attack data using honeypots and why.
This document provides instructions for installing Zenoss Core Beta release 5.0.0b2, which introduces Zenoss Control Center. It describes installing Zenoss Control Center on a master host with certain requirements and preparing additional resource pool hosts. The steps include installing Docker, adding Zenoss repositories, and configuring the serviced daemon. Optional configuration allows multi-host deployment across resource pools.
Managing Oracle Enterprise Manager Cloud Control 12c with Oracle ClusterwareLeighton Nelson
This document provides an overview of managing Oracle Enterprise Manager Cloud Control 12c with high availability using Oracle Clusterware. It discusses the different levels of high availability for OEM and focuses on level 2 active/passive configuration using a virtual IP address. It covers setting up Oracle Clusterware, installing OEM on shared storage, and configuring the failover and management repository.
## Talk delivered at artintoscience.com ##
One of the primary data sources we use on the Splunk Security Research Team is attack data collected from various corners of the globe. We often obtain this data in the wild using honeypots, with the goal of uncovering new or unusual attack techniques and other malicious activities for research purposes. The nirvana state is a honeypot tailored to mimic the kind of attack/attacker you are hoping to study. To do this effectively, the honeypot must very closely resemble a legitimate system. As a principal security research at Splunk, co-founder of Zenedge (Now part of Oracle), and Security Architect at Akamai I have spent many years protecting organizations from targeted as well as internet-wide attacks, and honeypots has been extremely useful (at times better than threat intel) tool at capturing and studying active malicious actors.
In this talk, I aim to provide an introduction to honeypots, explain some of the experiences and lessons learned we have had running Cowrie a medium interaction SSH honeypot base on Kippo. How we modified cowrie to make it more realistic and mimic the systems and attack we are trying to capture as well as our approach for the next generation of honeypots we plan to use in our research work. The audience in this talk will learn how to deploy and use cowrie honeypot as a defense mechanism in their organization. Also, we will share techniques on how to modify cowrie in order to masquerade different systems and vulnerabilities mimicking the asset(s) being defended. Finally, share example data produced by the honeypot and analytic techniques that can be used as feedback to improve the deployed honeypot. We will close off the talk by sharing thoughts on how we are evolving our approach for capturing attack data using honeypots and why.
2015.10.05 Updated > Network Device Development - Part 1: SwitchCheng-Yi Yu
This document provides instructions for setting up a network development environment using a Debian virtual machine. It includes choosing a board and operating system, installing Debian in a VMware virtual machine, configuring virtual networks, developing and installing simple kernel modules to test network functionality, and modifying kernel modules to implement basic firewall rules.
Boris Stoyanov - Troubleshooting the Virtual Router - Run and Get DiagnosticsShapeBlue
Demonstration of CloudStack’s latest features for troubleshooting the Virtual Router connectivity and configuration, called Run and Get Diagnostics. Run Diagnostics gives the admin ability to execute diagnostics commands native the VR OS directly from the CloudStack UI. Admin is able to determine connectivity capabilities of the VR without logging into the SystemVM at all. Get diagnostics feature allow the admin to gather information about the SystemVM as fast as clicking on a button in the ‘QuickView’ of the VM. Admin can also execute custom scripts on each SystemVM type from the CloudStack UI. This session will begin with complete presentation of the features followed by live demo and Q&A.
2015.10.05 Updated > Network Device Development - Part 2: Firewall 101Cheng-Yi Yu
This document provides an overview of building a basic firewall. It describes setting up two virtual networks, VMnet2 and VMnet3, with Ubuntu clients on each. A Debian switch is configured with NAT between VMnet1 and the external network. The document explains how to use socket buffers and manipulate packet headers to implement a firewall. It outlines moving between layers 2, 3 and 4 to inspect packets and check protocols, ports, and IP addresses to allow or block traffic between the two virtual networks. The next steps involve modifying the main.c file to implement the firewall rules and testing connectivity between the VMnet clients.
The document discusses making OpenStack controller core services highly available. It describes using Pacemaker and Corosync to manage virtual IP addresses and services across multiple nodes. HAProxy is used as a load balancer between the virtual IPs and service instances. The database uses Galera cluster for multi-master replication. RabbitMQ and Memcached are made highly available through clustering as well. Failure scenarios are tested by stopping nodes and services.
The document discusses configuring auto backup in Ceph storage integrated with OpenStack. The objectives are to research OpenStack and Ceph, configure them, and integrate Ceph storage with OpenStack. Ceph will be configured to allow automated backups of data through task scheduling. Limitations around monitoring the backup system will be addressed. The methodology involves installing required software, configuring OpenStack and Ceph, integrating them, and testing automatic backups in Ceph through OpenStack. The expected results are that Ceph can backup data based on a schedule, backed up data can be restored, and data is more secure through automatic backups.
Black Hat 2015 Arsenal: Noriben Malware AnalysisBrian Baskin
This document describes Noriben, a simple malware analysis sandbox that wraps the Process Monitor tool to log processes, file activity, registry activity, and network activity of suspicious files. It aims to provide quick analysis results while allowing flexibility. Key features include filtering out known benign activity, importing YARA signatures to scan files, querying VirusTotal APIs to retrieve file hashes, and generating timelines of events for automated analysis. The goal is to concisely show precise indicators of compromise without excessive noise.
This document provides a step-by-step guide to installing and configuring a secure Linux-based web, DNS, and mail server. The key aspects summarized are:
1) An Openna Linux 1.0 installation is performed and secured, adding firewall, intrusion detection, and chroot jailing of services.
2) Popular internet services like Apache, BIND, Qmail, MySQL, and Snort are installed and hardened through configuration of access controls, passwords, and file permissions.
3) Additional security tools like AIDE and log monitoring are implemented to detect intrusions and limit damage from any potential cracks.
- OpenStack Neutron has faced issues with scalability and single points of failure that have led many users to rely on external network controllers instead of Neutron alone.
- OpenDaylight is an open source SDN platform that provides network abstractions and frameworks for programming network elements. It has emerged as a popular external network controller integrated with Neutron deployments.
- In the Icehouse release, OpenStack integrated OpenDaylight through a mechanism driver to connect Neutron to OpenDaylight for network provisioning using technologies like VxLAN and GRE. This allows Neutron to leverage OpenDaylight's capabilities for improved scalability and reliability.
Cyber Range - Blackhat Europe 19 ArsenalTom Cappetta
This document provides instructions for setting up a cyber range using tools like Terraform, Vagrant, and Inspec. It describes using Terraform to set up the network and range infrastructure, and using Vagrant to start and stop virtual machines like Kali Linux and Commando. It also provides details on accessing machines via SSH, RDP, and VNC after deployment and instructions for creating different scenario types in the range.
Cyber Range - An Open-Source Offensive / Defensive Learning Environment on AWS Tom Cappetta
This is the presentation of the SecDevOps-Cuse/CyberRange project. A project which aims to provide security researchers with a bootstrapped solution for building a personal research lab full of vulnerable assets, researcher tools, and well-known technologies like Nessus, Metasploit, FlareVM + many more...
How To Deploy A Cloud Based Webserver in 5 minutes - LAMPMatt Dunlap
Simple tutorial showing how easy it is to deploy a cloud based webserver with apache, mysql and php in about 5 minutes. You can also watch the video for this slideshow at http://www.youtube.com/watch?v=3eqUZ6fzpOM
This document provides instructions for installing the latest OpenStack code using DevStack with either Nova network or Neutron network. The instructions include downloading DevStack, adding a stack user, giving permissions to the DevStack folder, and running stack.sh to install with Nova network. Alternatively, a local.conf file can be created to specify configuration options for installing with Neutron network instead.
Real-time Cloud Management with SaltStackSaltStack
Seth House, SaltStack senior engineer, presented at the first Rackspace Unlocked.io event in New York City the week of Cloud Expo. His presentation titled, "Real-time cloud management with SaltStack" is provided here.
This document provides instructions for installing OpenStack Mitaka on a single node using Packstack. The steps include disabling NetworkManager and firewall services, installing the RDO repository RPM, updating packages, installing Packstack, and using Packstack to deploy the latest OpenStack Mitaka in all-in-one mode with a single command.
This document provides guidance on hardening a Linux server for security. It recommends following the CIS and NSA security benchmarks. It suggests choosing a server-oriented Linux distribution, keeping partitions and filesystems separate, encrypting partitions and the running server, securing the boot process, using iptables and TCP wrappers for firewalls, restricting root access and using sudo, enforcing password policies, removing unnecessary packages and services, securing remote administration like SSH, disabling unnecessary Linux modules, and implementing auditing and integrity checks.
Apache CloudStack is open source software for building public, private and hybrid Infrastructure as a Service (IaaS) clouds. The source code is organized into directories that separate core functionality, APIs, plugins, compatibility layers and more. Key directories include Utils, Api, Core, Server, Plugins, Awsapi, Usage, Ui, Agent and Client. Additional information on CloudStack can be found on its website and Apache mailing lists.
CloudStack Metering – Working with the Usage DataShapeBlue
Organisations looking to build and offer Cloud services on Apache CloudStack need to be able to either monetize their offerings and charge for usage or monitor and report on their Cloud's consumption.
Majority of such organisations already have existing billing or business support systems and do not require an integrated billing or reporting system, provided the usage data can be exported from CloudStack in a standard and structured format such as XML, JSON, or CSV.
Tariq Iqbal of ShapeBlue provides an overview of the Apache CloudStack Usage Metrics, Usage Server and the multitude of ways for accessing the Usage Data for billing and reporting purposes, including real world use cases of some of the integration projects he has worked on.
Webinar widescreen zenoss service-now integration final draftZenoss
Join us for this interactive session to learn how today's leading IT organizations are identifying and resolving IT service disruptions faster than the CEO can ask you, "What's happening?"
CloudStack Metering – Working with the Usage DataTariq Iqbal
Organisations looking to build and offer Cloud services on Apache CloudStack need to be able to either monetize their offerings and charge for usage or monitor and report on their Cloud's consumption.
Majority of such organisations already have existing billing or business support systems and do not require an integrated billing or reporting system, provided the usage data can be exported from CloudStack in a standard and structured format such as XML, JSON, or CSV.
Tariq Iqbal of ShapeBlue provides an overview of the Apache CloudStack Usage Metrics, Usage Server and the multitude of ways for accessing the Usage Data for billing and reporting purposes, including real world use cases of some of the integration projects he has worked on.
Jason Stanley, Secure-24 - Own IT Through Proactive IT MonitoringZenoss
Secure-24 uses Zenoss as its primary monitoring tool to monitor over 9,000 devices and 1.7 million data points. It monitors key components of the Zenoss infrastructure like Zenoss daemons, RabbitMQ queues, and the event processing system to ensure proper functioning. Checks include looking for process/heartbeat issues, queue lengths in RabbitMQ, and testing event opening, processing, and closing to verify the full event flow. Remote monitoring is emphasized in case the primary Zenoss system goes down.
How to add a new hypervisor to CloudStack - Lessons learned from Hyper-V effortShapeBlue
This document discusses lessons learned from developing a plugin to add Hyper-V hypervisor support to CloudStack. Key lessons include using HTTPRequest to escape Java's limits, serializing JSON objects instead of porting Java classes, writing code with test-driven development, automating tasks with CloudMonkey, adapting existing plugins where possible, using QuickCloud instead of system VMs, and avoiding proprietary tools and libraries. The plugin extends CloudStack using plugins, includes a ServerResource for device access, and implements the hypervisor API via a remote or direct connect agent.
The document discusses integrating the monitoring system Zenoss with the ticketing system ServiceNow for incident management and configuration management database (CMDB) purposes. It describes why customers would want each integration, what features the integrations provide, and how the integrations work technically. The incident management integration allows for automated ticket creation and updating based on monitoring events. The CMDB integration syncs device and component data between the two systems.
This document provides an overview of Zenoss and describes how to use its key features to monitor IT infrastructure, including adding and discovering devices, modeling devices, working with events, customizing the dashboard, and configuring alerts and performance monitoring. It covers Zenoss's architecture, interface, core monitoring capabilities like availability and performance monitoring, and event and configuration management.
The Open source market is getting overcrowded with different Network monitoring solutions, and not without reason, monitoring your infrastructure become more important each day, you have to know what's going on for your boss, your customers and for yourself. Nagios started the evolution, but today OpenNMS, Zabix, Zenoss, Groundworks, Hyperic and different others are showing up in the market. Do you want lightweight, or feature full, how far do you want to go with your monitoring, just on os level, or do you want to dig into your applications, do you want to know how many query per seconds your MySQL database is serving, or do you want to know about the internal state of your JBoss, or be triggered if the OOM killer will start working soon. This presentation will guide the audience trough the different alternatives, based on our experiences in the field. We will be looking both at alerting and trending and how easy or difficult it is to deploy such an environment.
This document summarizes several Apache Java cloud projects: CloudStack, jclouds, and Whirr. It discusses how they work together and what each can do. CloudStack is an open source IaaS cloud platform. jclouds provides a common Java API to interact with multiple cloud providers. Whirr is a tool built on jclouds that allows deploying distributed systems on clouds. Specifically, Whirr can deploy Hadoop clusters on CloudStack using jclouds in an automated and cloud-agnostic way. The document demonstrates using Whirr to deploy a Cloudera Hadoop cluster managed by Cloudera Manager.
Wissbi is an open source toolset for building distributed event processing pipelines easily. It provides basic commands like wissbi-sub and wissbi-pub that allow receiving and sending messages. Filters can be written in any language and run in parallel as daemon processes configured through files. This allows constructing complex multi-stage data workflows. The ecosystem also includes tools like a log collector and metric collector that use Wissbi for transport. It aims to minimize operating effort through a simple design that relies mainly on filesystem operations and standard Unix tools and commands.
With the focus on security, most organisations test the security defenses via pen-testing. But what about after the network has been compromised. Is there an Advance Persistent Threat (APT) sitting on the network? Will the defenses be able to detect this?
This talk will discuss some of the open source tools that can help simulate this threat. So as to test the security defenses if an APT makes it onto the network.
An introduction to Linux Container, Namespace & Cgroup.
Virtual Machine, Linux operating principles. Application constraint execution environment. Isolate application working environment.
Namespaces, Cgroups and systemd document discusses:
1. Namespaces and cgroups which provide isolation and resource management capabilities in Linux.
2. Systemd which is a system and service manager that aims to boot faster and improve dependencies between services.
3. Key components of systemd include unit files, systemctl, and tools to manage services, devices, mounts and other resources.
The document provides best practices for deploying SUSE CaaS Platform. It discusses requirements like hardware needs, software subscriptions required, and support options. It covers planning and sizing considerations like cluster topology and disk space needs. Deployment best practices include steps like preparing the infrastructure, installing base software, verifying the infrastructure, installing CaaS Platform, and deploying Kubernetes addons. Testing and operations topics like monitoring, logging, backups are also covered.
Platform Security Summit 18: Xen Security Weather Report 2018The Linux Foundation
The Xen Project is unique in its breadth of adoption and diverse contributions. Many vendors in the ecosystem are not directly competing, enabling collaboration which otherwise would not be possible. While hypervisors were once seen as purely cloud and server technologies, they are now used in many market segments to add compartmentalization and layers of security. This has led to renewed focus on older technologies, such as L4Re/seL4 and new technologies such as zircon, ACRN and others.
Meanwhile, the Xen Project has been trailblazing in adopting virtualization in new market segments and continues to innovate and set the direction for the industry. This has enabled downstream Xen developers to build viable businesses and products in areas such as security and embedded. This talk will cover Xen feature changes that are driven by security needs, and the challenges of safety certification within the context of open source projects and Xen Project in particular.
Codership's galera cluster installation and quickstart webinar march 2016Sakari Keskitalo
In this webinar, we will describe how to get started with Galera Cluster and build a functional multi-master cluster. First, will show how to easily install the required packages using the new preferred installation method – the dedicated Galera package repository. Then we will discuss the important Galera configuration settings and how to select values for them. Finally, we will demonstrate how to bootstrap a 3-node Galera installation with the right sequence of steps.
Once the nodes are up and running we will discuss how to monitor the health of the cluster and which status variables are important to watch.
Galera Cluster is trusted by thousands of users. Galera Cluster powers Percona XtraDB Cluster and MariaDB Enterprise Cluster. This is a webinar presented by Codership, the developers and experts of Galera Cluster.
Codership's galera cluster installation and quickstart webinar march 2016Sakari Keskitalo
In this webinar, we will describe how to get started with Galera Cluster and build a functional multi-master cluster. First, will show how to easily install the required packages using the new preferred installation method – the dedicated Galera package repository. Then we will discuss the important Galera configuration settings and how to select values for them. Finally, we will demonstrate how to bootstrap a 3-node Galera installation with the right sequence of steps.
Once the nodes are up and running we will discuss how to monitor the health of the cluster and which status variables are important to watch.
Galera Cluster is trusted by thousands of users. Galera Cluster powers Percona XtraDB Cluster and MariaDB Enterprise Cluster. This is a webinar presented by Codership, the developers and experts of Galera Cluster.
The document provides an overview of the Linux operating system, including:
- An introduction to Linux and its history as an open-source clone of UNIX.
- Descriptions of Linux's core functionality like multi-user support and virtual memory.
- Discussions of key Linux components like kernels, distributions, packages, and updates.
- Explanations of enterprise-level Linux features around performance, scalability, and reliability.
Hyper-V best practices document provides recommendations in three main areas:
1. Host server hardware configuration including standardized hardware, latest drivers, and optimized power settings.
2. Hyper-V installation and configuration including roles, features, paths, and antivirus exclusions.
3. Virtual machine configuration best practices such as Generation 2 VMs, optimized devices, and automatic stop settings.
The document provides an overview of operating systems, including:
1. An operating system acts as a virtual machine that hides complex hardware details and provides services through system calls. It manages resources like time and memory allocation.
2. Core OS functions include process management, I/O device control, resource access control, error handling, and accounting. The kernel contains frequently used functions and privileges.
3. Early systems used serial processing but evolved to batch processing, multiprocessing, time-sharing, and today's graphical user interfaces across networks.
ICALEPCS 2011: Testing Environments using VirtualizationOmer Khalid
This document summarizes the implementation of a private cloud infrastructure at CERN using virtualization and cloud computing technologies. It describes using virtualization to create a library of virtual machine images running different operating systems and software configurations. An image service was developed to cache and deploy these VM images across physical servers to minimize deployment time. Evaluation of different storage models showed local caching of images optimized deployment times, allowing new VMs to be provisioned within 30 minutes to quickly support various testing use cases at CERN.
The document provides an overview of various cloud computing, big data, and web development projects. It summarizes achievements in cloud infrastructure using OpenStack and OpenShift, building Hadoop clusters for big data analytics, and developing web applications. It outlines next steps of integrating OpenShift with OpenStack, implementing real-time data processing using HBase, and automating matching between farmers and food processors for a web application.
XPDS14 - Zero-Footprint Guest Memory Introspection from Xen - Mihai Dontu, Bi...The Linux Foundation
This presentation will detail a practical approach to memory introspection of virtual machines running on the Xen hypervisor with no in-guest footprint. The functionality makes use of the mem-event API with a number of improvements which enable the proper tracking of guest OS activity. The technology created on top of this Xen API opens the door for several immediate applications, including: rootkit detection and prevention, detection and action on several categories of malware, and event source information for low-level post-event forensics and correlation based on real event data during events.
Prioritizing Complexities of Enterprise Kubernetes.pdfKedarnath76
The use of containers across development, testing and production environments has skyrocketed in the last few years, in part because of new tools that make it easier to deploy, scale and manage cloud native applications. According to a survey by the Cloud Native Computing Foundation, developers have more than 100 of these tools to choose from yet 89% are using some form of Kubernetes.Google’s open source container orchestration project certainly has its advantages — automation being one of the biggest. Kubernetes takes the intensive, time-consuming manual labor out of container management, by automating the deployment and distribution of application services, the allocation of resources for application services, application network configurations and even load balancing across distributed infrastructure. As a result, lean teams can efficiently deploy and manage a significant amount of infrastructure and teams of all sizes can do so with greater operational velocity.
Kubernetes runs containers nearly anywhere because it creates abstraction at the infrastructure layer. This improves scalability and simplifies sharing and decision-making for teams working across multiple platforms and resources — from cloud to virtual machines to bare metal. DevOps teams can focus on building applications instead of managing the underlying infrastructure. It also has built-in mechanisms for resilience, including features like high availability, automated failover, and the ability to decommission, replicate and spin up new containers and services to essentially self-heal.
Because Kubernetes is open source, there are ample resources and documentation, and teams can integrate easily with a number of other tools in the ecosystem. With all of these benefits, it’s the silver bullet we’ve all been waiting for — or is it?Kubernetes Comes with Trade-offs
While known for its features that simplify development, the orchestration platform itself can be extremely difficult to implement and manage. Many important functions and configurations require significant time and understanding to set up. Kubernetes “out of the box” is essentially a cluster with a set of nodes to run containerized applications.Critical components (like DNS, user dashboard, and monitoring) are add-ons, and nearly all features require integrations through application programming interfaces. Managing this aspect alone can increase complexity exponentially because, without appropriate prioritization, surges in API calls can block important requests or crash the API server entirely.
There are also numerous ways to implement and use Kubernetes, such as how to access clusters (service discovery) and load balancing between pods. This becomes a problem for large distributed organizations with multiple teams sharing resources. The vast array of options and approaches to managing the platform can be overwhelming, creating additional complexity and discord.
Similarly, the automation features can create problems so
Deploying and managing SolrCloud in the cloud using the Solr Scale Toolkitthelabdude
SolrCloud is a set of features in Apache Solr that enable elastic scaling of search indexes using sharding and replication. In this presentation, Tim Potter will demonstrate how to provision, configure, and manage a SolrCloud cluster in Amazon EC2, using a Fabric/boto based solution for automating SolrCloud operations. Attendees will come away with a solid understanding of how to operate a large-scale Solr cluster, as well as tools to help them do it. Tim will also demonstrate these tools live during his presentation. Covered technologies, include: Apache Solr, Apache ZooKeeper, Linux, Python, Fabric, boto, Apache Kafka, Apache JMeter.
Systemd is a system and service manager that replaces traditional init systems. It improves boot performance by starting processes in parallel using socket and bus activation. Systemd manages units which describe system services, sockets, mounts, and other system components. It provides service management, resource management using cgroups, log management using its journal, snapshot capabilities, and targets to define system states.
Similar to Cloud stack monitoring with zenoss (20)
Have you ever been confused by the myriad of choices offered by AWS for hosting a website or an API?
Lambda, Elastic Beanstalk, Lightsail, Amplify, S3 (and more!) can each host websites + APIs. But which one should we choose?
Which one is cheapest? Which one is fastest? Which one will scale to meet our needs?
Join me in this session as we dive into each AWS hosting service to determine which one is best for your scenario and explain why!
Monitoring and Managing Anomaly Detection on OpenShift.pdfTosin Akinosho
Monitoring and Managing Anomaly Detection on OpenShift
Overview
Dive into the world of anomaly detection on edge devices with our comprehensive hands-on tutorial. This SlideShare presentation will guide you through the entire process, from data collection and model training to edge deployment and real-time monitoring. Perfect for those looking to implement robust anomaly detection systems on resource-constrained IoT/edge devices.
Key Topics Covered
1. Introduction to Anomaly Detection
- Understand the fundamentals of anomaly detection and its importance in identifying unusual behavior or failures in systems.
2. Understanding Edge (IoT)
- Learn about edge computing and IoT, and how they enable real-time data processing and decision-making at the source.
3. What is ArgoCD?
- Discover ArgoCD, a declarative, GitOps continuous delivery tool for Kubernetes, and its role in deploying applications on edge devices.
4. Deployment Using ArgoCD for Edge Devices
- Step-by-step guide on deploying anomaly detection models on edge devices using ArgoCD.
5. Introduction to Apache Kafka and S3
- Explore Apache Kafka for real-time data streaming and Amazon S3 for scalable storage solutions.
6. Viewing Kafka Messages in the Data Lake
- Learn how to view and analyze Kafka messages stored in a data lake for better insights.
7. What is Prometheus?
- Get to know Prometheus, an open-source monitoring and alerting toolkit, and its application in monitoring edge devices.
8. Monitoring Application Metrics with Prometheus
- Detailed instructions on setting up Prometheus to monitor the performance and health of your anomaly detection system.
9. What is Camel K?
- Introduction to Camel K, a lightweight integration framework built on Apache Camel, designed for Kubernetes.
10. Configuring Camel K Integrations for Data Pipelines
- Learn how to configure Camel K for seamless data pipeline integrations in your anomaly detection workflow.
11. What is a Jupyter Notebook?
- Overview of Jupyter Notebooks, an open-source web application for creating and sharing documents with live code, equations, visualizations, and narrative text.
12. Jupyter Notebooks with Code Examples
- Hands-on examples and code snippets in Jupyter Notebooks to help you implement and test anomaly detection models.
“An Outlook of the Ongoing and Future Relationship between Blockchain Technologies and Process-aware Information Systems.” Invited talk at the joint workshop on Blockchain for Information Systems (BC4IS) and Blockchain for Trusted Data Sharing (B4TDS), co-located with with the 36th International Conference on Advanced Information Systems Engineering (CAiSE), 3 June 2024, Limassol, Cyprus.
Things to Consider When Choosing a Website Developer for your Website | FODUUFODUU
Choosing the right website developer is crucial for your business. This article covers essential factors to consider, including experience, portfolio, technical skills, communication, pricing, reputation & reviews, cost and budget considerations and post-launch support. Make an informed decision to ensure your website meets your business goals.
Fueling AI with Great Data with Airbyte WebinarZilliz
This talk will focus on how to collect data from a variety of sources, leveraging this data for RAG and other GenAI use cases, and finally charting your course to productionalization.
Climate Impact of Software Testing at Nordic Testing DaysKari Kakkonen
My slides at Nordic Testing Days 6.6.2024
Climate impact / sustainability of software testing discussed on the talk. ICT and testing must carry their part of global responsibility to help with the climat warming. We can minimize the carbon footprint but we can also have a carbon handprint, a positive impact on the climate. Quality characteristics can be added with sustainability, and then measured continuously. Test environments can be used less, and in smaller scale and on demand. Test techniques can be used in optimizing or minimizing number of tests. Test automation can be used to speed up testing.
AI 101: An Introduction to the Basics and Impact of Artificial IntelligenceIndexBug
Imagine a world where machines not only perform tasks but also learn, adapt, and make decisions. This is the promise of Artificial Intelligence (AI), a technology that's not just enhancing our lives but revolutionizing entire industries.
Full-RAG: A modern architecture for hyper-personalizationZilliz
Mike Del Balso, CEO & Co-Founder at Tecton, presents "Full RAG," a novel approach to AI recommendation systems, aiming to push beyond the limitations of traditional models through a deep integration of contextual insights and real-time data, leveraging the Retrieval-Augmented Generation architecture. This talk will outline Full RAG's potential to significantly enhance personalization, address engineering challenges such as data management and model training, and introduce data enrichment with reranking as a key solution. Attendees will gain crucial insights into the importance of hyperpersonalization in AI, the capabilities of Full RAG for advanced personalization, and strategies for managing complex data integrations for deploying cutting-edge AI solutions.
AI-Powered Food Delivery Transforming App Development in Saudi Arabia.pdfTechgropse Pvt.Ltd.
In this blog post, we'll delve into the intersection of AI and app development in Saudi Arabia, focusing on the food delivery sector. We'll explore how AI is revolutionizing the way Saudi consumers order food, how restaurants manage their operations, and how delivery partners navigate the bustling streets of cities like Riyadh, Jeddah, and Dammam. Through real-world case studies, we'll showcase how leading Saudi food delivery apps are leveraging AI to redefine convenience, personalization, and efficiency.
Unlock the Future of Search with MongoDB Atlas_ Vector Search Unleashed.pdfMalak Abu Hammad
Discover how MongoDB Atlas and vector search technology can revolutionize your application's search capabilities. This comprehensive presentation covers:
* What is Vector Search?
* Importance and benefits of vector search
* Practical use cases across various industries
* Step-by-step implementation guide
* Live demos with code snippets
* Enhancing LLM capabilities with vector search
* Best practices and optimization strategies
Perfect for developers, AI enthusiasts, and tech leaders. Learn how to leverage MongoDB Atlas to deliver highly relevant, context-aware search results, transforming your data retrieval process. Stay ahead in tech innovation and maximize the potential of your applications.
#MongoDB #VectorSearch #AI #SemanticSearch #TechInnovation #DataScience #LLM #MachineLearning #SearchTechnology
Essentials of Automations: The Art of Triggers and Actions in FMESafe Software
In this second installment of our Essentials of Automations webinar series, we’ll explore the landscape of triggers and actions, guiding you through the nuances of authoring and adapting workspaces for seamless automations. Gain an understanding of the full spectrum of triggers and actions available in FME, empowering you to enhance your workspaces for efficient automation.
We’ll kick things off by showcasing the most commonly used event-based triggers, introducing you to various automation workflows like manual triggers, schedules, directory watchers, and more. Plus, see how these elements play out in real scenarios.
Whether you’re tweaking your current setup or building from the ground up, this session will arm you with the tools and insights needed to transform your FME usage into a powerhouse of productivity. Join us to discover effective strategies that simplify complex processes, enhancing your productivity and transforming your data management practices with FME. Let’s turn complexity into clarity and make your workspaces work wonders!
Your One-Stop Shop for Python Success: Top 10 US Python Development Providersakankshawande
Simplify your search for a reliable Python development partner! This list presents the top 10 trusted US providers offering comprehensive Python development services, ensuring your project's success from conception to completion.
Infrastructure Challenges in Scaling RAG with Custom AI modelsZilliz
Building Retrieval-Augmented Generation (RAG) systems with open-source and custom AI models is a complex task. This talk explores the challenges in productionizing RAG systems, including retrieval performance, response synthesis, and evaluation. We’ll discuss how to leverage open-source models like text embeddings, language models, and custom fine-tuned models to enhance RAG performance. Additionally, we’ll cover how BentoML can help orchestrate and scale these AI components efficiently, ensuring seamless deployment and management of RAG systems in the cloud.
Threats to mobile devices are more prevalent and increasing in scope and complexity. Users of mobile devices desire to take full advantage of the features
available on those devices, but many of the features provide convenience and capability but sacrifice security. This best practices guide outlines steps the users can take to better protect personal devices and information.
Let's Integrate MuleSoft RPA, COMPOSER, APM with AWS IDP along with Slackshyamraj55
Discover the seamless integration of RPA (Robotic Process Automation), COMPOSER, and APM with AWS IDP enhanced with Slack notifications. Explore how these technologies converge to streamline workflows, optimize performance, and ensure secure access, all while leveraging the power of AWS IDP and real-time communication via Slack notifications.
CAKE: Sharing Slices of Confidential Data on BlockchainClaudio Di Ciccio
Presented at the CAiSE 2024 Forum, Intelligent Information Systems, June 6th, Limassol, Cyprus.
Synopsis: Cooperative information systems typically involve various entities in a collaborative process within a distributed environment. Blockchain technology offers a mechanism for automating such processes, even when only partial trust exists among participants. The data stored on the blockchain is replicated across all nodes in the network, ensuring accessibility to all participants. While this aspect facilitates traceability, integrity, and persistence, it poses challenges for adopting public blockchains in enterprise settings due to confidentiality issues. In this paper, we present a software tool named Control Access via Key Encryption (CAKE), designed to ensure data confidentiality in scenarios involving public blockchains. After outlining its core components and functionalities, we showcase the application of CAKE in the context of a real-world cyber-security project within the logistics domain.
Paper: https://doi.org/10.1007/978-3-031-61000-4_16
CAKE: Sharing Slices of Confidential Data on Blockchain
Cloud stack monitoring with zenoss
1. Monitoring CloudStack With
Zenoss
Shanker Balan
Managing Consultant, ShapeBlue India
shanker.balan@shapeblue.com
2. Monitoring With Zenoss
• Integrated Platform
– Application Monitoring
– Sever Monitoring
– Network Management Platform
• Features
– Event Management
– Time-series performance monitoring of devices
– Auto Discovery
– Alerting system provides notifications based on rule
sets and on-call calendars
3. Extending Zenoss With ZenPacks
• Download from http://zenpacks.zenoss.com
– ZenPacks.zenoss.CloudStack
– ZenPacks.zenoss.XenMonitor
– ZenPacks.community.VMwareEsx
– ZenPacks.community.VMwareESXiMonitor
4. CloudStack Specific Metrics
These numbers are aggregated from all
zones, pods, clusters and hosts:
1. Public IPs: Total and Used
2. Private IPs: Total and Used
3. Memory: Total (with and without over-
provisioning), Allocated and Used
4. CPU: Total (with and without over-
provisioning), Allocated and Used
5. Primary Storage: Total (with and without over-
provisioning), Allocated and Used
6. Secondary Storage: Total and Used
7. Network: Read and Write
5. CloudStack Specific Metrics
• Cluster / Host Metrics
1. Memory: Total and Used
2. CPU: Total (with and without over-
provisioning), Allocated, Used and Cores
3. Network: Read and Write
6. CloudStack Threshold Monitoring
• Thresholds
– Notifications for lower thresholds (25%)
– Alarm/Warning for higher thresholds (85%)
• Key Metrics
1. CPU
2. Memory
8. Zenoss Core Installation
• OS Platform
– CentOS 6.x 64-bit
– 2GB RAM
– Fast Disks
• Deploy using core-autodeploy-4.2.sh available at
https://github.com/zenoss/core-autodeploy/
– cd /tmp
– chmod +x core-autodeploy-4.2.sh
– ./core-autodeploy-4.2.sh
9. CloudStack Integration
– Download CloudStack Zenpack from
http://zenpacks.zenoss.com/.
– # zenpack --install <filename.egg>
– # zenoss restart
– Navigate to the Zenoss Infra page
– Add URL, API Key, and Secret Key fields
10. CloudStack Monitoring in 4.2
• SNMP Support in future versions
– Generate Traps
https://cwiki.apache.org/confluence/display/CLOUD
STACK/SNMP+Alerts+feature
• Syslog Support
– Write to local syslog
– Write to remote syslog
– Log level / Log Priority
ShapeBlue are specialist cloud builders and are the globally leading consultants & integrators of many many cloud technologies. We were the first Citrix Cloud Advisor in Europe and in the last 6 months we have worked with BSkysB, Colt, SunGard AS, Citrix themselves, Centrica, Orange Telecom, Slovak Telecom Trader Media and a whole range of smaller organisations. Of particular note is our development of Sungard's Sungard Online cloud, a major global public cloud.
Zenoss is an application, server, and network management platform based on the Zope application server. Zenoss provides a web interface that allows system administrators to monitor availability, inventory, configuration, performance, and events.The CloudStack ZenPack adds CloudStack/CloudPlatform specific metrics
ZenPacks provide a plug-in architecture that allows community members to extend Zenoss's functionality. The authors are free to choose how they license their individual ZenPacks. ZenPacks are encapsulated in Python eggs and provide instrumentation and reports for monitored infrastructure components.
The same list of metrics is available for each zone. The same metrics with the exception of public IPs and secondary storage are also available for each pod
The following metrics are available aggregated to each cluster, and for each host
The monitoring of the following metrics is recommended. A lower notification threshold is also suggested along with an alarm threshold, allowing for the ‘rate of consumption’ to be estimated. A high rate of consumption could indicate either a high uptake rate or an issue in the environment; it should therefore be investigated to determine its cause.Once the notification thresholds have been reached (and confirmed due to legitimate consumption) they should be raised to 50% for further ‘rate of consumption’ monitoring.
Zenoss has event management tools which can annotate system alerts.In addition to monitoring resource levels, Zenoss also extracts events from the CloudStack event logs. These should be monitored particularly for host failures.
Version 6.x of RHEL or CentOS is recommended.Core-autodeploy-4.2.sh will automatically deploy Zenoss Core 4 for you. It will download Java, MySQL, Zenoss Core 4, all RPM dependencies, and install everything including the Zenoss Core ZenPacks. Perform these steps on a fresh CentOS or Red Hat Enterprise Linux installation:The script will take several minutes (around 10-30) to complete. When done, you should have a fully functioning Zenoss Core install and available at http://localhost:8080/
This ZenPack has no special installation considerations. You should install the most recent version of the ZenPack for the version of Zenoss you're running.The easiest way to start monitoring CloudStack is to navigate to the Infrastructure page, click the + menu to add a device and choose Add CloudStack. Fill out the URL, API Key, and Secret Key fields then click OK. The URL should only include the protocol, host and port (i.e. http://cloudstack.example.com/). You can find or create the keys by logging into the CloudStack web interface and navigate to Accounts and users.Zenoss will then add the CloudStack device to the system along with all of its associated zones, pods and clusters. Monitoring will also start after the discovery is complete
Use Simple Network Management Protocol (SNMP) to configure the SNMP agent on CloudStack Management Server to generate asynchronous events, which are called traps. The traps are generated whenever there are abnormal conditions as observed by the Management Server. The traps are then sent to a remote device called a trap listener, which signals the abnormal condition on CloudStack. The trap listener is typically an external management station such as Microsoft SCOM, HP Openview etc.Logging feature enables logging status and status information collected by various modules and components in a CloudStack environment. SYSLOG is a standard protocol for logging. It has two components - the SYSLOG auditing module, which runs on the management server (of CloudStack), and the SYSLOG server, which can also run on the management server or on a remote system. SYSLOG uses UDP for the transfer of data.When configured, the management server starts sending all the log information to the SYSLOG server, and the SYSLOG server can filter the log entries before storing them in a log file. A SYSLOG server can receive log information from more than one client and CloudStack management server can also send log information to more than one SYSLOG server.