Download to read offline

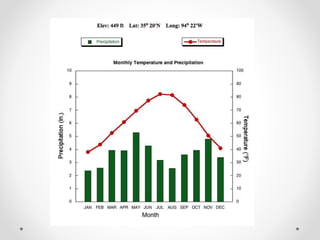
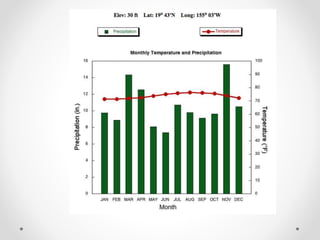
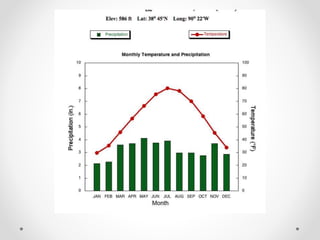
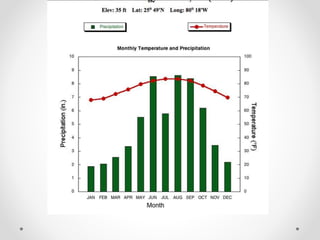

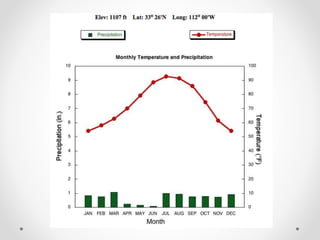
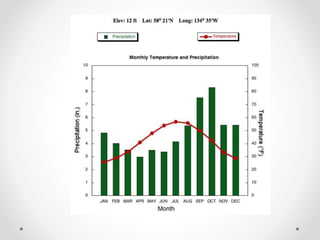
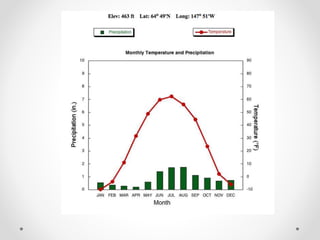
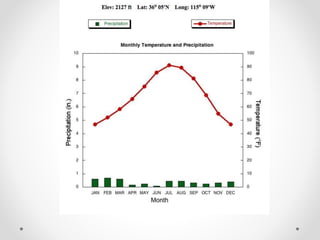
Climographs are graphs that show monthly temperature and precipitation averages over many years to depict a region's climate patterns. They display average monthly temperature and precipitation data to illustrate climate norms and extremes. Climographs are used by climatologists and others to analyze climate trends and variations.


