This document provides notes from an empirical research methods class. It outlines key topics covered, including:
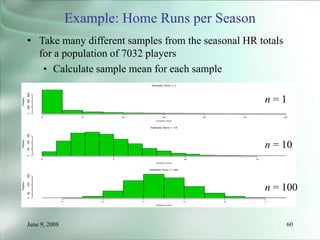
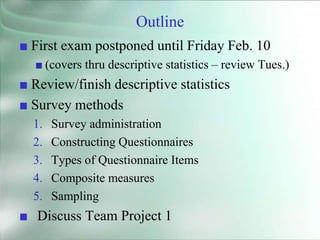
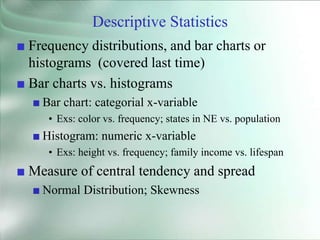
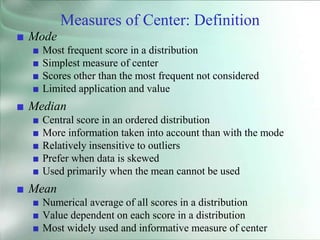
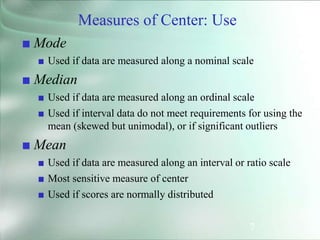
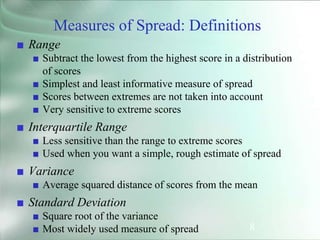
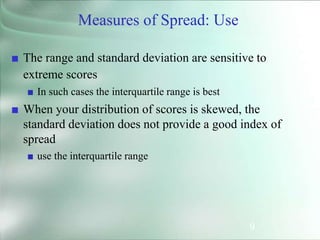
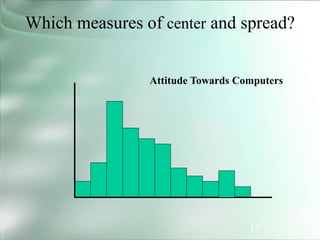
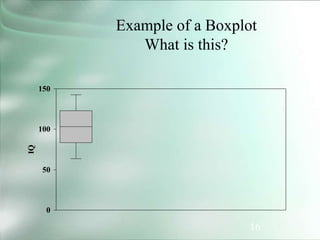
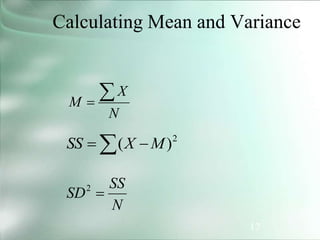
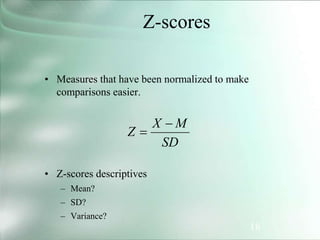
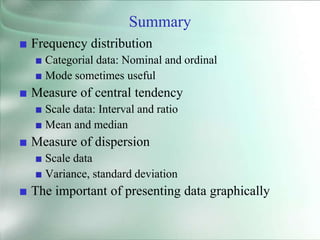
1. Postponing the first exam and reviewing descriptive statistics such as frequency distributions, measures of central tendency, and measures of spread.
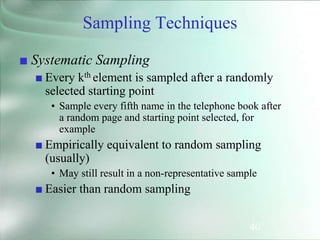
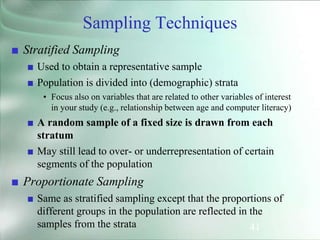
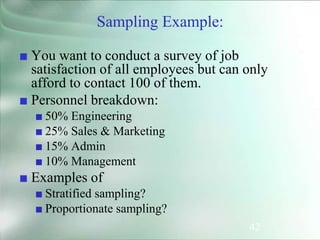
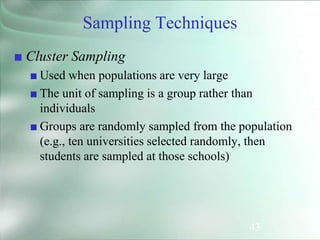
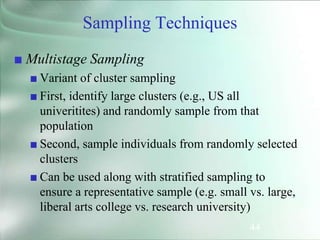
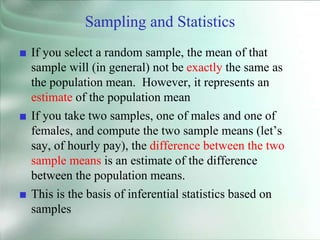
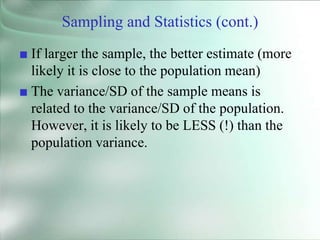
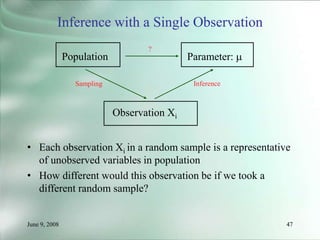
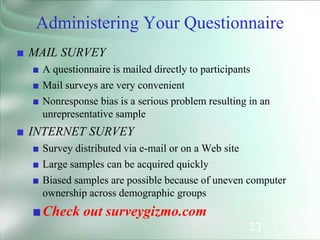
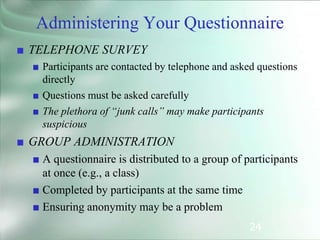
2. Discussing survey methods such as questionnaire construction, types of questionnaire items, composite measures, and sampling.
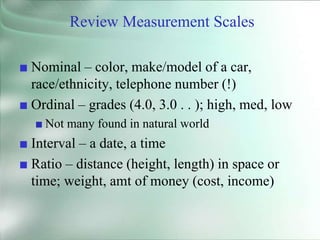
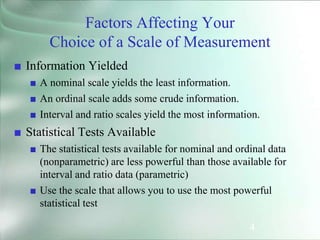
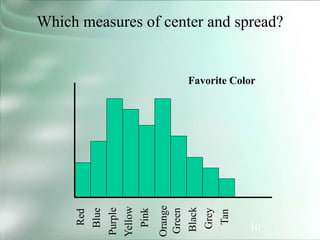
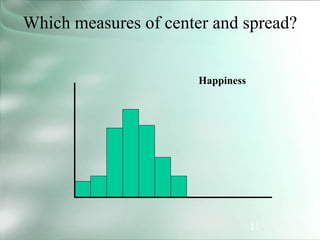
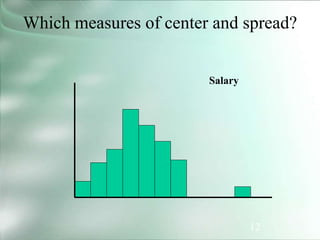
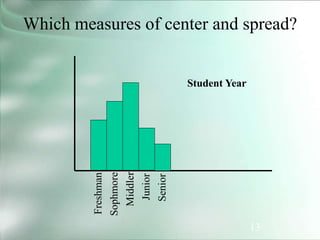
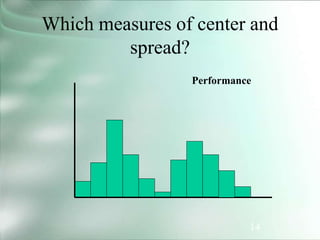
3. Reviewing measurement scales, factors affecting scale choice, and examples of measures of central tendency and spread for different data types.


![29
Questionnaire Construction
■ Items can be optional. Flow often depicted
verbally and/or pictorially.
14. Have you ever participated in the
Model Cities program?
[ ] Yes
[ ] No
If Yes: When did you last attend
attend a meeting?
_________________](https://image.slidesharecdn.com/classfeb03-230701161003-ca2b0e3e/85/classfeb03-pptx-29-320.jpg)