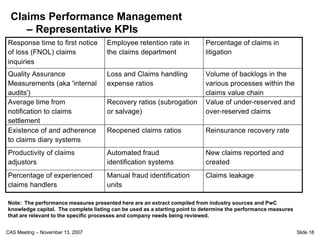
Download as PDF, PPTX


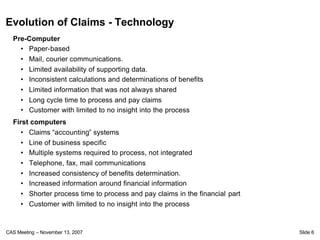
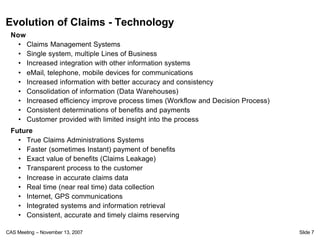

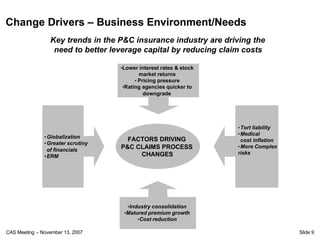

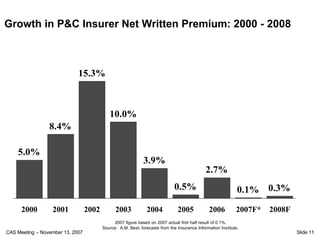


The document discusses the evolution of the claims process in the insurance industry, highlighting the transition from manual processes to advanced technology solutions that enhance efficiency and data accessibility. Key drivers of change include shifts in the business environment, talent availability issues, and the need for improved technology to support claims management. The importance of key performance indicators (KPIs) for measuring claims performance and organizational success is emphasized throughout the meeting agenda.


![Hay guide chart.pptx [autosaved]](https://cdn.slidesharecdn.com/ss_thumbnails/hayguidechart-130925113929-phpapp02-thumbnail.jpg?width=640&height=640&fit=bounds)


