L8 issues for people living in urban areas in rich countries traffic
Civic Area Open House 4-4-2016
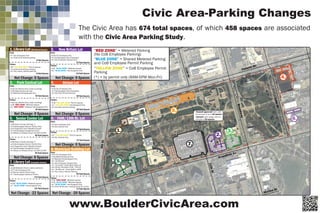
1. Civic Area-Parking Changes
www.BoulderCivicArea.com
The Civic Area has 674 total spaces, of which 458 spaces are associated
with the Civic Area Parking Study.
1. Library Lot (9th Street Access)
Past:
7 City Employee Only
1 Channel 8 Vehicle parking
8 Total Spaces
Future:
6 “YELLOW ZONE” Permit spaces
1 Channel 8 Vehicle parking
8 Total Spaces
Net Change: 0 Spaces
1 City Library Vehicle parking
4. Atrium Lot
Past:
18 City Employee Only
1 Handicapped (City Employee)
1 City Pool Vehicle Parking
20 Total Spaces
Future:
18 “YELLOW ZONE” Permit spaces
1 “YELLOW ZONE” Handicapped Only
20 Total Spaces
Net Change: 0 Spaces
1 City Pool Vehicle Parking
5. Senior Center Lot
Past:
38 Senior Center Parking (*)
3 Handicapped (Senior Center Only)
10 Arapahoe Court Resident/Guest
4 Handicapped (Arapahoe Court)
4 Meals on Wheels Driver (10 AM-12 PM)
58 Total Spaces
Future:
38 Senior Center Parking (*)
4 Handicapped (Senior Center Only)
10 Arapahoe Court Resident/Guest
2 Handicapped (Arapahoe Court)
4 Meals on Wheels Driver (10 AM-12 PM)
58 Total Spaces
Net Change: 0 Spaces
6. FAM/13th St. Lot
Past:
4 City Employee Only
9 City Vehicle Only
13 Total Spaces
Future:
4 “YELLOW ZONE” Permit spaces
9 City Vehicle Only
13 Total Spaces
Net Change: 0 Spaces
7. Library Lot (Arapahoe Access)
Past:
136 Metered (free to Library patrons)
27 City Employee Only
3 Senior Center Permit Only
7 Handicapped (General Public)
173 Total Spaces
Future:
144 “BLUE ZONE” Metered spaces
7 “BLUE ZONE” Handicapped Only
151 Total Spaces
Net Change: -22 Spaces
4 Library Volunteer (Free - Permit)
8.Municipal Building Lot
Past:
94 Total Spaces
Future:
71 Total Spaces
Net Change: -20 Spaces
45 “BLUE ZONE” Metered spaces
4 “BLUE ZONE” Handicapped Only
2 (Free-30 Minute) Loading Zones for Library
20 “RED ZONE” Metered spaces
61 City Employee Only
16 Metered General Use
4 Metered Handicapped Only
5 “15 Minute”
1 City Employee Carpool Only
1 “5 minute” (Free) Book Drop off
1 “30 Minute” (Free) 8AM to 5PM
1 City Library Vehicle Parking
2. New Britain Lot
Past:
39 City Employee Only
2 Handicapped (City Employee)
2 City Employee Carpool Only
43 Total Spaces
Future:
41 “BLUE ZONE” Metered spaces
2 “BLUE ZONE” Handicapped Only
43 Total Spaces
Net Change: 0 Spaces
3. Park Central Lot
Past:
19 City Vehicle Only (under building)
28 Metered General Use
2 Metered Handicapped Only
49 Total Spaces
Future:
19 City Vehicle Only (under building)
28 “RED ZONE” Metered spaces
49 Total Spaces
Net Change: 0 Spaces
2 “RED ZONE” Metered Handicapped Only
Canyon Bv
Arapahoe Av
Broadway
9thSt
13thSt
Walnut St
11thSt
Marine St
11thSt
9thSt
7.
2.
3.
8.
1.
5.
4.
6.6.
‘Council approved’ plan calls
for removal of up to 42 spaces.
‘Current’ park design calls for
removal of 20 spaces.
(*) = by permit only (8AM-5PM Mon-Fri)
“RED ZONE” = Metered Parking
(No CoB Employee Parking)
“BLUE ZONE” = Shared Metered Parking
and CoB Employee Permit Parking
“YELLOW ZONE” = CoB Employee Permit
Parking
2. Civic Area-TDM Programs
www.BoulderCivicArea.com
As part of the Civic Area project, the city has implemented
several Transportation Demand Management (TDM)
programs and parking management to mitigate some the
parking demand in the Civic Area for City of Boulder
employees and visitors. These programs and approaches
were initially piloted in Nov. and December 2015 and
formalized in Jan. 2016. These programs include:
Parking Cost Increase
In 2016, the Parking cost in the Civic Area lots for city
employees increased from $2/day to $3/day.
Parking Cash Out Program
Civic area employees are paid $1 for each day they do not
park in any of the Civic Area lots and use a transportation
option. For participants this program provides a $4/per day
financial incentive to use transportation options giving the
$3 per day cost to park in a civic are lot.
Free Satellite Parking
Civic Area city employees are encouraged to park their
vehicles in satellite locations surrounding the Civic Area,
including the former Boulder Community Hospital site, Eco
Cycle lot on Arapahoe, and existing RTD park-n-rides.
Parking at these lots is free to city employees and also
qualifies them for the Parking Cash Out program.
Reclassifying Spaces
A majority of the parking spaces at the Park Central, New
Britain, Municipal Building and Library lots were reclassified
to be metered spaces to be shared by City employees and the
public. In addition the meter rate was increased to be
consistent with the rest of downtown, with the first 90
minutes being free.
Concierge Service
Civic area employees receive personalized travel assistance
from the city employee transportation coordinator to identify
viable transportation options for commuting to work.
3. Civic Area-
TDM Programs Update
www.BoulderCivicArea.com
First Quarter Evaluation Findings:
On a quarterly basis, downtown city employees are surveyed on their commute trips over a two week
period. The first quarter survey tracked employee travel from February 16-28. The survey also collects
information on demographic and employment, utilization of TDM programs and qualitative data on factors that
influence travel behavior. The survey also provides an opportunity for downtown city employees to provide
feedback on the Civic Area changes.
Average PCO
Days/PP (10days)
Evaluation Methodology:
Staff is also tracking the use of the Parking Cash Out (PCO) benefit by city employees which is recorded in
bi-weekly timesheets. The PCO program officially started in the second pay period of 2016.
The goal is to enhance existing & future multimodal access to Civic Area.
To track the effectiveness of these Transportation Demand Management
Below are the findings of the first quarter evaluation.
(TDM) programs, the project team is conducting quarterly evaluations.
35.4%
64.6%
No
Yes
Do you live
in the City of
Boulder?
Negative
Very
Negative
Very
Positive
Positive
Neutral
What is your
overall reaction
to parking
changes in
Civic Area?
12.8%
17.7%
39%
21.3%
9.1%
164 Responses
Average Commute Distance
Satellite
Parking Lot
Utilization by
Location
Hospital
Site
74%
On-Street
22%
4% Eco-Cycle
Satellite Parking Utilization
10
20
30
40
60
I do not
typically
drive
A satellite
parking
location
Atrium New
Britain
Main
Library
Behind North
Wing of Old
Library off
9th St.
Municipal
Building
Senior
Center
FAM Lot of the
14th St.
Offices
Other
0
50
Building Lots
Responses
Typical Civic Area Employee Parking Locations
22 Responses
2016 FirstQuarterMode Split 2014Downtown City Employee Mode Share
187 Responses
-The Boulder Community Hospital site
is used 3X as much as the other sites.
Overall Reaction to Changes
-34.1% Positive
-39% Neutral
-26.8% Negative
- Boulder Residents: 3.3 miles
- Non-Residents:17.3 miles
Travel Behavior Findings:
-Drive alone mode share for Civic Area employees is 6% lower
compared to the 2014 City Employee Travel Behavior Survey.
Parking Cash Out Findings:
-Approximately half of Civic Area City Employees qualify for at
least one parking cash out benefit per pay period
-The average participation in the Parking Cash Out program
over 10 days was 6.1 days.
51% Drove Alone
9% Carpooled/Vanpooled
13% Bicycled
3% Combined bike and bus
15% Bus
6% Bus fromRTDPark-n-Ride
2% Walked
2% Teleworked
<1% Compressed WorkWeekday off
<1% Other
2014Downtown City Employee Mode Share
Pay Period
#of Employees who
qualified forPCO at
leastonce during pay
period
Total PCO Benefits
Paid
Average PCO
Days/PP (10days)
2 157 $993 6.3
3 178 $1,065 6
4 181 $1,073 5.9
5 173 $1,095 6.3
AVG/TOTAL/AVG 172 $4,226 6.1
On a quarterly basis, downtown city employees are surveyed on their commute trips over a two week period.
The first quarter survey tracked employee travel from February 16-28. The survey also collects information on
demographic and employment, utilization of TDM programs and qualitative data on factors that influence travel
behavior. The survey also provides an opportunity for downtown city employees to provide feedback on the Civic
Area changes.
Drove Alone 46%
Carpolled/Vanpooled 9%
Drove to Satellite location 7%
Bicycled 5%
Combined bike and bus 1%
Bus 15%
Bus fromRTDPark-n-Ride 3%
Walked 4%
Teleworked 6%
Compressed WorkWeekday off 2%
Other 2%
2016 FirstQuarterMode Share
4. Civic Area-
Parking Utilization Update
www.BoulderCivicArea.com
An analysis of the parking utilization was done in the various Civic Area
lots post implementation of the TDM programs, and parking changes.
The goal of this analysis is to answer these questions:
Has utilization of the available parking on
the civic area campus changed?1
Has parking in the adjacent neighborhood
south of Arapahoe Avenue changed?3
Has City of Boulder employee parking on
the civic campus changed?2
How has the satellite parking facility at
the former hospital site been utilized?4
Parking utilization data was collected on three weekdays, and three
Saturdays ‘Before and After’ the changes to parking. For the ‘Before’ data,
hourly visits (between 7AM and 7PM) were made to the various civic area lots
where the amount of cars, which spaces the cars were in, were counted and
tabulated for analysis. The same approach was taken for the ‘After’ data, with the
exception of the counts being done ever two hours (between 7AM and 7PM).
Data Collection: Civic Area Lots
On-street parking supply and utilization was counted both ‘Before and After’ the
parking changes in the neighborhood south of the civic area campus, roughly
bounded by Arapahoe Ave, Broadway, 6th St., Marine/Grandview, with the
subsets both East and West of 9th St. In the ‘Before’ count 19 observations
were recorded, with 15 observations in the ‘After’ count.
Data Collection: Adjacent Neighborhoods
Key Findings:
1. More demand for parking on Weekdays than
Weekends. (Fall and Winter Data)
2. Some reduction in Peak Period Average
Utilization after parking changes.
3. High variability of data, more data needed.
12/08- 10AM
12/09- 10AM,2PM,4PM
12/10- 10AM,4PM
12/11- 10AM,2PM,4PM
12/15- 10AM,4PM
12/16- 10AM,2PM,4PM
12/17- 10AM,2PM,4PM
12/18- 10AM,2PM
2/15- AM, PM
2/17- AM, PM
2/24- AM, PM
2/25- AM, PM
2/26- AM, PM
3/02- AM, PM
3/03- AM
3/04- AM, PM
Count Dates & Times
Before: After:
After- Data Collection Dates:
Weekdays: 2-16, 2-17, 2-18 of 2015
2-13, 2-20, 2-27 of 2016Weekends:
Before- Data Collection Dates:
Weekdays: 11-10, 11-19, 12-3 of 2015
11-7, 11-21, of 2015
1-16 of 2016
Weekends:
7AM
Before
After
Before
After
Before
After
Before
After
9AM 11AM 1PM 3PM 5PM 7PM
0%
10%
20%
30%
40%
50%
60%
70%
80%
90%
100%
Time
PercentofUtilizationRate(458Spaces)
Before
After
Before
After
Before
After
Employee Designated Spaces (Before)
Employees (After)
Metered + City Vehicles in Other Lots
(Except Park Central and 13th St.)
City Vehicles in Park Central/
13th. St. FAM Only
7AM
Before
After
Before
After
Before
After
Before
After
9AM 11AM 1PM 3PM 5PM 7PM
0%
10%
20%
30%
40%
50%
60%
70%
80%
90%
100%
Time
PercentofUtilizationRate(458Spaces)
Before
After
Before
After
Before
After
PercentofUtilizationRate
Total Civic Area Campus Weekday Average Total Civic Area Campus Weekend Average
Adjacent Neighborhood Parking Utilization
-10%
-5%
0%
5%
10%
15%
20%
25%
PercentofUtilizationRate
0%
20%
40%
60%
80%
100%
120%
Before After
% OccupancyWest
% OccupancyEast
Total Occupany Avg.
Total SupplyEast:
264 Spaces
Total SupplyWest:
207 Spaces
Utilization Rate:
% OccupancyWest
% OccupancyEast
Total Occupany Avg.
Difference in
Utilization Rate
Before and After:20%
-6%
5%