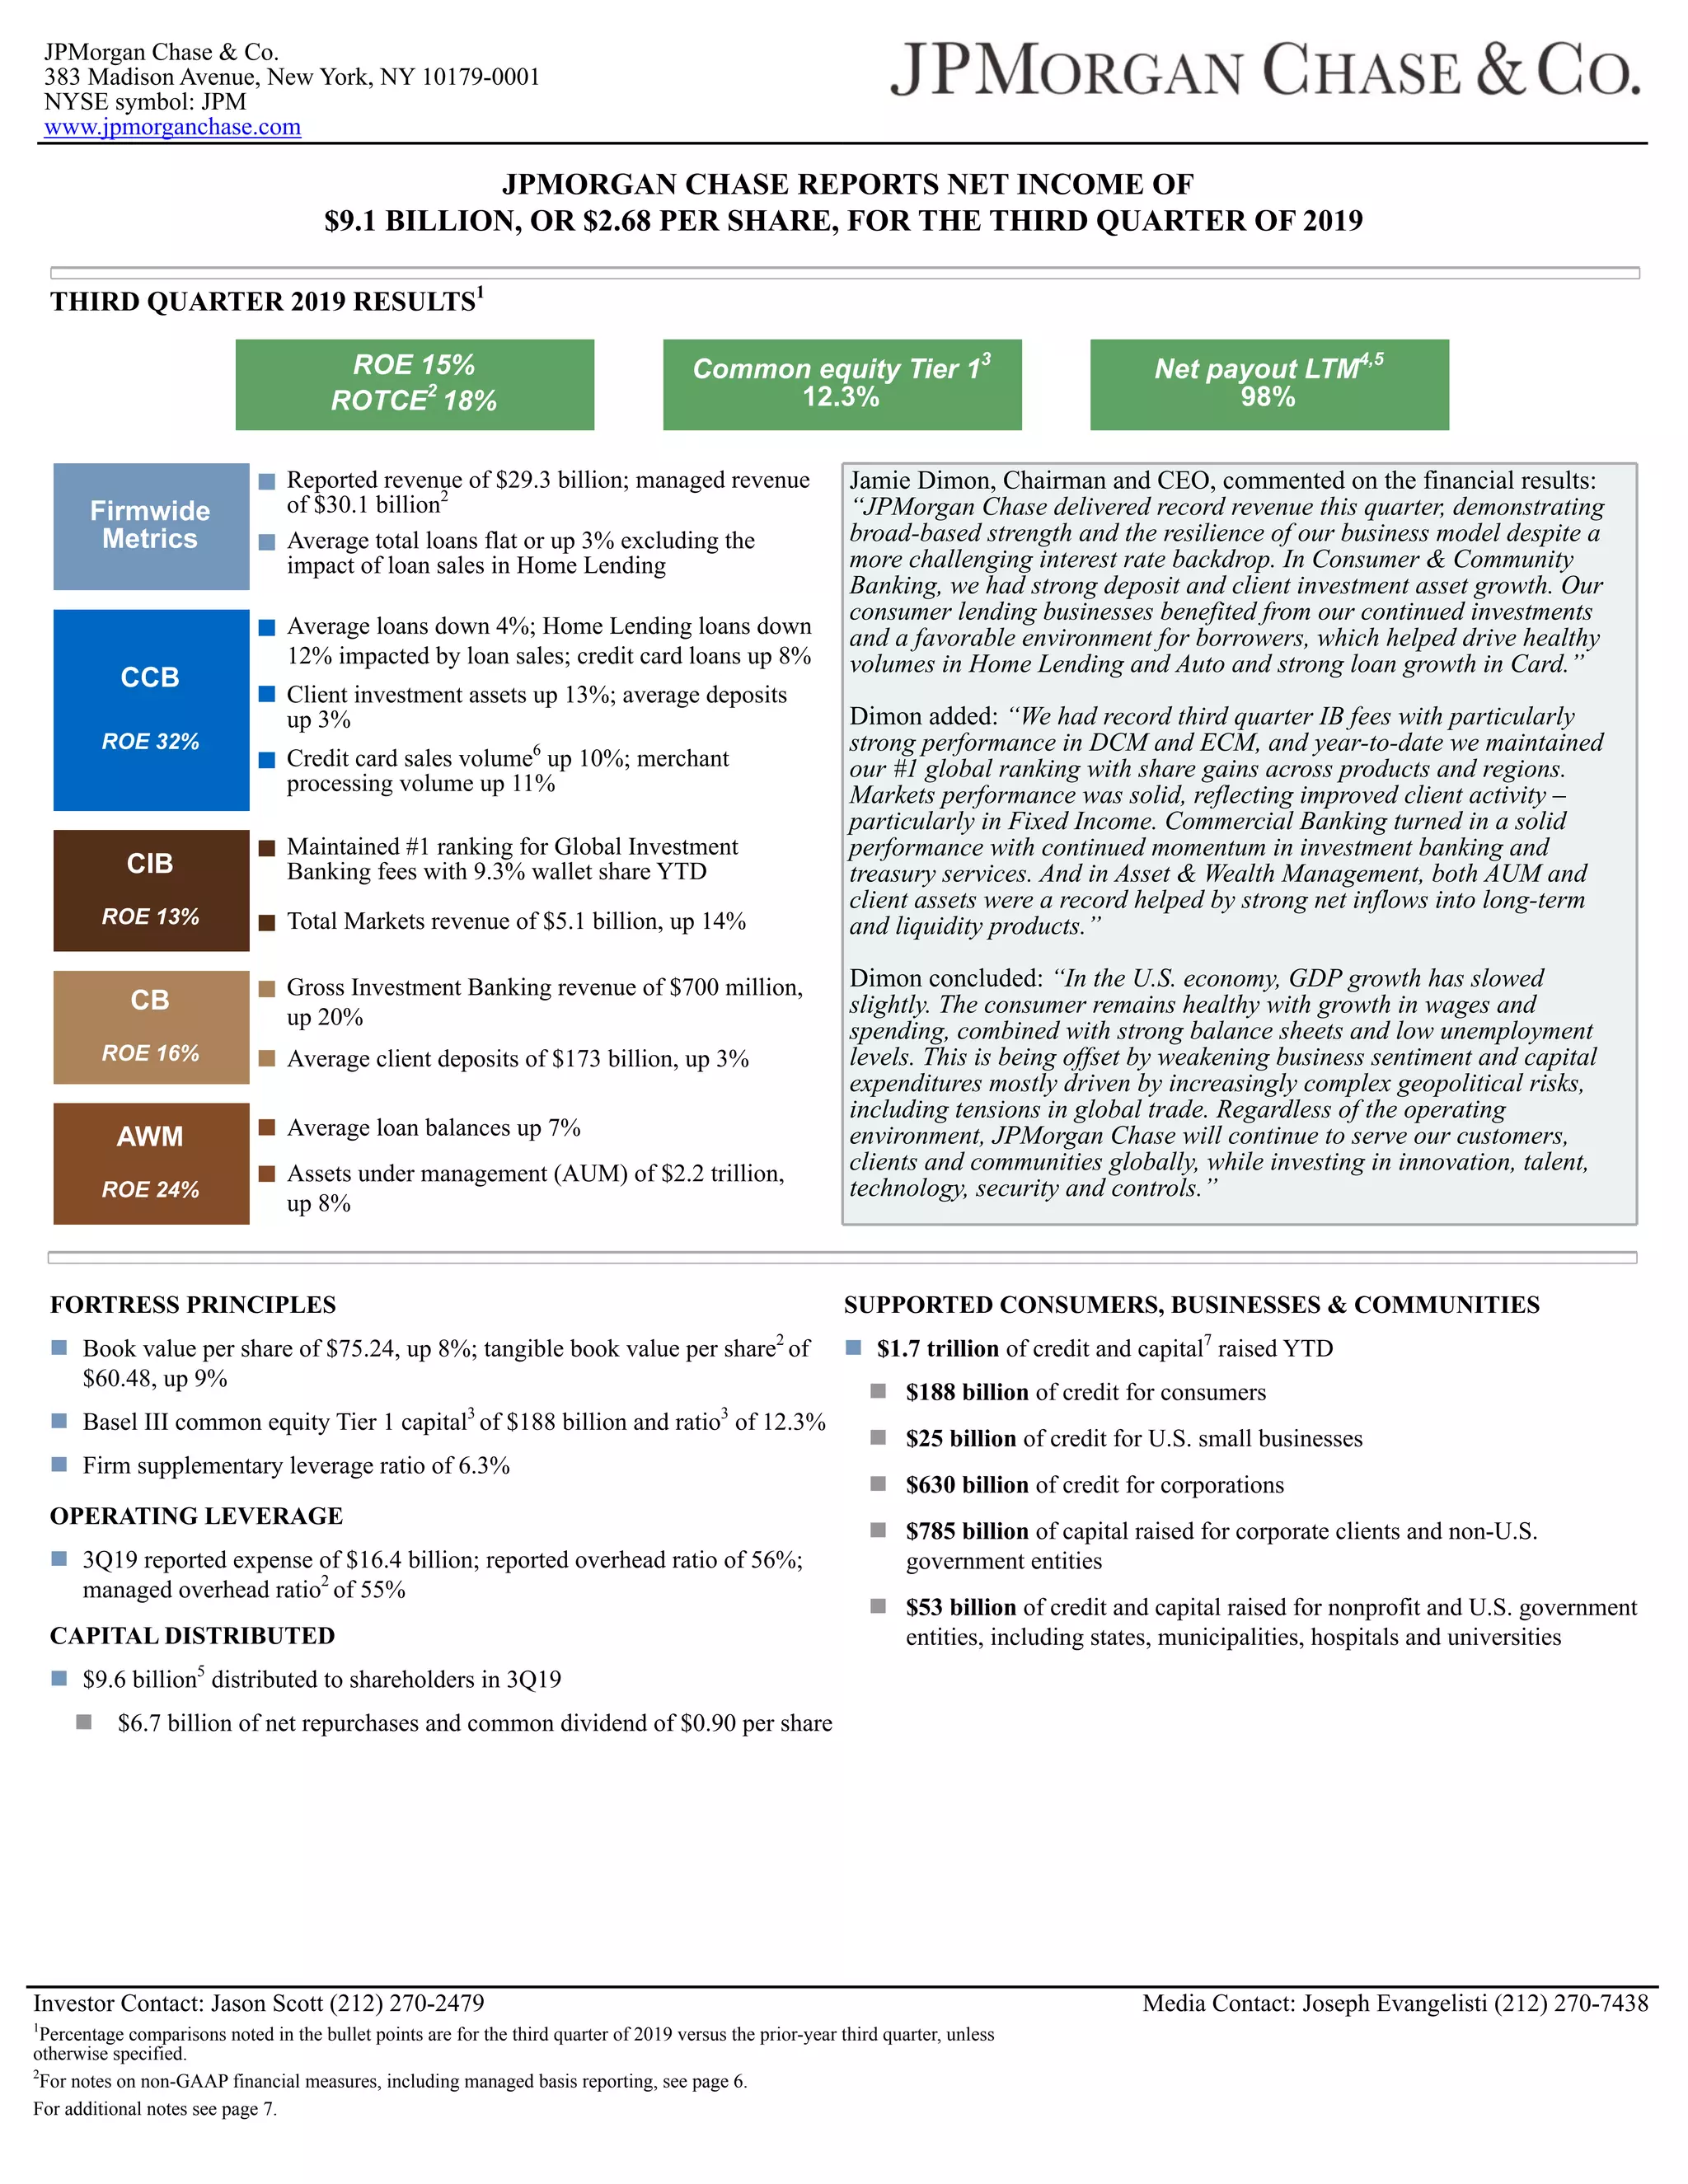
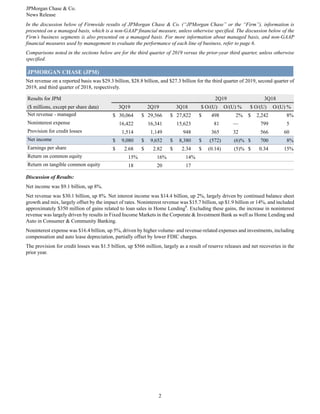
- JPMorgan Chase reported net income of $9.1 billion for Q3 2019, up 8% from the prior year. Revenue was $30.1 billion, up 8%, driven by growth in consumer and investment banking.
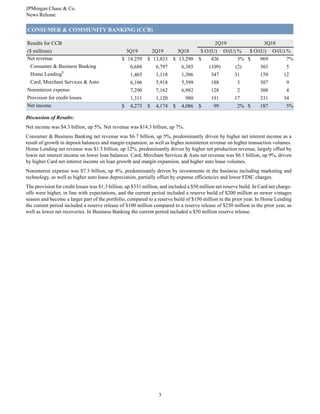
- Consumer & Community Banking revenue was $14.3 billion, up 7%, helped by higher deposits and auto/credit card volumes, though home lending revenue fell due to loan sales.
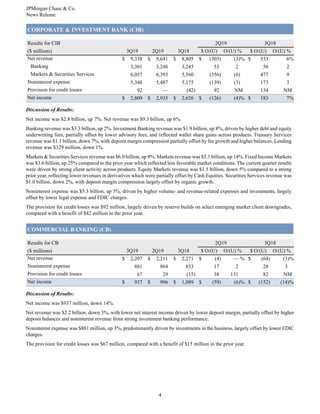
- Corporate & Investment Bank revenue was $9.3 billion, up 6%, with record investment banking fees and strong fixed income markets, though equity markets fell.


![]](https://cdn.slidesharecdn.com/ss_thumbnails/random-131208211325-phpapp02-thumbnail.jpg?width=640&height=640&fit=bounds)