SlideShare a Scribd company logo
1 of 66
Citation (APA) Greenlee, B. J. (2007). When school advisory
councils decide: Spending choices for school improvement.
Planning and
Changing, 38(3), 222-244.
Background
Context Literature
This paper addresses the role of governance structures. Parent
and community involvement in decision-making is
considered an essential component of successful school
improvement. Stakeholders such as the parents collaborate with
school professionals to provide greater access for influencing
decision making of their child’s school.
Purposes This study examines the effects of a distributed school
budget authority and reduced budgeting constraints: when
school
governance councils have the opportunity to make choices
concerning the allocation of school accountability dollars,
what do they choose? Furthermore, in considering spending
alternatives in order to enhance school performance what
choices do they make?
Research Design Methods
Participation Subjects
Population Sample
Setting
The empirical study was in a large Florida school district. The
school district’s demographics were comparable to state’s
averages. The sample included school advisory council (SAC)
projected budgets for 186 schools.
Data Collection Data on SAC budgets obtained from the school
improvement plans for 2004/2005 posted on the school district’s
website. The plans provided data on school demography,
council composition including race and constituency, school
improvement goals and action plans, and the proposed budget
for accountability dollars.
Data analysis Data was examined and allocations were
classified by the item or service. Using a data reduction,
process items were
sorted into categories. A line item analysis was done for the
budgets to identify and classify all allocations, then entered
into a database and coded into categories of spending. Three
investigators independently analyzed and compiled item
classifications and compared findings. This method provided
multiple perspectives as opposed to a single perspective on
the data. Peer review facilitation increased the trustworthiness
of the interpretation.
Findings The study provides two major points: 1) SAC’s
consider the spending priorities for their accountability funds.
Schools
allocate their budgets differently based upon the context and
conditions they face. Choices are framed by each SAC’s
understanding of the needs of the school within the framework
of the resources available. Budget choices are not
random, but value-laden because one idea will receive more
while another idea will receive less. 2) There is not a
systematic understanding of what works in school improvement
spending. Budget decisions are arbitrary and are spent in
traditional ways such as curriculum materials or supplies, and
equipment. With providing more flexibility and control
over resources for schools, school improvement initiatives
resulted in little innovation or risk taking.
Conclusions SAC’s contend with the influence of
parents/community leaders and the employment of interested
school employees.
School employees such as teachers and principals can sway
their interests more and detract from the partnership given
from parents for their part in decision-making. Other concerns
are the motives guiding to improve educational
opportunity for all students. Policy efforts as well as culture of
the schools accountability for results are the issues. Can
spending produce meaningful results?
Commentary Although California does not have student
improvement plan, schools are required to involve parent/
community
involvement in the school budget. The ongoing question of what
is important or valuable. The extensive large study
provided a greater understanding of what SAC’s value when
taking into account student achievement and the financial
budget. How monies are disbursed given the importance of
improving student achievement in low socio economic
performing schools, which is a consideration in my blog.
Nora Bader
Nora Bader
Nora Bader
� .JOURNAL OF URBAN ECONOMICS 43, 418]443 1998
ARTICLE NO. UE972053
School Finance Reform and Private School
Enrollment: Evidence from California*
Thomas A. Downes† and David Schoeman
Department of Economics, Tufts Uni®ersity, Braker Hall,
Medford, Massachusetts 02155
Received April 3, 1996; revised May 23, 1997
Abstract: This paper uses the school finance reforms in
California in the 1970s
to examine whether the constraints such reforms impose on
school districts lead to
switching to private schools. Misspecifications of demand in
previous work have led
to understatement of reform effects. An empirical model of
schooling share
equations is derived from a discrete choice framework. Large
biases are shown to
result from failure to account for heterogeneity of demanders
and school-district-
specific fixed effects. Simulations indicate that the changes in
public provision
potentially resulting from reform explain a sizeable portion of
the growth in the
private school share. Q 1998 Academic Press
1. INTRODUCTION
w xJonathan Kozol’s Sa®age Inequalities 16 eloquently
documents the large
and persistent disparities in educational opportunities within the
United
States. Policymakers have responded to these disparities with
various
reforms of state school financing systems, with varied success
at reducing
cross-district disparities in per pupil spending. Reforms that
have in-
creased the state share of spending and have limited local
discretion
w xhave resulted in the largest reductions of disparities 10 .
However, the ef-
fects of these policies on student achievement and on other
aspects of
� w xthe education system have gone largely unexplored
exceptions are 15
w x.and 8 .
Contemporary observers of reform policies noted that reforms
limiting
local discretion over spending might have unintended and
potentially
detrimental consequences. For example, Walter Mondale
observed that
*Thanks to Dan Sullivan, Joe Altonji, Bo Honore, Rebecca
Blank, Andrew Newman, Steve´
Rivkin, Carol Rapaport, Dale Ballou, Jan Brueckner, two
anonymous referees, and seminar
participants at Northwestern University, the University of
Chicago, and the University of
Wisconsin]Madison for helpful comments and suggestions. Also
thanks to Craig Kogan for
his diligent research assistance. All remaining errors of
omission or commission are our own.
†E-mail: [email protected]
418
0094-1190r98 $25.00
Copyright Q 1998 by Academic Press
All rights of reproduction in any form reserved.
FINANCE REFORM AND PRIVATE SCHOOL ENROLLMENT
419
parents in districts facing spending constraints might argue
... we are in this trap where we can raise a lot of money to be
sent
elsewhere or we can put downward pressure on revenue for our
local
schools and simply spread all of our money on private schools
for our
� .children Mondale Committee Hearings, p. 6883
The end result could be reduced popular support for the state’s
public
schools, with the potential outcome being that the policies hurt
those
students in low wealth districts whom the policies were
intended to help.
The objective of this paper is to provide evidence on the
plausibility of the
argument raised by Mondale. In particular, we look at the
changes in the
share of enrollment in private schools after reform, using data
from
California in 1970 and 1980, years that sandwich extensive
school finance
reforms in the 1970s.
Two court rulings, Serrano I 1 and Serrano II,2 issued in the
mid-1970s,
dramatically altered the nature of public school financing in
California.
These decisions ruled unconstitutional any financing system
that allowed
disparities in taxable wealth across districts to translate into
disparate
levels of per pupil spending. Prior to the Serrano decisions,
there was wide
variation in per pupil expenditures, interpreted by the California
Supreme
Court as being partly attributable to sizeable differences in the
revenue-
raising capacity of districts. The state responded to the Serrano
decisions
by placing ceilings on the amount districts could spend on each
student
and by forcing the range in these ceilings on per pupil
expenditures, known
as revenue limits, to shrink over time. The passage of
Proposition 13, the
property tax limitation initiative, moved the responsibility for
financing
public schools from the local to the state level and enabled the
state to
implement the revenue limit system. The combination of the
Serrano
rulings and Proposition 13 did, with certainty, reduce the
differences in
w xspending across districts 18, 6 . The rapidity and magnitude
of the changes
in the cross-district distribution of per pupil spending provide a
natural
experiment for examining the effects of finance reforms.
w xFischel 11 has contended that the passage of Proposition 13
was
evidence that the Serrano decision reduced popular support for
public
school expenditures. Following Walter Mondale’s reasoning,
this reduction
in support also would be reflected in sizeable growth in the
share of
enrollment in private schools. In fact, in the late 1970s, there
was a rapid
1Serrano ® Priest, 96 Cal. Rptr. 601.
2Serrano ® Priest, 135 Cal. Rptr. 348.
DOWNES AND SCHOEMAN420
w xincrease in the private school share. Yet, Sonstelie 22 and
Chamberlain
w x3 claimed only a small fraction of the changes in
California’s private
school enrollment could be attributed to the finance reforms.
In this paper, the conclusions of this previous work are
questioned. The
estimates presented here make a strong case that the reform’s
impact on
the enrollment share of private schools was large. The failure of
earlier
work to consider several important determinants of demand for
education
led to understatement of the estimated effects of reform. The
analysis
below explores the impact of the potential biases and presents
improved
estimates of the response to finance reforms.
The remainder of this paper is divided into six sections. The
next section
places California’s trends in private school enrollment in a
national con-
text. The third section outlines the empirical model used to
examine the
relationship between finance reforms and changes in aggregate
demand
for public schooling. That section also includes discussion of
how varia-
tions in individual tastes can be incorporated into the
specification of
aggregate demand. The fourth section describes the data used in
the
analysis. One important aspect of the data is inclusion of
information on
projected future public school spending levels, of particular
value since the
effects of reforms were not fully observable in the distribution
of per pupil
expenditures in 1980.
The fifth section provides estimates of the empirical model.
These
estimates confirm the importance of accounting for unobserved
determi-
nants of demand common to residents of a locality and for
heterogeneity
of individual demand. The results also support the argument
that individu-
als’ schooling decisions depend on expectations of future
quality of educa-
tion. These findings are confirmed by simulation results in
Section 6. The
final section summarizes the results and discusses their
implications for
policy and future research.
2. NATIONAL TRENDS IN PRIVATE SCHOOL
ENROLLMENT
Figure 1 includes plots of the percent of total students enrolled
in
California private schools and the percent in the nation for the
period
from 1972]73 to 1979]80. Nationally, approximately 10.0% of
all students
attended private school for the entire eight-year period, with a
mild
upswing in private school enrollment over the last few years of
the decade.
In California, after an initial downswing, in 1974 a period of
rapid and
sustained growth in the private school share began.3 The
number of
3The growth in the fraction private in the 1970s was at variance
with previous history in
California. In 1890, 8.81% of the enrollees in California
attended private schools. The
fraction of students in private schools remained at about this
level throughout the 20th
century.
FINANCE REFORM AND PRIVATE SCHOOL ENROLLMENT
421
FIG. 1. Trends in private share: reform states.
students served by private schools increased by 22.35% to
497,613 stu-
dents, while the number served by public schools fell by 6.6%
to 4,119,511
students. This unprecedented change in the role of the private
schooling
sector coincided with the initial state response to Serrano I.
Figure 1 also gives trends in the private school share in several
other
states that implemented school finance reforms.4 The fraction
attending
private schools grew in most of these states, with Minnesota the
lone
exception. Still, even if reforms explain part of the increase in
the fraction
private, there were potentially diverse and unique factors
leading to
growth in each state. For example, in South Carolina much of
the exodus
of students from the public schools was attributable to
implementation of
desegregation programs. Nonetheless, the differences between
reform
states and the nation as a whole in the growth of the enrollment
share of
private schools indicate that the California experience may not
have been
unique. Further exploration of the relationship between the
growth in
the private school share and the implementation of finance
reforms is
warranted.5
4Enrollment shares were obtained from statistical abstracts
issued by the states. Reform
states are those states which implemented school finance
reforms intended to reduce
w xinequalities across school districts in per pupil spending.
See 1 for a list of reform states. Of
the states in this figure, only California and Washington
reformed their school financing
systems in response to court mandates.
5
w xThe need for such further exploration is also suggested by
Schmidt 20 , who, in examining
cross-MSA variation in private school enrollment, finds
evidence of a positive link between
the existence of state-imposed limits on revenue increases and
private school shares.
DOWNES AND SCHOEMAN422
The large interstate variation in the structure of education
financing and
in the nature of finance reforms implies that cross-state
comparisons of
aggregate trends are likely to fail to reveal many of the critical
dynamics of
public]private choice. We instead focus on the changes within
California.
The disparate effects on different districts of the finance
reforms make
California a natural case for evaluating the relationship between
private
school enrollment and finance reform.
3. AN EMPIRICAL FRAMEWORK
The starting point for the empirical model is the now standard
random
utility model. To apply this model in this context, several
assumptions need
to be made about the nature of individual choice. First,
individuals are
assumed to be immobile in the short run.6 In other words, the
local public
school is the only public alternative in the choice set. The
second assump-
� .tion limits alternative schooling choices private schools to
those within
the county in which the individual resides.7 Since the empirical
analysis
focuses on the schooling choices of families with children of
elementary
school age, such an assumption is reasonable because
transportation and
time costs make it prohibitively expensive for most students to
attend
school outside of their own county. In the model, we also
assume individu-
als act as if their choices will have no effect on the ability of
the schools to
provide education; individuals are taken to believe there is an
elastic
supply of schooling of a particular price and quantity.8
However, in the
empirical work below, we allow for the possibility that private
school
characteristics are endogenous.
An individual will choose to leave public school and enter
private school
if the utility gained from going to private school is greater than
the utility
6Given the distributional assumptions made below, we only
need maintain the assumption
that the cost of moving to a district providing higher quality
exceeds the costs of attending a
private school of equal or greater quality.
7In several rural counties, the choice set was broadened to
include the county of residence
and one or more neighboring counties.
8In effect, we maintain the assumption that, at any point in
time, the number and location
of private school options and the quality of public school
options are exogenous. Elements of
this assumption are defensible, particularly since the statutory
changes in California severed
any clear dependence of public provision on the share of
students in private schools.
Nevertheless, a more realistic model would make schooling
choice part of a broader public
choice problem in which public schools, private schools, and
individual consumers choose
w xtheir strategies simultaneously. Such an approach is taken
by Sonstelie 23 , where the median
voter framework is adapted to allow for existence of a private
schooling alternative. While
this approach is attractive, it requires maintaining assumptions
that have been questioned in
w xthe literature. See 7 for discussion of the weaknesses and
strengths of the median voter
approach.
FINANCE REFORM AND PRIVATE SCHOOL ENROLLMENT
423
gained from attending public school. In period t, the current
value to
individual i from a given schooling alternative j is assumed to
take the
form
U s Q Z , X , F; b q e 1� .� .i jt jt i t t i jt
for i s 1, . . . , n, j s 0, . . . , M, where j s 0 is the public
alternative and
� .j s 1, . . . , M the various non-public alternatives, Q Z , X ,
F; b reflectsjt i t t
the quality individual i thinks he or she will receive from choice
j, Z is ajt
� .vector of individual expectations on current and possibly
future attributes
of alternative j, X is a vector of individual i’s characteristics, e
is ani t i jt
error term with mean zero, and F is a temporally stable effect
that varies
across districts but is the same for individuals within a district.
For ease of
presentation, in the remainder of this section, we omit the time
subscript.
Nevertheless, in the empirical work that follows, we allow for
cross-time
� .variation of the type reflected in 1 .
An individual will choose to attend public school if
U ) U , j s 1, . . . , M.i0 i j
In other words, public school is chosen if
e y e ) Q Z , X , F; b y Q Z , X , F; b , 2� . � .� .i0 i j j i 0 i
for j s 1, . . . , M. If we assume the e are Type-I extreme value,
thei j
� .probability an individual chooses public schooling,
designated by P X , b ,0 i
is
exp Q Z , X , F; b� .� .0 i
P X , b s� .0 i ⌥ exp Q Z , X , F; b� .� .J j i
1
s . 3� .
1 q ⌥ exp Q Z , X , F; b y Q Z , X , F; b� .� .J j i 0 i
� .Equation 3 is the standard conditional logit model.
If information on choices of individuals is available, the
parameters of
� .1 can be estimated directly. For the period in question, no
such individ-
ual data are available. Instead, we have observations on the
fraction of
individuals in each district choosing public school. There is no
well-accepted
method for moving from individual demand, as summarized by
the choice
� .probabilities 3 , to a specification of aggregate demand.
� w xTo develop a specification of aggregate demand, previous
work e.g., 3 ;
w x.22 typically has assumed demand in each community
corresponds to the
demand of a representative individual. This assumption is
correct if the
DOWNES AND SCHOEMAN424
w xconditions underlying the results of Tiebout 25 hold.
However, if tastes
are not homogeneous, ignoring information on higher order
moments of
the taste distribution will lead to biased results.
Schooling choice is a classic case in which accounting for
heterogeneity
in demand is critical. If communities are homogeneous, public
provision
will equal each individual’s preferred quantity of education.
Private school-
ing is sustainable only if communities are heterogeneous. A
model of
schooling choice that fails to account for heterogeneity is
inherently
contradictory.
To see how controls for taste variation can be built into a model
of
� .aggregate demand, let f x be the density corresponding to the
distribu-
tion of individual characteristics within a district, let n be the
school age
� .population, and let P X; b be the probability of choosing
public school-0
� .ing for an individual with characteristics X given in 3 . Then
the fraction
of individuals choosing public schooling is given by p :0
p s 1rn d� . ⌥0 i
1
s P x; b f x dx, 4� . � . � .H 0
where d is a dummy variable that takes the value of 1 if
individual ii
chooses public schooling and where the second equality follows
from a law
� . � .of large numbers. Expanding P X; b about the mean of X
' m yields0
<p s P m; b q x y m 9 ≠ P x; b r≠ x� . � . � .� .H � xsm.0 0 0
<
q1r2 x y m 9 ≠ P x; b r≠ x ≠ x 9 x y m q R x f x dx� . � . � . �
. � .� .� .� xsm.0
5� .
� .where R X is the remainder term. After integration, the
second term
� . � � .drops out. Let M be the k, l element of the matrix ≠ P
x; b rk l 0
. < � . �� .� . .
≠ x ≠ x 9 and s be the k, l element of E X y m X y m 9 . Then�
xsm. k l
p s P m; b q 1r2 M s q E R X .9 6� . � . � .� .⌥ ⌥0 0 k l k l X
k l
9
w xAs an alternative, Boyd and Mellman 2 assume tastes are
parameterized by b and allow
� .
b to vary in the population. Then, if individual characteristics
enter Q Z , X , F; b linearly,j i
� . � . � . �equation 4 becomes p s H P b f b db. Boyd and
Mellman assume b s exp m q0 0 m m
.R s , where R is a vector of independent standard normal
random variables. Theym m m
estimate the parameters using Monte Carlo integration.
FINANCE REFORM AND PRIVATE SCHOOL ENROLLMENT
425
� � .. � .If we assume E R X is negligible, Eq. 6 gives a
specification ofX
aggregate demand estimable with available data. The equation
implies that
the fraction choosing public schooling depends on variations in
community
characteristics, not just means. Note that if s s 0 for all k and l,
thenk l
� .Eq. 6 reduces to the representative consumer specification
used in
w xprevious work 3, 22 . If s / 0 and there is a correlation
between thesek l
higher order moments and mean characteristics, omitting these
moments
will result in biased estimates.10
� .Several aspects of the specification of aggregate demand in 6
are
worthy of comment. In moving from the specification of
individual demand
� . � .in 3 to the specification in 6 , no new parameters are
introduced. The
� .parameters b enter both in P m, b and in the derivative terms
M .0 k l
� .Since 6 is therefore nonlinear in these parameters, they can
be estimated
via nonlinear least squares. In addition, most of the data
required to
� .estimate 6 are provided in the Decennial Census. Available
for each
� .district are the fraction of students attending public school p
, the means0
� .
m of the characteristics of those choosing a schooling option,
and the
cross-tabulation information needed to calculate variances and
covariances
� . � . � .
s of those characteristics. Finally, since 3 is the basis for 6 , itk
l
� .continues to be the case that, if Q Z , X , F, b is linear in the
characteris-j i
tics of the choices Z , then aggregate demand depends only on
thej
differences between the characteristics of the public schools and
the
� .characteristics of the private alternatives. In other words, as
in 3 , the
coefficents are applied to the difference between the
characteristics of
each private school and the district’s public schools, summed
across all
private schools in the relevant county.
� .Since the specification of aggregate demand in 6 is based on
the
� .random utility model 1 , any potential determinant of
schooling demand
that does not vary across alternatives can only have an effect on
demand if
� . w xin 1 this determinant ‘‘interact s with a variable that
varies across
w xalternatives’’ 26, p. 27 . For this reason, we present
estimates derived from
specifications in which all individual characteristics enter only
through
their interaction with the pupil-teacher ratio.11
� .Moving from 6 to a workable characterization of aggregate
demand
requires dealing with a number of concerns raised in the
literature. Several
� w x w x.authors have argued Goldstein and Pauly 13 ; Reid
19 that, if individu-
als sort themselves into homogeneous communities, unobserved
determi-
10
w xSee 17 for an alternative discussion of the biases that can
arise if heterogeneity in tastes
is ignored.
11Since it is well established that Catholics may view public
and private schools differently,
we also estimated specifications that included the interaction of
fraction Catholic with school
type. The coefficient on this interaction did not differ
significantly from zero.
DOWNES AND SCHOEMAN426
nants of demand common to all residents may be correlated with
observ-
able individual and school characteristics. For example,
individuals who
are likely to attend private school may choose to reside in
communities
with low tax rates and high pupil]teacher ratios. Ignoring such
school-dis-
trict-specific effects can lead to biased estimates. Since we have
data on
� .private schooling shares in 1970 and 1980, we can estimate
variants of 6
that include the temporally stable, district-specific effects F
noted above.
A critical element of the choice model above is the diversity of
the
choice set of schooling alternatives. Previous research has
either omitted
characteristics of the private alternatives or assumed the choice
was
between the public alternative and a private alternative with
attributes
equal to the means of these attributes taken over all private
schools in the
region. But, just as biases can be generated by incorrectly
assuming there
is a representative individual, biased estimates can result if it is
assumed
there is a representative private school. In most of the counties
in this
sample, the private schooling options are heterogeneous and
thus poorly
� .approximated by a representative school. The specification
of P X; b0
� .given in 3 enables us to control directly for the heterogeneity
of the
private schooling options.
There are, however, two potential drawbacks to the conditional
logit
� .specification in 3 . The first of these is the imposition of
independence of
irrelevant alternatives implicit in this functional form. In the
context of the
w xfamous red bus]blue bus example, Train 26 notes that the
IIA problem
can be solved by including a bus-specific constant. Thus, by
including a
constant common to all private schools, we can lessen the IIA
problem.12
The second potential drawback of the conditional logit
specification in
� .3 is the fact that, ceteris paribus, the probability of attending
public school
is lower in regions with more private alternatives.
Mechanistically, this
drawback results from the fact that, all else equal, the more
private
� .alternatives there are, the smaller is the denominator of 3 .
The inclusion
of district-specific effects ameliorates this problem. Two
individuals can
face schooling options that have the same measurable attributes,
can have
the same personal characteristics, and can have different
probabilities of
attending public school if, in one district, the public schools are
viewed
more positively than in the other district. As a result, the mean
probability
of attending public school can be high in a district in which
there are many
private alternatives.
12Other tractable solutions to the IIA problem require dividing
the private schools into
smaller groups. Then group-specific constants can be estimated
for each type of private
� .school or the nested logit form of P X, b can be used. Finer
groupings of the private0
schools were tried. Since the null of equality of the group-
specific constants could not be
� .rejected, we chose to present the estimates of the simpler
specification given in 3 .
FINANCE REFORM AND PRIVATE SCHOOL ENROLLMENT
427
One final specification consideration is that the characteristics
of the
schooling choices should include expectations about future
quality of
education. If changing schools is costless, individuals would act
as if the
only relevant information is the present quality of education.
Future
expectations would be unimportant, since waiting to transfer is
costless.
However, if changing schools imposes costs on the student who
transfers,
future expectations of school quality might alter an individual’s
decision to
remain in a particular school. If an individual currently enrolled
in public
school expects the quality of education in that school to fall in
the future
and future transfers are costly, then that student may decide to
transfer to
private school in the present period.13 In California in both
1970 and 1980,
current attributes of private schools were the best available
information on
future provision in those schools. Similarly, in 1970 public
school districts
had full control of spending; current provision was the best
available
information on future provision. But in 1980, the effects of
school finance
reform on future schooling provision had not been fully
reflected in
current provision. Other information, specifically the revenue
limit formu-
las that determined future spending, was potentially
instrumental in the
formation of expectations on future school quality. Districts
with slower
projected growth in revenue limits would have slower growth in
per pupil
spending. We explore the possibility that expectations of future
provision
were important by testing to see if the changes in the revenue
limits help
explain aggregate demand in 1980.
We consider below specifications of the aggregate demand for
public
� .schooling implied by 6 , starting with the representative
consumer version
typically considered in the literature. We use these results as a
starting
point to determine if previous conclusions concerning the
limited effects of
school finance reform hold up when expectations on future
school quality,
heterogeneity of tastes, and common, unobserved determinants
of demand
are taken into account.
13
w xDownes and Schoeman 9 contains a more rigorous
discussion of the role of expectations
on schooling choices when switching is costly. Another
argument for including measures of
w xfuture limits is suggested by Stiglitz 24 , in which he shows
that multiple equilibria in public
schooling provision are likely. If multiple equilibria exist, local
control over tax rates enables
the locality to coordinate the activities of its residents and
maintain a high activity equilib-
� .rium high tax and public provision . This high activity level
is feasible after the policy
changes of the late 1970s if each individual makes large
voluntary contributions to the public
schools, but no mechanism exists to coordinate at this
equilibrium. The result can be a low
� .activity equilibrium less spending on public education and a
larger private sector , even if the
w xexistence of peer group effects implies the high activity
level is Pareto superior 5 .
DOWNES AND SCHOEMAN428
4. DATA
The data set used for this analysis consists of observations on
223
� . 14unified K]12 school districts in California in 1970 and
1980. The data
were drawn primarily from three sources: National Center of
Education
� .Statistics NCES surveys of private schools, California
Department of
Education records on school district finances and student
characteristics,
and the 1970 and 1980 Censuses of Population and Housing.
The NCES collected information on private school
characteristics in
1970]71 and 1978]79. For each year, the data include
information on
enrollment, staffing, location, religious affiliation, and type of
school
� . 15elementary, high school, special education .
The NCES data have three major problems. First, sparsity of
school
characteristics limits our ability to control for private school
quality.
Second, incomplete reporting results in omission of key
variables for some
schools. Finally, the price and quality of private education are
potentially
endogenous, since, in equilibrium, these variables depend on
unobserved
determinants of demand. To cope with the latter two problems,
we
estimated regressions of pupil]teacher ratios on school
characteristics
� .assumed to be exogenous religious affiliation, program type,
and location .
From these regressions, we determined predicted pupil]teacher
ratios.
The estimates presented below use these predicted values for
private
school characteristics.16 Even with these problems, the data on
private
school characteristics are more detailed than those used in
previous work.
Budgetary data from 1970 and 1980, compiled by the California
Depart-
ment of Education from accounting records of the school
districts, are the
source for much of the public school data. These reports include
informa-
tion on per pupil expenditures in and the location of the public
schools.
District-level data on student characteristics and performance
on standard-
ized tests are drawn from the California Assessment Program
data base.
These data were supplemented using printed reports giving
revenue
limits for the school districts for 1979 and 1985. In response to
the Serrano
decisions, the state placed ceilings on the amount districts could
spend on
each student. These revenue limits were first calculated in
1972]73 and
were based on the sum of each district’s locally generated
revenues and
w xnoncategorical state aid 6 . The state forced the range in
these ceilings on
per pupil expenditures to contract over time. Since the finance
reform
14The reasons for limiting our consideration to these districts
are given below. In 1980
63.9% of the students in grades K]8 resided in these districts.
15Average tuition data are not available for 1970]71 and are
available for a limited set of
schools in 1978]79. As a result, we cannot include a tuition
measure in the analysis below.
16
w xFor a further discussion of problems with the 1978]79 NCES
data, see 7 .
khalid alharbi
khalid alharbi
khalid alharbi
FINANCE REFORM AND PRIVATE SCHOOL ENROLLMENT
429
legislation established the formula for calculating these revenue
limits,
future revenue limits provide clear and observable signals of the
future
direction of public provision.
Demographic information was drawn from the 1970 and 1980
Censuses.17
For each school district, both censuses provide information on
the fraction
of students attending public and private school, the fraction of
the popula-
tion in particular income brackets, the racial composition of the
student
population, the fraction of the adult population with particular
levels of
educational attainment, and the fraction of families with
children. The
censuses include no direct information on the religious
affiliation of the
population of school districts. We proxied for the fraction
Catholic in each
school district using county-wide data from surveys of church
membership
conducted in 1970 and 1980 by the National Council of
Churches of
Christ.18
Finally, data on busing and other desegregation programs are
drawn
from New E®idence on School Desegregation, prepared for the
United
w xStates Commission on Civil Rights by Finis Welch and
Audrey Light 27 .
This report only includes information on the larger school
districts and
may thus fail to account for all desegregation programs, though
few small
districts were subject to court-ordered desegregation.
Table 1 presents the means and standard deviations of variables
used in
the analysis. Table 2 presents relationships between some of the
variables
of interest. Growth in district resources was influenced by
reforms; expen-
ditures grew more slowly and pupil]teacher ratios more rapidly
in districts
with slower growth in revenue limits. Given this observation,
the positive
correlation between the change in the fraction attending private
school
and the change in the pupil]teacher ratio is consistent with
finance
reforms contributing significantly to private sector growth.
Further, since
pupil]teacher ratios grew more rapidly in districts facing the
constraints
17The 1970 Census data are not available for smaller districts.
In California, most of the
districts for which data were not available were elementary
school districts. Since we were
concerned about the randomness of the elementary districts for
which data were available, we
chose to limit our analysis to the unified districts, for which
there was not a similar sample
selection problem.
18We also considered a measure constructed from the number of
non-Hispanic individuals
residing in the district whose heritage was an historically
Catholic country. While this latter
measure allowed for within-county variation in the fraction
Catholic, the empirical results
with the county-wide measure were more reasonable and more
consistent with previous
research on schooling demand.
khalid alharbi
khalid alharbi
khalid alharbi
khalid alharbi
khalid alharbi
khalid alharbi
khalid alharbi
DOWNES AND SCHOEMAN430
TABLE 1
aMeans and Standard Deviations of Variables
1970 1980
Standard Standard
Variable Mean deviation Mean deviation
Fraction in 0.942 0.048 0.908 0.055
public schools
Per pupil 2270.15 613.68 2408.02 422.90
bexpenditures
Public school pupil] 22.454 2.942 27.229 2.491
teacher ratio
Fraction African- 0.038 0.086 0.047 0.102
American
Fraction Hispanic 0.189 0.150 0.244 0.188
Fraction Catholic 0.185 0.043 0.188 0.063
Mean family income 25148.34 7929.86 24641.87 7468.33
Fraction of families 0.197 0.086 0.196 0.079
with income under $10K
Fraction of families 0.053 0.061 0.071 0.068
with income over $50K
Fraction with less 0.426 0.123 0.282 0.124
than high school
Fraction high school 0.347 0.057 0.331 0.063
graduates
Fraction with some 0.162 0.053 0.214 0.046
college
Fraction college 0.066 0.051 0.172 0.108
graduates
Change in revenue } } 52.69 114.74
limit, 1985]1979
Pred. private school 22.808 9.593 20.858 7.481
pupil]teacher ratio
aThe sample consists of 223 public school districts, 1505
private schools in 1970, and 2130
private schools in 1980.
bAll dollar values are in 1980 dollars.
implicit in the Serrano-inspired reforms,19 these correlations
support the
contention that a significant portion of the growth in the private
school
share could be attributed to a response in wealthier districts to
the finance
reforms. Finally, the strength of the negative correlation
between the
19In the quarter of the sample with the slowest growth in
revenue limits from 1979 to 1985,
the pupil]teacher ratio increased by 6.35 from 1970 to 1980. For
the quarter of the sample
with the most rapid growth in revenue limits, the pupil]teacher
ratio grew by only 3.90 in the
period from 1970 to 1980.
FINANCE REFORM AND PRIVATE SCHOOL ENROLLMENT
431
TABLE 2
� .Correlation Coefficients for 223 Districts p-Values in
Parentheses
Change in Change in Change in Change
fraction Per pupil pupil] Mean family revenue in per
attending assessed teacher income, limit, 1979 pupil
Variables private value, 1970 ratio 1980 to 1985 expends
Change in 1.000
� .fraction 0.000
attending
private
Per pupil 0.066 1.000
� . � .assessed 0.329 0.000
value, 1970
Change in 0.184 0.285 1.000
� . � . � .pupil] 0.006 0.0001 0.000
teacher
ratio
Mean family y0.086 0.141 y0.103 1.000
� . � . � . � .income, 1980 0.203 0.036 0.124 0.000
Change in y0.118 y0.662 y0.383 y0.129 1.000
� . � . � . � . � .revenue 0.079 0.0001 0.0001 0.055 0.000
limit, 1979
to 1985
Change in 0.025 y0.503 y0.208 y0.309 0.400 1.000
� . � . � . � . � . � .per pupil 0.715 0.0001 0.002 0.0001
0.0001 0.000
expenditures
change in the fraction attending private school and the change
in the
revenue limit shows the movement of Californians to private
schools was
larger in districts facing constraints on the future growth of per
pupil
expenditures.
5. EMPIRICAL RESULTS
In this section we present estimates of the parameters of two
variants of
� .Eq. 6 , each estimated using nonlinear least squares. The
first specifica-
� w x.tion closely resembles regressions estimated in previous
work e.g., 3 ,
with school-district-specific effects and information on the
distribution of
individual characteristics omitted. This specification differs
from specifica-
tions in earlier work only in that it includes controls for the
attributes of
private alternatives. These estimates thus provide a base case
for gauging
the importance of the omission of district-specific effects and
measures of
demand heterogeneity.
Table 3 presents estimates of two parameterizations of this
specification
� .of 6 ; Table 4 gives the corresponding mean elasticities for
these parame-
DOWNES AND SCHOEMAN432
TABLE 3
Dependent Variable, Fraction Attending Public Schools; Form
of Probability, Multinomial
a �Logit ; Estimation Method, Minimum Distance Asymptotic
Standard Errors
.in Parentheses
� .Eq. 2
� .Eq. 1 1970 1980
� .Year dummy 1980 s 1 0.869 1.147
� . � .0.166 0.123
� .Pupil]teacher ratio x.1 y7.401 y9.960 y6.888
� . � . � .0.452 7.911 0.088
� .Square of pupil]teacher ratio x.1 1.399 1.607 1.153
� . � . � .0.297 0.102 0.034
Dummyindicating presence of bussing y0.466 y0.571 y0.345
� . � . � .0.019 0.169 0.014
� . � .Change in revenue limit 1985]1979 x.0001 0.262 0.649
� . � .0.614 0.115
� .Interaction of pupil]teacher ratio x.1 with:
� .Family income x.0001 0.156 0.299 0.134
� . � . � .0.060 0.035 0.015
Fraction of individuals Roman Catholic 1.065 19.292 1.190
� . � . � .0.731 1.433 0.167
Fraction of individuals with less than high 1.501 y3.253 0.894
� . � . � .school education 2.099 7.723 0.268
Fraction of individuals with high school y0.660 6.548 y0.530
� . � . � .education only 0.269 6.040 0.122
Fraction of individuals with some college 0.012 y14.992 1.212
� . � . � .education 4.010 15.568 0.519
Fraction of students African-American y0.294 0.853 y0.180
� . � . � .0.029 0.154 0.031
Fraction of students Hispanic y0.027 y0.824 0.486
� . � . � .0.149 0.290 0.053
Sum of squared residuals 1.686 1.621
Mean predicted fraction private, 1970 0.938 0.938
Mean predicted fraction private, 1980 0.887 0.893
aEach regression includes a constant. As indicated in the text,
the choice set for each
individual is assumed to include all private schools in the
county in which the individual
resides.
� .terizations. Since each demographic variable enters 3
through its interac-
tion with the public and private school pupil]teacher ratios, the
elasticity
with respect to that variable for any given district is the product
of the
predicted private school share, the value of the variable, the
coefficient on
the corresponding interaction, and a weighted average of the
difference
between the pupil]teacher ratios of the public school and the
private
FINANCE REFORM AND PRIVATE SCHOOL ENROLLMENT
433
TABLE 4
Elasticity of Fraction attending Public Schools with Respect to
Characteristics
� .of the Public Schools and the Population Based on Parameter
Estimates in Table 3
� . � .Eq. 1 Eq. 2
1970 1980 1970 1980
� .Pupil]teacher ratio x.1 0.0212 0.1661 0.0354 0.0863
Dummyindicating presence of bussing y0.0006 y0.0026 y0.0009
y0.0018
� . � .Change in revenue limit 1985]1979 x.0001 0.0004
0.0009
� .Family income x.0001 0.0049 0.0318 0.0041 0.0296
Fraction of individuals Roman Catholic 0.0025 0.0169 0.0075
0.0205
Fraction of individuals with less than high 0.0066 0.0263
y0.0022 0.0172
school education
Fraction of individuals with high school y0.0031 y0.0159
0.0049 y0.0138
education only
Fraction of individuals with some college 0.00003 0.0002
y0.0196 0.0224
education
Fraction of students African-American y0.0002 y0.0020
y0.0002 y0.0013
Fraction of students Hispanic y0.0001 y0.0004 y0.0006 0.0086
schools in the choice set.20 As is apparent from Table 1, this
weighted
average tended to be positive in 1980 since the public school
pupil]teacher
ratio was, in most districts, larger than the pupil]teacher ratios
for the
private schools in the choice set. Thus, for most districts in
1980, the sign
on the elasticity of the demographic variables was the same as
the sign on
the estimated coefficient on the interaction. Such was not
always the case
in 1970, since private school pupil]teacher ratios were
frequently larger
than public school pupil]teacher ratios.
The estimates in the first column result when we impose the
restriction
that aggregate demand for private schooling was stable across
time. The
second and third columns present estimates for the specification
that
allows aggregate demand to differ between 1970 and 1980.
Allowing the
specification of aggregate demand to change over time permits
us to
consider the possibility that attitudes toward public education
differed
20For the kth element of X, if Z is the pupil]teacher ratio for
option j, the elasticity isj1
ˆ ˆ
e s 1 y P X , b b X Z y Z v ,� .� . � .� . ⌥k 0 k k 01 j1 j
j
where
ˆ ˆexp Q Z , X , F; b y Q Z , X , F; b� .� .j 0
v s .j ˆ ˆ⌥ exp Q Z , X , F; b y Q Z , X , F; b� .� .j j 0
khalid alharbi
khalid alharbi
khalid alharbi
khalid alharbi
DOWNES AND SCHOEMAN434
post- vs. pre-reform. Serrano and Proposition 13 did more than
simply
reduce inputs to public education; the constraints on local
discretion
changed the nature of public education in California. That this
change
could have altered the nature of aggregate demand seems
plausible ex
post. The estimates confirm that the underlying structure of
demand
differed between 1970 and 1980.21
Each of these specifications differs substantively from those
used in the
previous literature, but the implications of the estimates are not
different.
Inputs to the schooling process, measured here by the
pupil]teacher ratio,
are significant determinants of the demand for public schooling,
as is
apparent from the significant coefficients on the linear term, the
quadratic
term and many of the interaction terms. But the implied
elasticity of
demand with respect to the public school pupil]teacher ratio is
positive in
each year, counter to expectations. These estimates do not
support the
conclusion that reform-induced changes in the pupil]teacher
ratio con-
tributed to the move to private schools.
The estimated effects of the prospective change in the revenue
limit
temper the conclusion that there were no effects of reform.
Districts facing
future constraints in spending capabilities, as indicated by
negative real
growth in their revenue limits, have lower fractions of students
attending
public school in 1980. However, the magnitudes of the changes
in revenue
limits and of the elasticity of demand with respect to these
changes are not
sufficient to explain a significant portion of the exodus to
private schools.
w x w xThese results parallel those of Sonstelie 22 and
Chamberlain 3 :
families making schooling choices do not appear to have been
sensitive to
the reforms in public school finance. However, the specification
of aggre-
gate demand on which this conclusion is based fails to account
for
observed heterogeneity in the population of each district or for
unobserved
commonalities in the determinants of demand. That these
omissions are
critical to the conclusion that reforms do not matter is apparent
from the
results in Tables 5 and 6, which present estimates and the
corresponding
� .elasticities of variants of 6 that control directly for both
district-specific
effects and heterogeneity in the population of each district.22
21The Wald test statistic of the null of equality is distributed as
a x 2 random variable with
10 degrees of freedom. Since the value of the test statistic is
7891.2, we reject the null of
equality.
22In the estimation, we include dummyvariables for each
district. Because we have data for
each district, such a specification can be estimated. In effect,
we are assuming that there are
many individuals in each locality whose demand is influenced
by some common effect. As
long as we assume the asymptotics are driven by increases in
the number of people in each
community, all of the parameters can be estimated consistently.
khalid alharbi
khalid alharbi
FINANCE REFORM AND PRIVATE SCHOOL ENROLLMENT
435
TABLE 5
Dependent Variable, Fraction Attending Public Schools; Form
of Probability, Multinomial
a �Logit ; Estimation Method, Minimum Distance Asymptotic
Standard Errors
.in Parentheses
� .Eq. 2
� .Eq. 1 1970 1980
� .Year dummy 1980 s 1 0.296 1.450
� . � .0.048 0.108
� .Pupil]teacher ratio x.1 3.654 3.704 4.817
� . � . � .0.284 0.409 0.418
� .Square of pupil]teacher ratio x.1 y0.390 y0.170 y0.754
� . � . � .0.047 0.042 0.066
Dummyindicating presence of bussing y0.032 y0.292 y0.070
� . � . � .0.013 0.021 0.015
� . � .Change in revenue limit 1985]1979 x.0001 0.701 0.573
� . � .0.142 0.133
� .Interaction of pupil]teacher ratio x.1 with:
� .Family income x.0001 0.024 0.006 0.062
� . � . � .0.015 0.017 0.009
Fraction of individuals Roman Catholic y5.852 y7.514 y5.784
� . � . � .0.224 0.445 0.289
Fraction of individuals with less than high y2.731 y4.192
y0.415
� . � . � .school education 0.163 0.328 0.323
Fraction of individuals with high school 0.585 0.737 y1.198
� . � . � .education only 0.223 0.260 0.261
Fraction of individuals with some college y1.543 y4.364 2.130
� . � . � .education 0.244 0.467 0.440
Fraction of students African-American 0.502 0.521 y0.177
� . � . � .0.063 0.128 0.078
Fraction of students Hispanic 1.846 3.073 y0.418
� . � . � .0.103 0.133 0.113
Sum of squared residuals 0.145 0.118
Mean predicted fraction private, 1970 0.908 0.907
Mean predicted fraction private, 1980 0.867 0.867
aEach specification includes district-specific effects. As
indicated in the text, the choice set
for each individual is assumed to include all private schools in
the county in which the
individual resides.
One note of caution concerning the interpretation of the results;
the
census data provided less than perfect information for
calculating covari-
ances between demographic variables. Data on mean income for
each
education level were available only at the state level. The
variance of
income needed to be rescaled to make the model estimable.23
Also,
23The variance of income was multiplied by 10y8; the
covariances of income with
education and race were multiplied by 10y4.
DOWNES AND SCHOEMAN436
TABLE 6
Elasticity of Fraction attending Public Schools with Respect to
Characteristics of the Public
� .Schools and the Population Based on Parameter Estimates in
Table 5
� . � .Eq. 1 Eq. 2
1970 1980 1970 1980
� .Pupil]teacher ratio x.1 0.0015 y0.0086 y0.0034 y0.1381
Dummyindicating presence of bussing y0.0001 y0.0002 y0.0003
y0.0005
� . � .Change in revenue limit 1985]1979 x.0001 0.0024
0.0024
� .Family income x.0001 y0.0002 0.0020 0.00001 0.0069
Fraction of individuals Roman Catholic 0.0019 y0.0038 y0.0008
y0.0558
Fraction of individuals with less than high 0.0009 y0.0207
y0.0009 y0.0052
school education
Fraction of individuals with high school y0.0003 0.0058 0.0001
y0.0175
education only
Fraction of individuals with some college 0.0007 y0.0107
y0.0004 0.0202
education
Fraction of students African-American y0.0002 0.0011
y0.00003 y0.0006
Fraction of students Hispanic y0.0004 0.0125 y0.0003 y0.0053
religious affiliation was assumed to be independent of other
demographic
characteristics.
Even with this imperfect accounting for heterogeneity, the
qualitative
implications of the estimates are substantively changed from
those in
Table 3.24 The major change is in the response of demand to
changes in
w xthe public school pupil]teacher ratio. While, as Sonstelie 22
found,
in 1970 the elasticity of demand with respect to the
pupil]teacher ratio
is small, in 1980 demand for public schooling falls dramatically
as the
pupil]teacher ratio increases. For example, the mean elasticity
of demand
� .with respect to a change in the pupil]teacher ratio for Eq. 2
in 1980
implies that a 21.3% increase in the pupil]teacher ratio in the
public
schools, an increase equal to the difference in the mean
pupil]teacher
ratios between 1970 and 1980, would result in a 2.94% decrease
in the
public school share, all else equal. This is approximately 70%
of the 4.17%
decrease in the mean public school share.
The prospective change in the revenue limit continues to be a
significant
determinant of the fraction public. Further, the elasticity of
public school
demand with respect to this prospective change increases
relative to the
elasticity implied by the estimates in Table 3. Failure to control
for
24 � .We also estimated variants of 6 that accounted for only
district-specific effects or only
for population heterogeneity. Based on these estimates, it
appears that each of these
modifications to the base specification was responsible for
roughly half of the change from
Tables 3 and 4 to Tables 5 and 6.
FINANCE REFORM AND PRIVATE SCHOOL ENROLLMENT
437
population heterogeneity and common, unobserved determinants
of de-
mand results in understatement of the role of changes in the
revenue limit
and, in light of the evidence above, in significant
understatement of the
influence of reform.
The demographic variables are interacted with the pupil]teacher
ratio,
so their effects on demand are only discernable from the
elasticities in
Table 6. The estimates of the effects of the remaining variables
are neither
stable across specifications nor across years, an unsurprising
result given
the scope of the changes in the decade of the 1970s.25 The
estimated effect
� .of income matches expectations only for Eq. 1 in 1970. The
positive
elasticity in 1980 for both equations indicates an increase in
mean family
income increases the fraction of students attending public
schools. Equally
surprising are the negative elasticities for the education
variables. These
elasticities imply that, all else equal, communities with larger
fractions of
individuals with less education have lower public school shares
than do
communities with larger fractions with post-graduate education.
However,
the income and the education results may reflect both the
increased ability
of higher income, better educated families to pay for private
school and
the greater ease with which such families can supplement in-
school inputs.
An equally plausible explanation for the negative education
elasticities is
that these elasticities signal the response to increased
heterogeneity in the
w xbackground of prospective students 14 .
Interpretation of the effects of the racial composition variables
is also
difficult, since the coefficients on these variables reflect two
potentially
disparate effects. First, these variables account for
heterogeneity in indi-
vidual views of public and private schooling. Second, they
reflect potential
responses to differences across communities in the racial and
ethnic
composition of the public schools. For example, the negative
elasticity of
demand with respect to the fraction African-American in 1980
implied by
� .Eq. 2 might imply African-Americans were more likely to
choose private
w xschool. However, in light of the work of Clotfelter 4 , this
result might also
indicate the presence of African-Americans in public schools
led to an
increase in private school attendance of other racial groups.
Unfortu-
nately, no measure of the student composition of public schools
in 1970
exists, preventing us from distinguishing between the two
effects.
In almost every case, the elasticity of public school demand
with respect
to the fraction Catholic is negative, consistent with the
expectation that
communities with larger fractions Catholic have larger fractions
of stu-
25The Wald statistic for the null of equality across time is
1478.8, significant at the 1%
level.
khalid alharbi
DOWNES AND SCHOEMAN438
dents attending private school. Expectations on the effect of the
presence
of desegregation programs are also borne out. Districts with
desegregation
programs have less demand for public schooling.
These results confirm the implications of the trends in the
public school
share in reform states. Reforms and accompanying constraints
on local
discretion contributed significantly to the reduction in the
public school
share. In addition, the estimates above mask an important
difference
between this work and previous work: the inclusion of controls
for the
heterogeneity of private alternatives. Further, the results
abstract away
from the impact of reform on the supply side. The rapid growth
in the
number of private schools, from 1505 in 1970 to 2130 in 1980,
indicates a
supply side response cannot be ruled out. In the next section we
explore
how the public school share would have changed in the absence
of any
changes save for changes on the supply side.
6. SIMULATING THE EFFECTS OF REFORM
In this section, we present results of several thought exercises.
The first
asks how the fraction attending public school would have
changed if the
choice set had remained unchanged from 1970 to 1980, if
demographics
and the structure of demand had remained unchanged, and if the
direct
�effects of the finance reforms as measured by changes in the
pupil-teacher
.ratio and inclusion of the changes in revenue limits were
allowed to take
place. In other words, we use as our baseline estimates the
coefficient
estimates for 1970 in Table 5, Eq. 2. We restrict the private
schooling
options to those schools among the 1505 existing in 1970
located in the
county of residence of the family making the schooling choice,
and we
assume that the district demographics were as in 1970. The
public school
pupil]teacher ratio is assigned its 1980 value, and the influence
of future
expectations is accounted for by including the product of the
change in the
revenue limit and its coefficient. Under these assumptions, we
calculated
for each district the implied public school share.
Since in this simulation we assume that the finance reforms had
no
effect on the private school options or on the choice set, all of
the effects
of limits are assumed to work through changes in the
pupil]teacher ratio
and the revenue limits. These changes could understate or
overstate the
full impact of reform on inputs to education, but understatement
is likely
since no structural or supply-side changes are allowed. Still,
given available
data, this simulation provides the best measure of the magnitude
of the
demand-side effects of reform.
In this first simulation, overstatement of the effects of reform
could
result if some of the growth in the pupil]teacher ratio would
have
occurred in the absence of reform. However, if political support
for public
schooling had slipped, then this upward trend in the
pupil]teacher ratio
khalid alharbi
khalid alharbi
FINANCE REFORM AND PRIVATE SCHOOL ENROLLMENT
439
may have reflected a reduction in the statewide commitment to
public
education. For this reason, we cannot assume that the reforms
only
affected input levels in high wealth districts.26 Nonetheless, to
provide a
range of possible effects of reform, we also consider a variant
of the first
simulation in which we assume that none of the change in the
mean
pupil]teacher ratio and all of the reduction in the dispersion in
the
pupil]teacher ratio were attributable to finance reforms.27 To
implement
this assumption, in 1970 we assigned each district its 1980
pupil]teacher
� .ratio multiplied first by 22.454r27.229 , the ratio of the
mean
pupil]teacher ratios in 1970 and 1980. We continue to fix both
the choice
set and the characteristics of each district’s population at the
1970 levels.
The final thought exercise explores the changes in public school
enroll-
ment when the choice set is allowed to expand but when public
school
characteristics and demographics are fixed at their 1970 levels.
In combi-
nation with the estimates above, these three simulations provide
an indica-
tion of the extent to which the changes in the fraction of
students in public
schools can be attributed to the finance reforms.
Table 7 gives the predicted levels of the fraction attending
public school
under each scenario outlined above along with the actual levels.
The first
simulation indicates that, ceteris paribus, the changes in the
pupil]teacher
ratio from 1970 to 1980, together with the imposition of
spending limits,
would have led to a decrease in the fraction attending public
schools from
0.9071 to 0.8894. This change is 44.5% of the actual change in
the fraction
private. Even if this predicted change is an upper bound on the
reform-in-
duced change in the public school share, the case is made that
the finance
reforms could have generated a significant portion of the change
in
California private school attendance in the late 1970s.
The second simulation indicates that, unless the finance reforms
changed
support for public education at the state level, there is no
persuasive
evidence that the increases in the private school share can be
attributed to
the reforms. If only the reduction in dispersion in the
pupil]teacher ratio
is attributed to the finance reforms, the estimates imply that the
reforms
26It was apparent to most state residents that, after the finance
reforms, any increase in the
state government’s spending on education would be financed by
increases in revenues from
w xCalifornia’s progressive income tax 12 . Further, since high
wealth districts continued to be
w xless dependent on the state for funding their public schools 6
, residents of these districts
would be less affected by slower growth in the state
government’s spending on education.
Reform-induced opposition to increases in state spending could
have resulted in increases in
pupil]teacher ratios even in districts with the lowest property
wealth. The evidence seems to
confirm this view. Between the 1969]70 and 1979]80 school
years, the percentage changes in
average daily attendance in California and in the nation were
essentially equal. In that same
period, the number of teachers increased by 2% in California
and 8.4% in the nation.
27Thanks to an anonymous referee for suggesting this
simulation.
DOWNES AND SCHOEMAN440
TABLE 7
Simulation Results
Variable Mean fraction public
Actual fraction public in 1970 0.9047
Actual fraction public in 1980 0.8670
� .Predicted fraction public in 1970}Eq. 2 , Table 5 0.9071
� .Predicted fraction public in 1980}Eq. 2 , Table 5 0.8673
Predicted fraction public in 1980}Simulation 1 0.8894
Predicted fraction public in 1980}Simulation 2 0.9113
Predicted fraction public in 1980}Simulation 3 0.9055
Note: For description of the simulations, see Section 6 of the
text.
would have had no effect on the private school share. In fact,
the share of
students in the private schools would have decreased slightly
from 0.0929
to 0.0887. Thus, it would seem that the actual impact of the
reforms could
range from no appreciable effect on the private school share to
the 19.1%
decrease in this share implied by the first simulation. The
strength of the
w xattitude changes in California 12 and estimates of the effect
of the
w xfinance reforms on spending on public education in
California 21 suggest
that the changes resulting from the reforms were near the top
end of this
range.
The results of the final simulation are far less dramatic. The
simulation
implies that, if individuals in 1970 had available the schooling
options
present in 1980, the mean fraction in public schools would have
fallen to
0.9055. These supply-side changes explain only 4% of the fall
in public
enrollment. Nonetheless, this simulation supports the argument
that, by
failing to account for the diversity of choices in private
schooling and the
changing nature of the choice set, earlier work has incorrectly
attributed a
portion of the growth in private schooling to time effects
uncorrelated with
observable determinants of demand.
7. CONCLUSION
In this paper we have shown that education finance reform
played a
major role in the rapid decline in California public school
enrollment
during the 1970s. California and other reform states exhibited
markedly
different trends in private school enrollment in comparison to
the rest of
the nation. In California, the rapid growth in the private school
sector
followed the implementation of reforms in response to the first
California
Supreme Court decision in the Serrano case. Further, that
private school
FINANCE REFORM AND PRIVATE SCHOOL ENROLLMENT
441
enrollment increased rapidly after the passage of reforms,
before any real
change in public provision occurred, indicates individuals may
have re-
sponded to changing expectations of future provision in the
public schools.
Previous studies have failed to obtain conclusive results on the
effect of
school financing reform. We argue this failure is attributable to
the
omission of several important determinants of the public school
share of
enrollment. To correct for these omissions, we work from a
simple qualita-
tive choice model to present several modifications to the basic
specifica-
tion of public schooling demand considered in earlier work.
Estimation of this modified specification leads to four main
findings.
First, failure to account for common, unobserved determinants
of demand
results in understatement of the role of reform. Second, the
inclusion of
spending limits, in addition to per pupil expenditures, provides
a truer
measure of perceptions of current and future public school
quality. All the
results are consistent with the claim individuals do make
schooling deci-
sions based on future quality of education. Third, even
relatively simple
controls for heterogeneity in the population that is making
schooling
choices improve the quality of the estimated schooling demand
equations.
That heterogeneity in demand is important should not be
surprising, since,
in the long run, private schooling can only exist if there is
variation in
preferred levels of education provision. Finally, information on
character-
istics of individual private schools provides better insight into
the nature of
individual demand for schooling.
In simulation results, we find a strong case can be made for the
claim
that the Serrano decisions led to a significant increase in the
fraction of
students attending private school. Our best estimate is that, in
the absence
of any changes in private schooling supply, the reform-induced
changes in
public schooling provision led to a change from 1970 to 1980 in
the public
school share equal to about 44.5% of the actual change. This
result may
understate the portion of the enrollment change attributable to
the fi-
nance reforms, since limited information on the determinants of
supply
prevents us from determining the portion of the change in
enrollment
attributable to supply-side responses to the finance reforms.
The main implication of these results is that the full range of
behavioral
responses must be considered when government-imposed limits
on local
discretion are implemented. In the case of school finance
reforms, if
constraints on local choice result in a popular backlash, the
relative
standing of students in poorer districts might be hurt.
Proponents of
finance reforms are correct in arguing that reforms to promote
equity
must account for differences in the costs and revenue-raising
capacities of
school districts. But aid formulas exist that adjust for such
fiscal disparities
while imposing no substantive limits on local choice in
spending. There is
almost no case for forcing equalization by eliminating local
discretion.
DOWNES AND SCHOEMAN442
REFERENCES
1. R. Bahl, D. Sjoquist, and W. L. Williams, School finance
reform and impact on property
taxes, in ‘‘Proceedings of the Eighty-Third Annual Congress of
the National Tax
Association}Tax Institute of America,’’ National Tax
Association, Columbus, OH
� .1990 .
2. J. H. Boyd and R. E. Mellman, The effect of fuel economy
standards on the U.S.
automotive market: An hedonic demand analysis, Transportation
Research}A, 14A,
� .367]378 1980 .
3. J. Chamberlain, Education finance reform and private school
enrollment, manuscript,
Dept. of Economics, Univ. of California at Davis, 1988.
4. C. T. Clotfelter, School desegregation, ‘tipping,’and private
school enrollment, Journal of
� .Human Resources, 11, 28]50 1976 .
5. R. Cooper and A. John, Coordinating Coordination failures in
Keynesian models,
� .Quarterly Journal of Economics, 103, 441]463 1988 .
6. T. A. Downes, Evaluating the impact of school finance
reform on the provision of public
� .education: The California case, National Tax Journal, 45,
405]419 1992 .
7. T. A. Downes, On estimating individual demand for local
public goods from aggregate
� .data, manuscript, Dept. of Economics, Northwestern Univ.
1993 .
8. T. A. Downes and D. N. Figlio, School finance reforms, tax
limits, and student perfor-
mance: Do reforms level-up or dumb down, manuscript, Dept.
of Economics, Tufts
� .Univ. 1997 .
9. T. A. Downes and D. Schoeman, School financing reform and
private school enrollment:
Evidence from California, Working Paper 93-8, Center for
Urban Affairs and Policy
� .Research, Northwestern Univ. 1993 .
10. W. N. Evans, S. Murray and R. M. Schwab, Schoolhouses,
courthouses, and statehouses
� .after Serrano, Journal of Policy Analysis and Management,
16, 10]31 1997 .
11. W. A. Fischel, Did Serrano cause Proposition 13?, National
Tax Journal, 42, 465]473
� .1989 .
12. W. A. Fischel, How Serrano caused Proposition 13, Journal
of Law and Politics, 12,
� .607]636 1996 .
13. G. S. Goldstein and M. V. Pauly, Tiebout bias on the
demand for local public goods,
� .Journal of Public Economics, 90, 131]144 1981 .
14. B. W. Hamilton and M. K. Macauley, The determinants and
consequences of the
� .private]public school choice, Journal of Urban Economics,
29, 282]294 1991 .
15. C. M. Hoxby, All school finance equalizations are not
created equal: Marginal tax rates
� .matter, manuscript, Dept. of Economics, Harvard Univ. 1996
.
16. J. Kozol, ‘‘Savage Inequalities: Children in America’s
Schools,’’ Crown Publishers, New
� .York 1991 .
17. D. McFadden and F. Reid, Aggregate travel demand
forecasting from disaggregated
� .models, Transportation Research Record, 534 1975 .
18. L. O. Picus, Cadillacs or Chevrolets?: The evolution of state
control over school finance
� .in California, Journal of Education Finance, 17, 33]59 1991 .
19. G. J. Reid, The many faces of Tiebout bias in local
education demand parameter
� .estimates, Journal of Urban Economics, 27, 232]254 1990 .
20. A. B. Schmidt, Private school enrollment in metropolitan
areas, Public Finance Quarterly,
� .20, 298]320 1992 .
21. F. Silva and J. Sonstelie, Did Serrano cause a decline in
school spending? National Tax
� .Journal, 48, 199]215 1995 .
FINANCE REFORM AND PRIVATE SCHOOL ENROLLMENT
443
22. J. Sonstelie, Public school quality and private school
enrollments, National Tax Journal,
� .32, 343]353 1979 .
23. J. Sonstelie, The welfare cost of free public schools, Journal
of Political Economy, 90,
� .794]808 1982 .
24. J. E. Stiglitz, Demand for education in public and private
school systems, Journal of
� .Public Economics, 3, 349]386 1974 .
25. C. M. Tiebout, A pure theory of local public expenditures,
Journal of Political Economy,
� .64, 416]424 1956 .
26. K. Train, ‘‘Qualitative Choice Analysis: Theory,
Econometrics, and an Application to
� .Automobile Demand,’’MIT Press, Cambridge, MA 1986 .
27. F. Welch and A. Light, ‘‘New Evidence on School
Desegregation,’’ United States
� .Commission on Civil Rights, Washington, DC 1987 .
1. INTRODUCTION2. NATIONAL TRENDS IN PRIVATE
SCHOOL ENROLLMENTFIG. 1.3. AN EMPIRICAL
FRAMEWORK4. DATATABLE 1TABLE 25. EMPIRICAL
RESULTSTABLE 3TABLE 4TABLE 5TABLE 66.
SIMULATING THE EFFECTS OF REFORMTABLE 77.
CONCLUSIONREFERENCES

More Related Content

Similar to Citation (APA) Greenlee, B. J. (2007). When school advisory co.docx

Hemmer, lynn a cross case state analysis ijobe v2 n1 2014
Hemmer, lynn a cross case state analysis ijobe v2 n1 2014Hemmer, lynn a cross case state analysis ijobe v2 n1 2014
Hemmer, lynn a cross case state analysis ijobe v2 n1 2014William Kritsonis
 
Educational Leaders Must Strive To Increase Resources Available For Their Sch...
Educational Leaders Must Strive To Increase Resources Available For Their Sch...Educational Leaders Must Strive To Increase Resources Available For Their Sch...
Educational Leaders Must Strive To Increase Resources Available For Their Sch...RajaDastan
 
School Segregation is Alive and Well Race, Income and ReformJ.docx
School Segregation is Alive and Well Race, Income and ReformJ.docxSchool Segregation is Alive and Well Race, Income and ReformJ.docx
School Segregation is Alive and Well Race, Income and ReformJ.docxjeffsrosalyn
 
Writing Sample-Policy Memo
Writing Sample-Policy MemoWriting Sample-Policy Memo
Writing Sample-Policy MemoKristine Ona
 
THE COMPLEX AND MULTI-FACETED NATURE OF SCHOOL CONSTRUCTION COSTS: Factors Af...
THE COMPLEX AND MULTI-FACETED NATURE OF SCHOOL CONSTRUCTION COSTS: Factors Af...THE COMPLEX AND MULTI-FACETED NATURE OF SCHOOL CONSTRUCTION COSTS: Factors Af...
THE COMPLEX AND MULTI-FACETED NATURE OF SCHOOL CONSTRUCTION COSTS: Factors Af...Dave Andrews
 
We Must Have Even Higher Expectations For Teachers
We Must Have Even Higher Expectations For TeachersWe Must Have Even Higher Expectations For Teachers
We Must Have Even Higher Expectations For Teachersnoblex1
 
The Fiscal Externalities of Charter Schools: Evidence from North Carolina
The Fiscal Externalities of Charter Schools: Evidence from North CarolinaThe Fiscal Externalities of Charter Schools: Evidence from North Carolina
The Fiscal Externalities of Charter Schools: Evidence from North CarolinaAnalisa Sorrells
 
Week 4 Discussion 1Employee Testing Please respond to the fo.docx
Week 4 Discussion 1Employee Testing Please respond to the fo.docxWeek 4 Discussion 1Employee Testing Please respond to the fo.docx
Week 4 Discussion 1Employee Testing Please respond to the fo.docxcockekeshia
 
Public School Forum's Top 10 Issues 2019
Public School Forum's Top 10 Issues 2019Public School Forum's Top 10 Issues 2019
Public School Forum's Top 10 Issues 2019Liz Bell
 
INCREASING CHOICE IN THE MARKET FOR SCHOOLS: RECENT REFORMS AND THEIR EFFETCS...
INCREASING CHOICE IN THE MARKET FOR SCHOOLS: RECENT REFORMS AND THEIR EFFETCS...INCREASING CHOICE IN THE MARKET FOR SCHOOLS: RECENT REFORMS AND THEIR EFFETCS...
INCREASING CHOICE IN THE MARKET FOR SCHOOLS: RECENT REFORMS AND THEIR EFFETCS...Hilal Taştekin
 
Strategies for Community Engagement in School Turnaround.docx
Strategies for Community Engagement  in School Turnaround.docxStrategies for Community Engagement  in School Turnaround.docx
Strategies for Community Engagement in School Turnaround.docxjohniemcm5zt
 
Impact of consolidation
Impact of consolidationImpact of consolidation
Impact of consolidationlcmsturgis
 
Introduction to the No Child Left Behind Policy
Introduction to the No Child Left Behind PolicyIntroduction to the No Child Left Behind Policy
Introduction to the No Child Left Behind Policyjessamynamy
 
Jared Polis Foundation Education Report Spring 2004
Jared Polis Foundation Education Report Spring 2004Jared Polis Foundation Education Report Spring 2004
Jared Polis Foundation Education Report Spring 2004Lisa Finkelstein
 

Similar to Citation (APA) Greenlee, B. J. (2007). When school advisory co.docx (20)

Hemmer, lynn a cross case state analysis ijobe v2 n1 2014
Hemmer, lynn a cross case state analysis ijobe v2 n1 2014Hemmer, lynn a cross case state analysis ijobe v2 n1 2014
Hemmer, lynn a cross case state analysis ijobe v2 n1 2014
 
Educational Leaders Must Strive To Increase Resources Available For Their Sch...
Educational Leaders Must Strive To Increase Resources Available For Their Sch...Educational Leaders Must Strive To Increase Resources Available For Their Sch...
Educational Leaders Must Strive To Increase Resources Available For Their Sch...
 
School Segregation is Alive and Well Race, Income and ReformJ.docx
School Segregation is Alive and Well Race, Income and ReformJ.docxSchool Segregation is Alive and Well Race, Income and ReformJ.docx
School Segregation is Alive and Well Race, Income and ReformJ.docx
 
Do School Districts Matter?
Do School Districts Matter?Do School Districts Matter?
Do School Districts Matter?
 
Writing Sample-Policy Memo
Writing Sample-Policy MemoWriting Sample-Policy Memo
Writing Sample-Policy Memo
 
THE COMPLEX AND MULTI-FACETED NATURE OF SCHOOL CONSTRUCTION COSTS: Factors Af...
THE COMPLEX AND MULTI-FACETED NATURE OF SCHOOL CONSTRUCTION COSTS: Factors Af...THE COMPLEX AND MULTI-FACETED NATURE OF SCHOOL CONSTRUCTION COSTS: Factors Af...
THE COMPLEX AND MULTI-FACETED NATURE OF SCHOOL CONSTRUCTION COSTS: Factors Af...
 
financing public education.pptx
financing public education.pptxfinancing public education.pptx
financing public education.pptx
 
We Must Have Even Higher Expectations For Teachers
We Must Have Even Higher Expectations For TeachersWe Must Have Even Higher Expectations For Teachers
We Must Have Even Higher Expectations For Teachers
 
Wp 182
Wp 182Wp 182
Wp 182
 
The Fiscal Externalities of Charter Schools: Evidence from North Carolina
The Fiscal Externalities of Charter Schools: Evidence from North CarolinaThe Fiscal Externalities of Charter Schools: Evidence from North Carolina
The Fiscal Externalities of Charter Schools: Evidence from North Carolina
 
12139
1213912139
12139
 
Week 4 Discussion 1Employee Testing Please respond to the fo.docx
Week 4 Discussion 1Employee Testing Please respond to the fo.docxWeek 4 Discussion 1Employee Testing Please respond to the fo.docx
Week 4 Discussion 1Employee Testing Please respond to the fo.docx
 
3 niven done
3 niven done3 niven done
3 niven done
 
DISSERTATION
DISSERTATIONDISSERTATION
DISSERTATION
 
Public School Forum's Top 10 Issues 2019
Public School Forum's Top 10 Issues 2019Public School Forum's Top 10 Issues 2019
Public School Forum's Top 10 Issues 2019
 
INCREASING CHOICE IN THE MARKET FOR SCHOOLS: RECENT REFORMS AND THEIR EFFETCS...
INCREASING CHOICE IN THE MARKET FOR SCHOOLS: RECENT REFORMS AND THEIR EFFETCS...INCREASING CHOICE IN THE MARKET FOR SCHOOLS: RECENT REFORMS AND THEIR EFFETCS...
INCREASING CHOICE IN THE MARKET FOR SCHOOLS: RECENT REFORMS AND THEIR EFFETCS...
 
Strategies for Community Engagement in School Turnaround.docx
Strategies for Community Engagement  in School Turnaround.docxStrategies for Community Engagement  in School Turnaround.docx
Strategies for Community Engagement in School Turnaround.docx
 
Impact of consolidation
Impact of consolidationImpact of consolidation
Impact of consolidation
 
Introduction to the No Child Left Behind Policy
Introduction to the No Child Left Behind PolicyIntroduction to the No Child Left Behind Policy
Introduction to the No Child Left Behind Policy
 
Jared Polis Foundation Education Report Spring 2004
Jared Polis Foundation Education Report Spring 2004Jared Polis Foundation Education Report Spring 2004
Jared Polis Foundation Education Report Spring 2004
 

More from monicafrancis71118

1. Discuss Blockchains potential application in compensation system.docx
1. Discuss Blockchains potential application in compensation system.docx1. Discuss Blockchains potential application in compensation system.docx
1. Discuss Blockchains potential application in compensation system.docxmonicafrancis71118
 
1. Describe the characteristics of the aging process. Explain how so.docx
1. Describe the characteristics of the aging process. Explain how so.docx1. Describe the characteristics of the aging process. Explain how so.docx
1. Describe the characteristics of the aging process. Explain how so.docxmonicafrancis71118
 
1. Dis. 7Should we continue to collect data on race and .docx
1. Dis. 7Should we continue to collect data on race and .docx1. Dis. 7Should we continue to collect data on race and .docx
1. Dis. 7Should we continue to collect data on race and .docxmonicafrancis71118
 
1. Differentiate crisis intervention from other counseling therapeut.docx
1. Differentiate crisis intervention from other counseling therapeut.docx1. Differentiate crisis intervention from other counseling therapeut.docx
1. Differentiate crisis intervention from other counseling therapeut.docxmonicafrancis71118
 
1. Despite our rational nature, our ability to reason well is ofte.docx
1. Despite our rational nature, our ability to reason well is ofte.docx1. Despite our rational nature, our ability to reason well is ofte.docx
1. Despite our rational nature, our ability to reason well is ofte.docxmonicafrancis71118
 
1. Describe the ethical challenges faced by organizations operating .docx
1. Describe the ethical challenges faced by organizations operating .docx1. Describe the ethical challenges faced by organizations operating .docx
1. Describe the ethical challenges faced by organizations operating .docxmonicafrancis71118
 
1. Describe in your own words the anatomy of a muscle.  This sho.docx
1. Describe in your own words the anatomy of a muscle.  This sho.docx1. Describe in your own words the anatomy of a muscle.  This sho.docx
1. Describe in your own words the anatomy of a muscle.  This sho.docxmonicafrancis71118
 
1. Describe how your attitude of including aspects of health literac.docx
1. Describe how your attitude of including aspects of health literac.docx1. Describe how your attitude of including aspects of health literac.docx
1. Describe how your attitude of including aspects of health literac.docxmonicafrancis71118
 
1. Choose a behavior (such as overeating, shopping, Internet use.docx
1. Choose a behavior (such as overeating, shopping, Internet use.docx1. Choose a behavior (such as overeating, shopping, Internet use.docx
1. Choose a behavior (such as overeating, shopping, Internet use.docxmonicafrancis71118
 
1. Case 3-4 Franklin Industries’ Whistleblowing (a GVV Case)Natali.docx
1. Case 3-4 Franklin Industries’ Whistleblowing (a GVV Case)Natali.docx1. Case 3-4 Franklin Industries’ Whistleblowing (a GVV Case)Natali.docx
1. Case 3-4 Franklin Industries’ Whistleblowing (a GVV Case)Natali.docxmonicafrancis71118
 
1. Cryptography is used to protect confidential data in many areas. .docx
1. Cryptography is used to protect confidential data in many areas. .docx1. Cryptography is used to protect confidential data in many areas. .docx
1. Cryptography is used to protect confidential data in many areas. .docxmonicafrancis71118
 
1. Compare and contrast steganography and cryptography.2. Why st.docx
1. Compare and contrast steganography and cryptography.2. Why st.docx1. Compare and contrast steganography and cryptography.2. Why st.docx
1. Compare and contrast steganography and cryptography.2. Why st.docxmonicafrancis71118
 
1. Date September 13, 2017 – September 15, 2017 2. Curr.docx
1. Date September 13, 2017 – September 15, 2017 2. Curr.docx1. Date September 13, 2017 – September 15, 2017 2. Curr.docx
1. Date September 13, 2017 – September 15, 2017 2. Curr.docxmonicafrancis71118
 
1. compare and contrast predictive analytics with prescriptive and d.docx
1. compare and contrast predictive analytics with prescriptive and d.docx1. compare and contrast predictive analytics with prescriptive and d.docx
1. compare and contrast predictive analytics with prescriptive and d.docxmonicafrancis71118
 
1. Creating and maintaining relationships between home and schoo.docx
1. Creating and maintaining relationships between home and schoo.docx1. Creating and maintaining relationships between home and schoo.docx
1. Creating and maintaining relationships between home and schoo.docxmonicafrancis71118
 
1. Compare and contrast Strategic and Tactical Analysis and its .docx
1. Compare and contrast Strategic and Tactical Analysis and its .docx1. Compare and contrast Strategic and Tactical Analysis and its .docx
1. Compare and contrast Strategic and Tactical Analysis and its .docxmonicafrancis71118
 
1. Coalition ProposalVaccination Policy for Infectious Disease P.docx
1. Coalition ProposalVaccination Policy for Infectious Disease P.docx1. Coalition ProposalVaccination Policy for Infectious Disease P.docx
1. Coalition ProposalVaccination Policy for Infectious Disease P.docxmonicafrancis71118
 
1. Company Description and Backgrounda. Weight Watchers was cr.docx
1. Company Description and Backgrounda. Weight Watchers was cr.docx1. Company Description and Backgrounda. Weight Watchers was cr.docx
1. Company Description and Backgrounda. Weight Watchers was cr.docxmonicafrancis71118
 
1. Come up with TWO movie ideas -- as in for TWO screenplays that .docx
1. Come up with TWO movie ideas -- as in for TWO screenplays that .docx1. Come up with TWO movie ideas -- as in for TWO screenplays that .docx
1. Come up with TWO movie ideas -- as in for TWO screenplays that .docxmonicafrancis71118
 
1. Choose a case for the paper that interests you. Most choose a .docx
1. Choose a case for the paper that interests you.  Most choose a .docx1. Choose a case for the paper that interests you.  Most choose a .docx
1. Choose a case for the paper that interests you. Most choose a .docxmonicafrancis71118
 

More from monicafrancis71118 (20)

1. Discuss Blockchains potential application in compensation system.docx
1. Discuss Blockchains potential application in compensation system.docx1. Discuss Blockchains potential application in compensation system.docx
1. Discuss Blockchains potential application in compensation system.docx
 
1. Describe the characteristics of the aging process. Explain how so.docx
1. Describe the characteristics of the aging process. Explain how so.docx1. Describe the characteristics of the aging process. Explain how so.docx
1. Describe the characteristics of the aging process. Explain how so.docx
 
1. Dis. 7Should we continue to collect data on race and .docx
1. Dis. 7Should we continue to collect data on race and .docx1. Dis. 7Should we continue to collect data on race and .docx
1. Dis. 7Should we continue to collect data on race and .docx
 
1. Differentiate crisis intervention from other counseling therapeut.docx
1. Differentiate crisis intervention from other counseling therapeut.docx1. Differentiate crisis intervention from other counseling therapeut.docx
1. Differentiate crisis intervention from other counseling therapeut.docx
 
1. Despite our rational nature, our ability to reason well is ofte.docx
1. Despite our rational nature, our ability to reason well is ofte.docx1. Despite our rational nature, our ability to reason well is ofte.docx
1. Despite our rational nature, our ability to reason well is ofte.docx
 
1. Describe the ethical challenges faced by organizations operating .docx
1. Describe the ethical challenges faced by organizations operating .docx1. Describe the ethical challenges faced by organizations operating .docx
1. Describe the ethical challenges faced by organizations operating .docx
 
1. Describe in your own words the anatomy of a muscle.  This sho.docx
1. Describe in your own words the anatomy of a muscle.  This sho.docx1. Describe in your own words the anatomy of a muscle.  This sho.docx
1. Describe in your own words the anatomy of a muscle.  This sho.docx
 
1. Describe how your attitude of including aspects of health literac.docx
1. Describe how your attitude of including aspects of health literac.docx1. Describe how your attitude of including aspects of health literac.docx
1. Describe how your attitude of including aspects of health literac.docx
 
1. Choose a behavior (such as overeating, shopping, Internet use.docx
1. Choose a behavior (such as overeating, shopping, Internet use.docx1. Choose a behavior (such as overeating, shopping, Internet use.docx
1. Choose a behavior (such as overeating, shopping, Internet use.docx
 
1. Case 3-4 Franklin Industries’ Whistleblowing (a GVV Case)Natali.docx
1. Case 3-4 Franklin Industries’ Whistleblowing (a GVV Case)Natali.docx1. Case 3-4 Franklin Industries’ Whistleblowing (a GVV Case)Natali.docx
1. Case 3-4 Franklin Industries’ Whistleblowing (a GVV Case)Natali.docx
 
1. Cryptography is used to protect confidential data in many areas. .docx
1. Cryptography is used to protect confidential data in many areas. .docx1. Cryptography is used to protect confidential data in many areas. .docx
1. Cryptography is used to protect confidential data in many areas. .docx
 
1. Compare and contrast steganography and cryptography.2. Why st.docx
1. Compare and contrast steganography and cryptography.2. Why st.docx1. Compare and contrast steganography and cryptography.2. Why st.docx
1. Compare and contrast steganography and cryptography.2. Why st.docx
 
1. Date September 13, 2017 – September 15, 2017 2. Curr.docx
1. Date September 13, 2017 – September 15, 2017 2. Curr.docx1. Date September 13, 2017 – September 15, 2017 2. Curr.docx
1. Date September 13, 2017 – September 15, 2017 2. Curr.docx
 
1. compare and contrast predictive analytics with prescriptive and d.docx
1. compare and contrast predictive analytics with prescriptive and d.docx1. compare and contrast predictive analytics with prescriptive and d.docx
1. compare and contrast predictive analytics with prescriptive and d.docx
 
1. Creating and maintaining relationships between home and schoo.docx
1. Creating and maintaining relationships between home and schoo.docx1. Creating and maintaining relationships between home and schoo.docx
1. Creating and maintaining relationships between home and schoo.docx
 
1. Compare and contrast Strategic and Tactical Analysis and its .docx
1. Compare and contrast Strategic and Tactical Analysis and its .docx1. Compare and contrast Strategic and Tactical Analysis and its .docx
1. Compare and contrast Strategic and Tactical Analysis and its .docx
 
1. Coalition ProposalVaccination Policy for Infectious Disease P.docx
1. Coalition ProposalVaccination Policy for Infectious Disease P.docx1. Coalition ProposalVaccination Policy for Infectious Disease P.docx
1. Coalition ProposalVaccination Policy for Infectious Disease P.docx
 
1. Company Description and Backgrounda. Weight Watchers was cr.docx
1. Company Description and Backgrounda. Weight Watchers was cr.docx1. Company Description and Backgrounda. Weight Watchers was cr.docx
1. Company Description and Backgrounda. Weight Watchers was cr.docx
 
1. Come up with TWO movie ideas -- as in for TWO screenplays that .docx
1. Come up with TWO movie ideas -- as in for TWO screenplays that .docx1. Come up with TWO movie ideas -- as in for TWO screenplays that .docx
1. Come up with TWO movie ideas -- as in for TWO screenplays that .docx
 
1. Choose a case for the paper that interests you. Most choose a .docx
1. Choose a case for the paper that interests you.  Most choose a .docx1. Choose a case for the paper that interests you.  Most choose a .docx
1. Choose a case for the paper that interests you. Most choose a .docx
 

Recently uploaded

Call Girls in Dwarka Mor Delhi Contact Us 9654467111
Call Girls in Dwarka Mor Delhi Contact Us 9654467111Call Girls in Dwarka Mor Delhi Contact Us 9654467111
Call Girls in Dwarka Mor Delhi Contact Us 9654467111Sapana Sha
 
Q4-W6-Restating Informational Text Grade 3
Q4-W6-Restating Informational Text Grade 3Q4-W6-Restating Informational Text Grade 3
Q4-W6-Restating Informational Text Grade 3JemimahLaneBuaron
 
BASLIQ CURRENT LOOKBOOK LOOKBOOK(1) (1).pdf
BASLIQ CURRENT LOOKBOOK  LOOKBOOK(1) (1).pdfBASLIQ CURRENT LOOKBOOK  LOOKBOOK(1) (1).pdf
BASLIQ CURRENT LOOKBOOK LOOKBOOK(1) (1).pdfSoniaTolstoy
 
Kisan Call Centre - To harness potential of ICT in Agriculture by answer farm...
Kisan Call Centre - To harness potential of ICT in Agriculture by answer farm...Kisan Call Centre - To harness potential of ICT in Agriculture by answer farm...
Kisan Call Centre - To harness potential of ICT in Agriculture by answer farm...Krashi Coaching
 
APM Welcome, APM North West Network Conference, Synergies Across Sectors
APM Welcome, APM North West Network Conference, Synergies Across SectorsAPM Welcome, APM North West Network Conference, Synergies Across Sectors
APM Welcome, APM North West Network Conference, Synergies Across SectorsAssociation for Project Management
 
Grant Readiness 101 TechSoup and Remy Consulting
Grant Readiness 101 TechSoup and Remy ConsultingGrant Readiness 101 TechSoup and Remy Consulting
Grant Readiness 101 TechSoup and Remy ConsultingTechSoup
 
Concept of Vouching. B.Com(Hons) /B.Compdf
Concept of Vouching. B.Com(Hons) /B.CompdfConcept of Vouching. B.Com(Hons) /B.Compdf
Concept of Vouching. B.Com(Hons) /B.CompdfUmakantAnnand
 
Software Engineering Methodologies (overview)
Software Engineering Methodologies (overview)Software Engineering Methodologies (overview)
Software Engineering Methodologies (overview)eniolaolutunde
 
Introduction to AI in Higher Education_draft.pptx
Introduction to AI in Higher Education_draft.pptxIntroduction to AI in Higher Education_draft.pptx
Introduction to AI in Higher Education_draft.pptxpboyjonauth
 
Separation of Lanthanides/ Lanthanides and Actinides
Separation of Lanthanides/ Lanthanides and ActinidesSeparation of Lanthanides/ Lanthanides and Actinides
Separation of Lanthanides/ Lanthanides and ActinidesFatimaKhan178732
 
Incoming and Outgoing Shipments in 1 STEP Using Odoo 17
Incoming and Outgoing Shipments in 1 STEP Using Odoo 17Incoming and Outgoing Shipments in 1 STEP Using Odoo 17
Incoming and Outgoing Shipments in 1 STEP Using Odoo 17Celine George
 
Accessible design: Minimum effort, maximum impact
Accessible design: Minimum effort, maximum impactAccessible design: Minimum effort, maximum impact
Accessible design: Minimum effort, maximum impactdawncurless
 
Industrial Policy - 1948, 1956, 1973, 1977, 1980, 1991
Industrial Policy - 1948, 1956, 1973, 1977, 1980, 1991Industrial Policy - 1948, 1956, 1973, 1977, 1980, 1991
Industrial Policy - 1948, 1956, 1973, 1977, 1980, 1991RKavithamani
 
A Critique of the Proposed National Education Policy Reform
A Critique of the Proposed National Education Policy ReformA Critique of the Proposed National Education Policy Reform
A Critique of the Proposed National Education Policy ReformChameera Dedduwage
 
URLs and Routing in the Odoo 17 Website App
URLs and Routing in the Odoo 17 Website AppURLs and Routing in the Odoo 17 Website App
URLs and Routing in the Odoo 17 Website AppCeline George
 
Introduction to ArtificiaI Intelligence in Higher Education
Introduction to ArtificiaI Intelligence in Higher EducationIntroduction to ArtificiaI Intelligence in Higher Education
Introduction to ArtificiaI Intelligence in Higher Educationpboyjonauth
 

Recently uploaded (20)

Call Girls in Dwarka Mor Delhi Contact Us 9654467111
Call Girls in Dwarka Mor Delhi Contact Us 9654467111Call Girls in Dwarka Mor Delhi Contact Us 9654467111
Call Girls in Dwarka Mor Delhi Contact Us 9654467111
 
Código Creativo y Arte de Software | Unidad 1
Código Creativo y Arte de Software | Unidad 1Código Creativo y Arte de Software | Unidad 1
Código Creativo y Arte de Software | Unidad 1
 
Q4-W6-Restating Informational Text Grade 3
Q4-W6-Restating Informational Text Grade 3Q4-W6-Restating Informational Text Grade 3
Q4-W6-Restating Informational Text Grade 3
 
Staff of Color (SOC) Retention Efforts DDSD
Staff of Color (SOC) Retention Efforts DDSDStaff of Color (SOC) Retention Efforts DDSD
Staff of Color (SOC) Retention Efforts DDSD
 
BASLIQ CURRENT LOOKBOOK LOOKBOOK(1) (1).pdf
BASLIQ CURRENT LOOKBOOK  LOOKBOOK(1) (1).pdfBASLIQ CURRENT LOOKBOOK  LOOKBOOK(1) (1).pdf
BASLIQ CURRENT LOOKBOOK LOOKBOOK(1) (1).pdf
 
Kisan Call Centre - To harness potential of ICT in Agriculture by answer farm...
Kisan Call Centre - To harness potential of ICT in Agriculture by answer farm...Kisan Call Centre - To harness potential of ICT in Agriculture by answer farm...
Kisan Call Centre - To harness potential of ICT in Agriculture by answer farm...
 
APM Welcome, APM North West Network Conference, Synergies Across Sectors
APM Welcome, APM North West Network Conference, Synergies Across SectorsAPM Welcome, APM North West Network Conference, Synergies Across Sectors
APM Welcome, APM North West Network Conference, Synergies Across Sectors
 
Grant Readiness 101 TechSoup and Remy Consulting
Grant Readiness 101 TechSoup and Remy ConsultingGrant Readiness 101 TechSoup and Remy Consulting
Grant Readiness 101 TechSoup and Remy Consulting
 
Concept of Vouching. B.Com(Hons) /B.Compdf
Concept of Vouching. B.Com(Hons) /B.CompdfConcept of Vouching. B.Com(Hons) /B.Compdf
Concept of Vouching. B.Com(Hons) /B.Compdf
 
Software Engineering Methodologies (overview)
Software Engineering Methodologies (overview)Software Engineering Methodologies (overview)
Software Engineering Methodologies (overview)
 
TataKelola dan KamSiber Kecerdasan Buatan v022.pdf
TataKelola dan KamSiber Kecerdasan Buatan v022.pdfTataKelola dan KamSiber Kecerdasan Buatan v022.pdf
TataKelola dan KamSiber Kecerdasan Buatan v022.pdf
 
Model Call Girl in Tilak Nagar Delhi reach out to us at 🔝9953056974🔝
Model Call Girl in Tilak Nagar Delhi reach out to us at 🔝9953056974🔝Model Call Girl in Tilak Nagar Delhi reach out to us at 🔝9953056974🔝
Model Call Girl in Tilak Nagar Delhi reach out to us at 🔝9953056974🔝
 
Introduction to AI in Higher Education_draft.pptx
Introduction to AI in Higher Education_draft.pptxIntroduction to AI in Higher Education_draft.pptx
Introduction to AI in Higher Education_draft.pptx
 
Separation of Lanthanides/ Lanthanides and Actinides
Separation of Lanthanides/ Lanthanides and ActinidesSeparation of Lanthanides/ Lanthanides and Actinides
Separation of Lanthanides/ Lanthanides and Actinides
 
Incoming and Outgoing Shipments in 1 STEP Using Odoo 17
Incoming and Outgoing Shipments in 1 STEP Using Odoo 17Incoming and Outgoing Shipments in 1 STEP Using Odoo 17
Incoming and Outgoing Shipments in 1 STEP Using Odoo 17
 
Accessible design: Minimum effort, maximum impact
Accessible design: Minimum effort, maximum impactAccessible design: Minimum effort, maximum impact
Accessible design: Minimum effort, maximum impact
 
Industrial Policy - 1948, 1956, 1973, 1977, 1980, 1991
Industrial Policy - 1948, 1956, 1973, 1977, 1980, 1991Industrial Policy - 1948, 1956, 1973, 1977, 1980, 1991
Industrial Policy - 1948, 1956, 1973, 1977, 1980, 1991
 
A Critique of the Proposed National Education Policy Reform
A Critique of the Proposed National Education Policy ReformA Critique of the Proposed National Education Policy Reform
A Critique of the Proposed National Education Policy Reform
 
URLs and Routing in the Odoo 17 Website App
URLs and Routing in the Odoo 17 Website AppURLs and Routing in the Odoo 17 Website App
URLs and Routing in the Odoo 17 Website App
 
Introduction to ArtificiaI Intelligence in Higher Education
Introduction to ArtificiaI Intelligence in Higher EducationIntroduction to ArtificiaI Intelligence in Higher Education
Introduction to ArtificiaI Intelligence in Higher Education
 

Citation (APA) Greenlee, B. J. (2007). When school advisory co.docx

  • 1. Citation (APA) Greenlee, B. J. (2007). When school advisory councils decide: Spending choices for school improvement. Planning and Changing, 38(3), 222-244. Background Context Literature This paper addresses the role of governance structures. Parent and community involvement in decision-making is considered an essential component of successful school improvement. Stakeholders such as the parents collaborate with school professionals to provide greater access for influencing decision making of their child’s school. Purposes This study examines the effects of a distributed school budget authority and reduced budgeting constraints: when school governance councils have the opportunity to make choices concerning the allocation of school accountability dollars, what do they choose? Furthermore, in considering spending alternatives in order to enhance school performance what choices do they make? Research Design Methods Participation Subjects Population Sample Setting The empirical study was in a large Florida school district. The school district’s demographics were comparable to state’s averages. The sample included school advisory council (SAC)
  • 2. projected budgets for 186 schools. Data Collection Data on SAC budgets obtained from the school improvement plans for 2004/2005 posted on the school district’s website. The plans provided data on school demography, council composition including race and constituency, school improvement goals and action plans, and the proposed budget for accountability dollars. Data analysis Data was examined and allocations were classified by the item or service. Using a data reduction, process items were sorted into categories. A line item analysis was done for the budgets to identify and classify all allocations, then entered into a database and coded into categories of spending. Three investigators independently analyzed and compiled item classifications and compared findings. This method provided multiple perspectives as opposed to a single perspective on the data. Peer review facilitation increased the trustworthiness of the interpretation. Findings The study provides two major points: 1) SAC’s consider the spending priorities for their accountability funds. Schools allocate their budgets differently based upon the context and conditions they face. Choices are framed by each SAC’s understanding of the needs of the school within the framework of the resources available. Budget choices are not random, but value-laden because one idea will receive more while another idea will receive less. 2) There is not a systematic understanding of what works in school improvement spending. Budget decisions are arbitrary and are spent in traditional ways such as curriculum materials or supplies, and equipment. With providing more flexibility and control over resources for schools, school improvement initiatives resulted in little innovation or risk taking.
  • 3. Conclusions SAC’s contend with the influence of parents/community leaders and the employment of interested school employees. School employees such as teachers and principals can sway their interests more and detract from the partnership given from parents for their part in decision-making. Other concerns are the motives guiding to improve educational opportunity for all students. Policy efforts as well as culture of the schools accountability for results are the issues. Can spending produce meaningful results? Commentary Although California does not have student improvement plan, schools are required to involve parent/ community involvement in the school budget. The ongoing question of what is important or valuable. The extensive large study provided a greater understanding of what SAC’s value when taking into account student achievement and the financial budget. How monies are disbursed given the importance of improving student achievement in low socio economic performing schools, which is a consideration in my blog. Nora Bader Nora Bader Nora Bader
  • 4. � .JOURNAL OF URBAN ECONOMICS 43, 418]443 1998 ARTICLE NO. UE972053 School Finance Reform and Private School Enrollment: Evidence from California* Thomas A. Downes† and David Schoeman Department of Economics, Tufts Uni®ersity, Braker Hall, Medford, Massachusetts 02155 Received April 3, 1996; revised May 23, 1997 Abstract: This paper uses the school finance reforms in California in the 1970s to examine whether the constraints such reforms impose on school districts lead to switching to private schools. Misspecifications of demand in previous work have led to understatement of reform effects. An empirical model of schooling share equations is derived from a discrete choice framework. Large biases are shown to result from failure to account for heterogeneity of demanders and school-district- specific fixed effects. Simulations indicate that the changes in public provision potentially resulting from reform explain a sizeable portion of the growth in the private school share. Q 1998 Academic Press 1. INTRODUCTION w xJonathan Kozol’s Sa®age Inequalities 16 eloquently documents the large
  • 5. and persistent disparities in educational opportunities within the United States. Policymakers have responded to these disparities with various reforms of state school financing systems, with varied success at reducing cross-district disparities in per pupil spending. Reforms that have in- creased the state share of spending and have limited local discretion w xhave resulted in the largest reductions of disparities 10 . However, the ef- fects of these policies on student achievement and on other aspects of � w xthe education system have gone largely unexplored exceptions are 15 w x.and 8 . Contemporary observers of reform policies noted that reforms limiting local discretion over spending might have unintended and potentially detrimental consequences. For example, Walter Mondale observed that *Thanks to Dan Sullivan, Joe Altonji, Bo Honore, Rebecca Blank, Andrew Newman, Steve´ Rivkin, Carol Rapaport, Dale Ballou, Jan Brueckner, two anonymous referees, and seminar participants at Northwestern University, the University of Chicago, and the University of Wisconsin]Madison for helpful comments and suggestions. Also thanks to Craig Kogan for his diligent research assistance. All remaining errors of
  • 6. omission or commission are our own. †E-mail: [email protected] 418 0094-1190r98 $25.00 Copyright Q 1998 by Academic Press All rights of reproduction in any form reserved. FINANCE REFORM AND PRIVATE SCHOOL ENROLLMENT 419 parents in districts facing spending constraints might argue ... we are in this trap where we can raise a lot of money to be sent elsewhere or we can put downward pressure on revenue for our local schools and simply spread all of our money on private schools for our � .children Mondale Committee Hearings, p. 6883 The end result could be reduced popular support for the state’s public schools, with the potential outcome being that the policies hurt those students in low wealth districts whom the policies were intended to help. The objective of this paper is to provide evidence on the plausibility of the argument raised by Mondale. In particular, we look at the changes in the share of enrollment in private schools after reform, using data
  • 7. from California in 1970 and 1980, years that sandwich extensive school finance reforms in the 1970s. Two court rulings, Serrano I 1 and Serrano II,2 issued in the mid-1970s, dramatically altered the nature of public school financing in California. These decisions ruled unconstitutional any financing system that allowed disparities in taxable wealth across districts to translate into disparate levels of per pupil spending. Prior to the Serrano decisions, there was wide variation in per pupil expenditures, interpreted by the California Supreme Court as being partly attributable to sizeable differences in the revenue- raising capacity of districts. The state responded to the Serrano decisions by placing ceilings on the amount districts could spend on each student and by forcing the range in these ceilings on per pupil expenditures, known as revenue limits, to shrink over time. The passage of Proposition 13, the property tax limitation initiative, moved the responsibility for financing public schools from the local to the state level and enabled the state to implement the revenue limit system. The combination of the Serrano rulings and Proposition 13 did, with certainty, reduce the differences in
  • 8. w xspending across districts 18, 6 . The rapidity and magnitude of the changes in the cross-district distribution of per pupil spending provide a natural experiment for examining the effects of finance reforms. w xFischel 11 has contended that the passage of Proposition 13 was evidence that the Serrano decision reduced popular support for public school expenditures. Following Walter Mondale’s reasoning, this reduction in support also would be reflected in sizeable growth in the share of enrollment in private schools. In fact, in the late 1970s, there was a rapid 1Serrano ® Priest, 96 Cal. Rptr. 601. 2Serrano ® Priest, 135 Cal. Rptr. 348. DOWNES AND SCHOEMAN420 w xincrease in the private school share. Yet, Sonstelie 22 and Chamberlain w x3 claimed only a small fraction of the changes in California’s private school enrollment could be attributed to the finance reforms. In this paper, the conclusions of this previous work are questioned. The estimates presented here make a strong case that the reform’s impact on the enrollment share of private schools was large. The failure of earlier
  • 9. work to consider several important determinants of demand for education led to understatement of the estimated effects of reform. The analysis below explores the impact of the potential biases and presents improved estimates of the response to finance reforms. The remainder of this paper is divided into six sections. The next section places California’s trends in private school enrollment in a national con- text. The third section outlines the empirical model used to examine the relationship between finance reforms and changes in aggregate demand for public schooling. That section also includes discussion of how varia- tions in individual tastes can be incorporated into the specification of aggregate demand. The fourth section describes the data used in the analysis. One important aspect of the data is inclusion of information on projected future public school spending levels, of particular value since the effects of reforms were not fully observable in the distribution of per pupil expenditures in 1980. The fifth section provides estimates of the empirical model. These estimates confirm the importance of accounting for unobserved determi- nants of demand common to residents of a locality and for heterogeneity
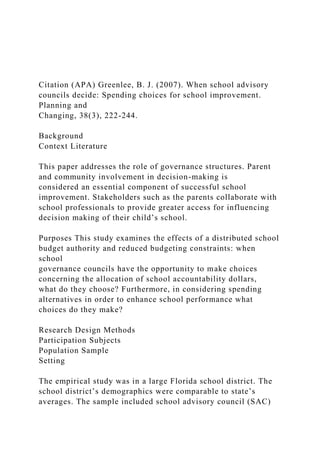
  • 10. of individual demand. The results also support the argument that individu- als’ schooling decisions depend on expectations of future quality of educa- tion. These findings are confirmed by simulation results in Section 6. The final section summarizes the results and discusses their implications for policy and future research. 2. NATIONAL TRENDS IN PRIVATE SCHOOL ENROLLMENT Figure 1 includes plots of the percent of total students enrolled in California private schools and the percent in the nation for the period from 1972]73 to 1979]80. Nationally, approximately 10.0% of all students attended private school for the entire eight-year period, with a mild upswing in private school enrollment over the last few years of the decade. In California, after an initial downswing, in 1974 a period of rapid and sustained growth in the private school share began.3 The number of 3The growth in the fraction private in the 1970s was at variance with previous history in California. In 1890, 8.81% of the enrollees in California attended private schools. The fraction of students in private schools remained at about this level throughout the 20th century.
  • 11. FINANCE REFORM AND PRIVATE SCHOOL ENROLLMENT 421 FIG. 1. Trends in private share: reform states. students served by private schools increased by 22.35% to 497,613 stu- dents, while the number served by public schools fell by 6.6% to 4,119,511 students. This unprecedented change in the role of the private schooling sector coincided with the initial state response to Serrano I. Figure 1 also gives trends in the private school share in several other states that implemented school finance reforms.4 The fraction attending private schools grew in most of these states, with Minnesota the lone exception. Still, even if reforms explain part of the increase in the fraction private, there were potentially diverse and unique factors leading to growth in each state. For example, in South Carolina much of the exodus of students from the public schools was attributable to implementation of desegregation programs. Nonetheless, the differences between reform states and the nation as a whole in the growth of the enrollment share of private schools indicate that the California experience may not have been unique. Further exploration of the relationship between the
  • 12. growth in the private school share and the implementation of finance reforms is warranted.5 4Enrollment shares were obtained from statistical abstracts issued by the states. Reform states are those states which implemented school finance reforms intended to reduce w xinequalities across school districts in per pupil spending. See 1 for a list of reform states. Of the states in this figure, only California and Washington reformed their school financing systems in response to court mandates. 5 w xThe need for such further exploration is also suggested by Schmidt 20 , who, in examining cross-MSA variation in private school enrollment, finds evidence of a positive link between the existence of state-imposed limits on revenue increases and private school shares. DOWNES AND SCHOEMAN422 The large interstate variation in the structure of education financing and in the nature of finance reforms implies that cross-state comparisons of aggregate trends are likely to fail to reveal many of the critical dynamics of public]private choice. We instead focus on the changes within
  • 13. California. The disparate effects on different districts of the finance reforms make California a natural case for evaluating the relationship between private school enrollment and finance reform. 3. AN EMPIRICAL FRAMEWORK The starting point for the empirical model is the now standard random utility model. To apply this model in this context, several assumptions need to be made about the nature of individual choice. First, individuals are assumed to be immobile in the short run.6 In other words, the local public school is the only public alternative in the choice set. The second assump- � .tion limits alternative schooling choices private schools to those within the county in which the individual resides.7 Since the empirical analysis focuses on the schooling choices of families with children of elementary school age, such an assumption is reasonable because transportation and time costs make it prohibitively expensive for most students to attend school outside of their own county. In the model, we also assume individu- als act as if their choices will have no effect on the ability of the schools to provide education; individuals are taken to believe there is an elastic
  • 14. supply of schooling of a particular price and quantity.8 However, in the empirical work below, we allow for the possibility that private school characteristics are endogenous. An individual will choose to leave public school and enter private school if the utility gained from going to private school is greater than the utility 6Given the distributional assumptions made below, we only need maintain the assumption that the cost of moving to a district providing higher quality exceeds the costs of attending a private school of equal or greater quality. 7In several rural counties, the choice set was broadened to include the county of residence and one or more neighboring counties. 8In effect, we maintain the assumption that, at any point in time, the number and location of private school options and the quality of public school options are exogenous. Elements of this assumption are defensible, particularly since the statutory changes in California severed any clear dependence of public provision on the share of students in private schools. Nevertheless, a more realistic model would make schooling choice part of a broader public choice problem in which public schools, private schools, and individual consumers choose w xtheir strategies simultaneously. Such an approach is taken by Sonstelie 23 , where the median
  • 15. voter framework is adapted to allow for existence of a private schooling alternative. While this approach is attractive, it requires maintaining assumptions that have been questioned in w xthe literature. See 7 for discussion of the weaknesses and strengths of the median voter approach. FINANCE REFORM AND PRIVATE SCHOOL ENROLLMENT 423 gained from attending public school. In period t, the current value to individual i from a given schooling alternative j is assumed to take the form U s Q Z , X , F; b q e 1� .� .i jt jt i t t i jt for i s 1, . . . , n, j s 0, . . . , M, where j s 0 is the public alternative and � .j s 1, . . . , M the various non-public alternatives, Q Z , X , F; b reflectsjt i t t the quality individual i thinks he or she will receive from choice j, Z is ajt � .vector of individual expectations on current and possibly future attributes of alternative j, X is a vector of individual i’s characteristics, e is ani t i jt error term with mean zero, and F is a temporally stable effect that varies across districts but is the same for individuals within a district.
  • 16. For ease of presentation, in the remainder of this section, we omit the time subscript. Nevertheless, in the empirical work that follows, we allow for cross-time � .variation of the type reflected in 1 . An individual will choose to attend public school if U ) U , j s 1, . . . , M.i0 i j In other words, public school is chosen if e y e ) Q Z , X , F; b y Q Z , X , F; b , 2� . � .� .i0 i j j i 0 i for j s 1, . . . , M. If we assume the e are Type-I extreme value, thei j � .probability an individual chooses public schooling, designated by P X , b ,0 i is exp Q Z , X , F; b� .� .0 i P X , b s� .0 i ⌥ exp Q Z , X , F; b� .� .J j i 1 s . 3� . 1 q ⌥ exp Q Z , X , F; b y Q Z , X , F; b� .� .J j i 0 i � .Equation 3 is the standard conditional logit model. If information on choices of individuals is available, the parameters of � .1 can be estimated directly. For the period in question, no such individ- ual data are available. Instead, we have observations on the fraction of
  • 17. individuals in each district choosing public school. There is no well-accepted method for moving from individual demand, as summarized by the choice � .probabilities 3 , to a specification of aggregate demand. � w xTo develop a specification of aggregate demand, previous work e.g., 3 ; w x.22 typically has assumed demand in each community corresponds to the demand of a representative individual. This assumption is correct if the DOWNES AND SCHOEMAN424 w xconditions underlying the results of Tiebout 25 hold. However, if tastes are not homogeneous, ignoring information on higher order moments of the taste distribution will lead to biased results. Schooling choice is a classic case in which accounting for heterogeneity in demand is critical. If communities are homogeneous, public provision will equal each individual’s preferred quantity of education. Private school- ing is sustainable only if communities are heterogeneous. A model of schooling choice that fails to account for heterogeneity is inherently contradictory. To see how controls for taste variation can be built into a model
  • 18. of � .aggregate demand, let f x be the density corresponding to the distribu- tion of individual characteristics within a district, let n be the school age � .population, and let P X; b be the probability of choosing public school-0 � .ing for an individual with characteristics X given in 3 . Then the fraction of individuals choosing public schooling is given by p :0 p s 1rn d� . ⌥0 i 1 s P x; b f x dx, 4� . � . � .H 0 where d is a dummy variable that takes the value of 1 if individual ii chooses public schooling and where the second equality follows from a law � . � .of large numbers. Expanding P X; b about the mean of X ' m yields0 <p s P m; b q x y m 9 ≠ P x; b r≠ x� . � . � .� .H � xsm.0 0 0 < q1r2 x y m 9 ≠ P x; b r≠ x ≠ x 9 x y m q R x f x dx� . � . � . � . � .� .� .� xsm.0 5� . � .where R X is the remainder term. After integration, the second term
  • 19. � . � � .drops out. Let M be the k, l element of the matrix ≠ P x; b rk l 0 . < � . �� .� . . ≠ x ≠ x 9 and s be the k, l element of E X y m X y m 9 . Then� xsm. k l p s P m; b q 1r2 M s q E R X .9 6� . � . � .� .⌥ ⌥0 0 k l k l X k l 9 w xAs an alternative, Boyd and Mellman 2 assume tastes are parameterized by b and allow � . b to vary in the population. Then, if individual characteristics enter Q Z , X , F; b linearly,j i � . � . � . �equation 4 becomes p s H P b f b db. Boyd and Mellman assume b s exp m q0 0 m m .R s , where R is a vector of independent standard normal random variables. Theym m m estimate the parameters using Monte Carlo integration. FINANCE REFORM AND PRIVATE SCHOOL ENROLLMENT 425 � � .. � .If we assume E R X is negligible, Eq. 6 gives a specification ofX aggregate demand estimable with available data. The equation implies that the fraction choosing public schooling depends on variations in community
  • 20. characteristics, not just means. Note that if s s 0 for all k and l, thenk l � .Eq. 6 reduces to the representative consumer specification used in w xprevious work 3, 22 . If s / 0 and there is a correlation between thesek l higher order moments and mean characteristics, omitting these moments will result in biased estimates.10 � .Several aspects of the specification of aggregate demand in 6 are worthy of comment. In moving from the specification of individual demand � . � .in 3 to the specification in 6 , no new parameters are introduced. The � .parameters b enter both in P m, b and in the derivative terms M .0 k l � .Since 6 is therefore nonlinear in these parameters, they can be estimated via nonlinear least squares. In addition, most of the data required to � .estimate 6 are provided in the Decennial Census. Available for each � .district are the fraction of students attending public school p , the means0 � . m of the characteristics of those choosing a schooling option, and the cross-tabulation information needed to calculate variances and
  • 21. covariances � . � . � . s of those characteristics. Finally, since 3 is the basis for 6 , itk l � .continues to be the case that, if Q Z , X , F, b is linear in the characteris-j i tics of the choices Z , then aggregate demand depends only on thej differences between the characteristics of the public schools and the � .characteristics of the private alternatives. In other words, as in 3 , the coefficents are applied to the difference between the characteristics of each private school and the district’s public schools, summed across all private schools in the relevant county. � .Since the specification of aggregate demand in 6 is based on the � .random utility model 1 , any potential determinant of schooling demand that does not vary across alternatives can only have an effect on demand if � . w xin 1 this determinant ‘‘interact s with a variable that varies across w xalternatives’’ 26, p. 27 . For this reason, we present estimates derived from specifications in which all individual characteristics enter only through their interaction with the pupil-teacher ratio.11
  • 22. � .Moving from 6 to a workable characterization of aggregate demand requires dealing with a number of concerns raised in the literature. Several � w x w x.authors have argued Goldstein and Pauly 13 ; Reid 19 that, if individu- als sort themselves into homogeneous communities, unobserved determi- 10 w xSee 17 for an alternative discussion of the biases that can arise if heterogeneity in tastes is ignored. 11Since it is well established that Catholics may view public and private schools differently, we also estimated specifications that included the interaction of fraction Catholic with school type. The coefficient on this interaction did not differ significantly from zero. DOWNES AND SCHOEMAN426 nants of demand common to all residents may be correlated with observ- able individual and school characteristics. For example, individuals who are likely to attend private school may choose to reside in communities with low tax rates and high pupil]teacher ratios. Ignoring such school-dis- trict-specific effects can lead to biased estimates. Since we have
  • 23. data on � .private schooling shares in 1970 and 1980, we can estimate variants of 6 that include the temporally stable, district-specific effects F noted above. A critical element of the choice model above is the diversity of the choice set of schooling alternatives. Previous research has either omitted characteristics of the private alternatives or assumed the choice was between the public alternative and a private alternative with attributes equal to the means of these attributes taken over all private schools in the region. But, just as biases can be generated by incorrectly assuming there is a representative individual, biased estimates can result if it is assumed there is a representative private school. In most of the counties in this sample, the private schooling options are heterogeneous and thus poorly � .approximated by a representative school. The specification of P X; b0 � .given in 3 enables us to control directly for the heterogeneity of the private schooling options. There are, however, two potential drawbacks to the conditional logit � .specification in 3 . The first of these is the imposition of
  • 24. independence of irrelevant alternatives implicit in this functional form. In the context of the w xfamous red bus]blue bus example, Train 26 notes that the IIA problem can be solved by including a bus-specific constant. Thus, by including a constant common to all private schools, we can lessen the IIA problem.12 The second potential drawback of the conditional logit specification in � .3 is the fact that, ceteris paribus, the probability of attending public school is lower in regions with more private alternatives. Mechanistically, this drawback results from the fact that, all else equal, the more private � .alternatives there are, the smaller is the denominator of 3 . The inclusion of district-specific effects ameliorates this problem. Two individuals can face schooling options that have the same measurable attributes, can have the same personal characteristics, and can have different probabilities of attending public school if, in one district, the public schools are viewed more positively than in the other district. As a result, the mean probability of attending public school can be high in a district in which there are many private alternatives.
  • 25. 12Other tractable solutions to the IIA problem require dividing the private schools into smaller groups. Then group-specific constants can be estimated for each type of private � .school or the nested logit form of P X, b can be used. Finer groupings of the private0 schools were tried. Since the null of equality of the group- specific constants could not be � .rejected, we chose to present the estimates of the simpler specification given in 3 . FINANCE REFORM AND PRIVATE SCHOOL ENROLLMENT 427 One final specification consideration is that the characteristics of the schooling choices should include expectations about future quality of education. If changing schools is costless, individuals would act as if the only relevant information is the present quality of education. Future expectations would be unimportant, since waiting to transfer is costless. However, if changing schools imposes costs on the student who transfers, future expectations of school quality might alter an individual’s decision to remain in a particular school. If an individual currently enrolled in public school expects the quality of education in that school to fall in the future
  • 26. and future transfers are costly, then that student may decide to transfer to private school in the present period.13 In California in both 1970 and 1980, current attributes of private schools were the best available information on future provision in those schools. Similarly, in 1970 public school districts had full control of spending; current provision was the best available information on future provision. But in 1980, the effects of school finance reform on future schooling provision had not been fully reflected in current provision. Other information, specifically the revenue limit formu- las that determined future spending, was potentially instrumental in the formation of expectations on future school quality. Districts with slower projected growth in revenue limits would have slower growth in per pupil spending. We explore the possibility that expectations of future provision were important by testing to see if the changes in the revenue limits help explain aggregate demand in 1980. We consider below specifications of the aggregate demand for public � .schooling implied by 6 , starting with the representative consumer version typically considered in the literature. We use these results as a starting point to determine if previous conclusions concerning the limited effects of
  • 27. school finance reform hold up when expectations on future school quality, heterogeneity of tastes, and common, unobserved determinants of demand are taken into account. 13 w xDownes and Schoeman 9 contains a more rigorous discussion of the role of expectations on schooling choices when switching is costly. Another argument for including measures of w xfuture limits is suggested by Stiglitz 24 , in which he shows that multiple equilibria in public schooling provision are likely. If multiple equilibria exist, local control over tax rates enables the locality to coordinate the activities of its residents and maintain a high activity equilib- � .rium high tax and public provision . This high activity level is feasible after the policy changes of the late 1970s if each individual makes large voluntary contributions to the public schools, but no mechanism exists to coordinate at this equilibrium. The result can be a low � .activity equilibrium less spending on public education and a larger private sector , even if the w xexistence of peer group effects implies the high activity level is Pareto superior 5 . DOWNES AND SCHOEMAN428
  • 28. 4. DATA The data set used for this analysis consists of observations on 223 � . 14unified K]12 school districts in California in 1970 and 1980. The data were drawn primarily from three sources: National Center of Education � .Statistics NCES surveys of private schools, California Department of Education records on school district finances and student characteristics, and the 1970 and 1980 Censuses of Population and Housing. The NCES collected information on private school characteristics in 1970]71 and 1978]79. For each year, the data include information on enrollment, staffing, location, religious affiliation, and type of school � . 15elementary, high school, special education . The NCES data have three major problems. First, sparsity of school characteristics limits our ability to control for private school quality. Second, incomplete reporting results in omission of key variables for some schools. Finally, the price and quality of private education are potentially endogenous, since, in equilibrium, these variables depend on unobserved determinants of demand. To cope with the latter two problems, we estimated regressions of pupil]teacher ratios on school
  • 29. characteristics � .assumed to be exogenous religious affiliation, program type, and location . From these regressions, we determined predicted pupil]teacher ratios. The estimates presented below use these predicted values for private school characteristics.16 Even with these problems, the data on private school characteristics are more detailed than those used in previous work. Budgetary data from 1970 and 1980, compiled by the California Depart- ment of Education from accounting records of the school districts, are the source for much of the public school data. These reports include informa- tion on per pupil expenditures in and the location of the public schools. District-level data on student characteristics and performance on standard- ized tests are drawn from the California Assessment Program data base. These data were supplemented using printed reports giving revenue limits for the school districts for 1979 and 1985. In response to the Serrano decisions, the state placed ceilings on the amount districts could spend on each student. These revenue limits were first calculated in 1972]73 and were based on the sum of each district’s locally generated revenues and
  • 30. w xnoncategorical state aid 6 . The state forced the range in these ceilings on per pupil expenditures to contract over time. Since the finance reform 14The reasons for limiting our consideration to these districts are given below. In 1980 63.9% of the students in grades K]8 resided in these districts. 15Average tuition data are not available for 1970]71 and are available for a limited set of schools in 1978]79. As a result, we cannot include a tuition measure in the analysis below. 16 w xFor a further discussion of problems with the 1978]79 NCES data, see 7 . khalid alharbi khalid alharbi khalid alharbi FINANCE REFORM AND PRIVATE SCHOOL ENROLLMENT 429 legislation established the formula for calculating these revenue limits, future revenue limits provide clear and observable signals of the
  • 31. future direction of public provision. Demographic information was drawn from the 1970 and 1980 Censuses.17 For each school district, both censuses provide information on the fraction of students attending public and private school, the fraction of the popula- tion in particular income brackets, the racial composition of the student population, the fraction of the adult population with particular levels of educational attainment, and the fraction of families with children. The censuses include no direct information on the religious affiliation of the population of school districts. We proxied for the fraction Catholic in each school district using county-wide data from surveys of church membership conducted in 1970 and 1980 by the National Council of Churches of Christ.18 Finally, data on busing and other desegregation programs are drawn from New E®idence on School Desegregation, prepared for the United w xStates Commission on Civil Rights by Finis Welch and Audrey Light 27 . This report only includes information on the larger school districts and may thus fail to account for all desegregation programs, though few small
  • 32. districts were subject to court-ordered desegregation. Table 1 presents the means and standard deviations of variables used in the analysis. Table 2 presents relationships between some of the variables of interest. Growth in district resources was influenced by reforms; expen- ditures grew more slowly and pupil]teacher ratios more rapidly in districts with slower growth in revenue limits. Given this observation, the positive correlation between the change in the fraction attending private school and the change in the pupil]teacher ratio is consistent with finance reforms contributing significantly to private sector growth. Further, since pupil]teacher ratios grew more rapidly in districts facing the constraints 17The 1970 Census data are not available for smaller districts. In California, most of the districts for which data were not available were elementary school districts. Since we were concerned about the randomness of the elementary districts for which data were available, we chose to limit our analysis to the unified districts, for which there was not a similar sample selection problem. 18We also considered a measure constructed from the number of non-Hispanic individuals residing in the district whose heritage was an historically Catholic country. While this latter measure allowed for within-county variation in the fraction
  • 33. Catholic, the empirical results with the county-wide measure were more reasonable and more consistent with previous research on schooling demand. khalid alharbi khalid alharbi khalid alharbi khalid alharbi khalid alharbi khalid alharbi khalid alharbi DOWNES AND SCHOEMAN430 TABLE 1 aMeans and Standard Deviations of Variables 1970 1980 Standard Standard
  • 34. Variable Mean deviation Mean deviation Fraction in 0.942 0.048 0.908 0.055 public schools Per pupil 2270.15 613.68 2408.02 422.90 bexpenditures Public school pupil] 22.454 2.942 27.229 2.491 teacher ratio Fraction African- 0.038 0.086 0.047 0.102 American Fraction Hispanic 0.189 0.150 0.244 0.188 Fraction Catholic 0.185 0.043 0.188 0.063 Mean family income 25148.34 7929.86 24641.87 7468.33 Fraction of families 0.197 0.086 0.196 0.079 with income under $10K Fraction of families 0.053 0.061 0.071 0.068 with income over $50K Fraction with less 0.426 0.123 0.282 0.124 than high school Fraction high school 0.347 0.057 0.331 0.063 graduates Fraction with some 0.162 0.053 0.214 0.046 college Fraction college 0.066 0.051 0.172 0.108 graduates Change in revenue } } 52.69 114.74
  • 35. limit, 1985]1979 Pred. private school 22.808 9.593 20.858 7.481 pupil]teacher ratio aThe sample consists of 223 public school districts, 1505 private schools in 1970, and 2130 private schools in 1980. bAll dollar values are in 1980 dollars. implicit in the Serrano-inspired reforms,19 these correlations support the contention that a significant portion of the growth in the private school share could be attributed to a response in wealthier districts to the finance reforms. Finally, the strength of the negative correlation between the 19In the quarter of the sample with the slowest growth in revenue limits from 1979 to 1985, the pupil]teacher ratio increased by 6.35 from 1970 to 1980. For the quarter of the sample with the most rapid growth in revenue limits, the pupil]teacher ratio grew by only 3.90 in the period from 1970 to 1980. FINANCE REFORM AND PRIVATE SCHOOL ENROLLMENT 431 TABLE 2 � .Correlation Coefficients for 223 Districts p-Values in Parentheses
  • 36. Change in Change in Change in Change fraction Per pupil pupil] Mean family revenue in per attending assessed teacher income, limit, 1979 pupil Variables private value, 1970 ratio 1980 to 1985 expends Change in 1.000 � .fraction 0.000 attending private Per pupil 0.066 1.000 � . � .assessed 0.329 0.000 value, 1970 Change in 0.184 0.285 1.000 � . � . � .pupil] 0.006 0.0001 0.000 teacher ratio Mean family y0.086 0.141 y0.103 1.000 � . � . � . � .income, 1980 0.203 0.036 0.124 0.000 Change in y0.118 y0.662 y0.383 y0.129 1.000 � . � . � . � . � .revenue 0.079 0.0001 0.0001 0.055 0.000 limit, 1979 to 1985 Change in 0.025 y0.503 y0.208 y0.309 0.400 1.000 � . � . � . � . � . � .per pupil 0.715 0.0001 0.002 0.0001 0.0001 0.000 expenditures
  • 37. change in the fraction attending private school and the change in the revenue limit shows the movement of Californians to private schools was larger in districts facing constraints on the future growth of per pupil expenditures. 5. EMPIRICAL RESULTS In this section we present estimates of the parameters of two variants of � .Eq. 6 , each estimated using nonlinear least squares. The first specifica- � w x.tion closely resembles regressions estimated in previous work e.g., 3 , with school-district-specific effects and information on the distribution of individual characteristics omitted. This specification differs from specifica- tions in earlier work only in that it includes controls for the attributes of private alternatives. These estimates thus provide a base case for gauging the importance of the omission of district-specific effects and measures of demand heterogeneity. Table 3 presents estimates of two parameterizations of this specification � .of 6 ; Table 4 gives the corresponding mean elasticities for these parame- DOWNES AND SCHOEMAN432
  • 38. TABLE 3 Dependent Variable, Fraction Attending Public Schools; Form of Probability, Multinomial a �Logit ; Estimation Method, Minimum Distance Asymptotic Standard Errors .in Parentheses � .Eq. 2 � .Eq. 1 1970 1980 � .Year dummy 1980 s 1 0.869 1.147 � . � .0.166 0.123 � .Pupil]teacher ratio x.1 y7.401 y9.960 y6.888 � . � . � .0.452 7.911 0.088 � .Square of pupil]teacher ratio x.1 1.399 1.607 1.153 � . � . � .0.297 0.102 0.034 Dummyindicating presence of bussing y0.466 y0.571 y0.345 � . � . � .0.019 0.169 0.014 � . � .Change in revenue limit 1985]1979 x.0001 0.262 0.649 � . � .0.614 0.115 � .Interaction of pupil]teacher ratio x.1 with: � .Family income x.0001 0.156 0.299 0.134 � . � . � .0.060 0.035 0.015 Fraction of individuals Roman Catholic 1.065 19.292 1.190 � . � . � .0.731 1.433 0.167 Fraction of individuals with less than high 1.501 y3.253 0.894
  • 39. � . � . � .school education 2.099 7.723 0.268 Fraction of individuals with high school y0.660 6.548 y0.530 � . � . � .education only 0.269 6.040 0.122 Fraction of individuals with some college 0.012 y14.992 1.212 � . � . � .education 4.010 15.568 0.519 Fraction of students African-American y0.294 0.853 y0.180 � . � . � .0.029 0.154 0.031 Fraction of students Hispanic y0.027 y0.824 0.486 � . � . � .0.149 0.290 0.053 Sum of squared residuals 1.686 1.621 Mean predicted fraction private, 1970 0.938 0.938 Mean predicted fraction private, 1980 0.887 0.893 aEach regression includes a constant. As indicated in the text, the choice set for each individual is assumed to include all private schools in the county in which the individual resides. � .terizations. Since each demographic variable enters 3 through its interac- tion with the public and private school pupil]teacher ratios, the elasticity with respect to that variable for any given district is the product of the predicted private school share, the value of the variable, the coefficient on the corresponding interaction, and a weighted average of the difference between the pupil]teacher ratios of the public school and the private
  • 40. FINANCE REFORM AND PRIVATE SCHOOL ENROLLMENT 433 TABLE 4 Elasticity of Fraction attending Public Schools with Respect to Characteristics � .of the Public Schools and the Population Based on Parameter Estimates in Table 3 � . � .Eq. 1 Eq. 2 1970 1980 1970 1980 � .Pupil]teacher ratio x.1 0.0212 0.1661 0.0354 0.0863 Dummyindicating presence of bussing y0.0006 y0.0026 y0.0009 y0.0018 � . � .Change in revenue limit 1985]1979 x.0001 0.0004 0.0009 � .Family income x.0001 0.0049 0.0318 0.0041 0.0296 Fraction of individuals Roman Catholic 0.0025 0.0169 0.0075 0.0205 Fraction of individuals with less than high 0.0066 0.0263 y0.0022 0.0172 school education Fraction of individuals with high school y0.0031 y0.0159 0.0049 y0.0138 education only Fraction of individuals with some college 0.00003 0.0002 y0.0196 0.0224
  • 41. education Fraction of students African-American y0.0002 y0.0020 y0.0002 y0.0013 Fraction of students Hispanic y0.0001 y0.0004 y0.0006 0.0086 schools in the choice set.20 As is apparent from Table 1, this weighted average tended to be positive in 1980 since the public school pupil]teacher ratio was, in most districts, larger than the pupil]teacher ratios for the private schools in the choice set. Thus, for most districts in 1980, the sign on the elasticity of the demographic variables was the same as the sign on the estimated coefficient on the interaction. Such was not always the case in 1970, since private school pupil]teacher ratios were frequently larger than public school pupil]teacher ratios. The estimates in the first column result when we impose the restriction that aggregate demand for private schooling was stable across time. The second and third columns present estimates for the specification that allows aggregate demand to differ between 1970 and 1980. Allowing the specification of aggregate demand to change over time permits us to consider the possibility that attitudes toward public education differed 20For the kth element of X, if Z is the pupil]teacher ratio for
  • 42. option j, the elasticity isj1 ˆ ˆ e s 1 y P X , b b X Z y Z v ,� .� . � .� . ⌥k 0 k k 01 j1 j j where ˆ ˆexp Q Z , X , F; b y Q Z , X , F; b� .� .j 0 v s .j ˆ ˆ⌥ exp Q Z , X , F; b y Q Z , X , F; b� .� .j j 0 khalid alharbi khalid alharbi khalid alharbi khalid alharbi DOWNES AND SCHOEMAN434 post- vs. pre-reform. Serrano and Proposition 13 did more than simply reduce inputs to public education; the constraints on local discretion changed the nature of public education in California. That this change could have altered the nature of aggregate demand seems plausible ex
  • 43. post. The estimates confirm that the underlying structure of demand differed between 1970 and 1980.21 Each of these specifications differs substantively from those used in the previous literature, but the implications of the estimates are not different. Inputs to the schooling process, measured here by the pupil]teacher ratio, are significant determinants of the demand for public schooling, as is apparent from the significant coefficients on the linear term, the quadratic term and many of the interaction terms. But the implied elasticity of demand with respect to the public school pupil]teacher ratio is positive in each year, counter to expectations. These estimates do not support the conclusion that reform-induced changes in the pupil]teacher ratio con- tributed to the move to private schools. The estimated effects of the prospective change in the revenue limit temper the conclusion that there were no effects of reform. Districts facing future constraints in spending capabilities, as indicated by negative real growth in their revenue limits, have lower fractions of students attending public school in 1980. However, the magnitudes of the changes in revenue limits and of the elasticity of demand with respect to these changes are not
  • 44. sufficient to explain a significant portion of the exodus to private schools. w x w xThese results parallel those of Sonstelie 22 and Chamberlain 3 : families making schooling choices do not appear to have been sensitive to the reforms in public school finance. However, the specification of aggre- gate demand on which this conclusion is based fails to account for observed heterogeneity in the population of each district or for unobserved commonalities in the determinants of demand. That these omissions are critical to the conclusion that reforms do not matter is apparent from the results in Tables 5 and 6, which present estimates and the corresponding � .elasticities of variants of 6 that control directly for both district-specific effects and heterogeneity in the population of each district.22 21The Wald test statistic of the null of equality is distributed as a x 2 random variable with 10 degrees of freedom. Since the value of the test statistic is 7891.2, we reject the null of equality. 22In the estimation, we include dummyvariables for each district. Because we have data for each district, such a specification can be estimated. In effect, we are assuming that there are many individuals in each locality whose demand is influenced by some common effect. As
  • 45. long as we assume the asymptotics are driven by increases in the number of people in each community, all of the parameters can be estimated consistently. khalid alharbi khalid alharbi FINANCE REFORM AND PRIVATE SCHOOL ENROLLMENT 435 TABLE 5 Dependent Variable, Fraction Attending Public Schools; Form of Probability, Multinomial a �Logit ; Estimation Method, Minimum Distance Asymptotic Standard Errors .in Parentheses � .Eq. 2 � .Eq. 1 1970 1980 � .Year dummy 1980 s 1 0.296 1.450 � . � .0.048 0.108 � .Pupil]teacher ratio x.1 3.654 3.704 4.817 � . � . � .0.284 0.409 0.418 � .Square of pupil]teacher ratio x.1 y0.390 y0.170 y0.754 � . � . � .0.047 0.042 0.066 Dummyindicating presence of bussing y0.032 y0.292 y0.070
  • 46. � . � . � .0.013 0.021 0.015 � . � .Change in revenue limit 1985]1979 x.0001 0.701 0.573 � . � .0.142 0.133 � .Interaction of pupil]teacher ratio x.1 with: � .Family income x.0001 0.024 0.006 0.062 � . � . � .0.015 0.017 0.009 Fraction of individuals Roman Catholic y5.852 y7.514 y5.784 � . � . � .0.224 0.445 0.289 Fraction of individuals with less than high y2.731 y4.192 y0.415 � . � . � .school education 0.163 0.328 0.323 Fraction of individuals with high school 0.585 0.737 y1.198 � . � . � .education only 0.223 0.260 0.261 Fraction of individuals with some college y1.543 y4.364 2.130 � . � . � .education 0.244 0.467 0.440 Fraction of students African-American 0.502 0.521 y0.177 � . � . � .0.063 0.128 0.078 Fraction of students Hispanic 1.846 3.073 y0.418 � . � . � .0.103 0.133 0.113 Sum of squared residuals 0.145 0.118 Mean predicted fraction private, 1970 0.908 0.907 Mean predicted fraction private, 1980 0.867 0.867 aEach specification includes district-specific effects. As indicated in the text, the choice set for each individual is assumed to include all private schools in the county in which the
  • 47. individual resides. One note of caution concerning the interpretation of the results; the census data provided less than perfect information for calculating covari- ances between demographic variables. Data on mean income for each education level were available only at the state level. The variance of income needed to be rescaled to make the model estimable.23 Also, 23The variance of income was multiplied by 10y8; the covariances of income with education and race were multiplied by 10y4. DOWNES AND SCHOEMAN436 TABLE 6 Elasticity of Fraction attending Public Schools with Respect to Characteristics of the Public � .Schools and the Population Based on Parameter Estimates in Table 5 � . � .Eq. 1 Eq. 2 1970 1980 1970 1980 � .Pupil]teacher ratio x.1 0.0015 y0.0086 y0.0034 y0.1381 Dummyindicating presence of bussing y0.0001 y0.0002 y0.0003 y0.0005
  • 48. � . � .Change in revenue limit 1985]1979 x.0001 0.0024 0.0024 � .Family income x.0001 y0.0002 0.0020 0.00001 0.0069 Fraction of individuals Roman Catholic 0.0019 y0.0038 y0.0008 y0.0558 Fraction of individuals with less than high 0.0009 y0.0207 y0.0009 y0.0052 school education Fraction of individuals with high school y0.0003 0.0058 0.0001 y0.0175 education only Fraction of individuals with some college 0.0007 y0.0107 y0.0004 0.0202 education Fraction of students African-American y0.0002 0.0011 y0.00003 y0.0006 Fraction of students Hispanic y0.0004 0.0125 y0.0003 y0.0053 religious affiliation was assumed to be independent of other demographic characteristics. Even with this imperfect accounting for heterogeneity, the qualitative implications of the estimates are substantively changed from those in Table 3.24 The major change is in the response of demand to changes in w xthe public school pupil]teacher ratio. While, as Sonstelie 22 found, in 1970 the elasticity of demand with respect to the
  • 49. pupil]teacher ratio is small, in 1980 demand for public schooling falls dramatically as the pupil]teacher ratio increases. For example, the mean elasticity of demand � .with respect to a change in the pupil]teacher ratio for Eq. 2 in 1980 implies that a 21.3% increase in the pupil]teacher ratio in the public schools, an increase equal to the difference in the mean pupil]teacher ratios between 1970 and 1980, would result in a 2.94% decrease in the public school share, all else equal. This is approximately 70% of the 4.17% decrease in the mean public school share. The prospective change in the revenue limit continues to be a significant determinant of the fraction public. Further, the elasticity of public school demand with respect to this prospective change increases relative to the elasticity implied by the estimates in Table 3. Failure to control for 24 � .We also estimated variants of 6 that accounted for only district-specific effects or only for population heterogeneity. Based on these estimates, it appears that each of these modifications to the base specification was responsible for roughly half of the change from Tables 3 and 4 to Tables 5 and 6.
  • 50. FINANCE REFORM AND PRIVATE SCHOOL ENROLLMENT 437 population heterogeneity and common, unobserved determinants of de- mand results in understatement of the role of changes in the revenue limit and, in light of the evidence above, in significant understatement of the influence of reform. The demographic variables are interacted with the pupil]teacher ratio, so their effects on demand are only discernable from the elasticities in Table 6. The estimates of the effects of the remaining variables are neither stable across specifications nor across years, an unsurprising result given the scope of the changes in the decade of the 1970s.25 The estimated effect � .of income matches expectations only for Eq. 1 in 1970. The positive elasticity in 1980 for both equations indicates an increase in mean family income increases the fraction of students attending public schools. Equally surprising are the negative elasticities for the education variables. These elasticities imply that, all else equal, communities with larger fractions of individuals with less education have lower public school shares than do communities with larger fractions with post-graduate education.
  • 51. However, the income and the education results may reflect both the increased ability of higher income, better educated families to pay for private school and the greater ease with which such families can supplement in- school inputs. An equally plausible explanation for the negative education elasticities is that these elasticities signal the response to increased heterogeneity in the w xbackground of prospective students 14 . Interpretation of the effects of the racial composition variables is also difficult, since the coefficients on these variables reflect two potentially disparate effects. First, these variables account for heterogeneity in indi- vidual views of public and private schooling. Second, they reflect potential responses to differences across communities in the racial and ethnic composition of the public schools. For example, the negative elasticity of demand with respect to the fraction African-American in 1980 implied by � .Eq. 2 might imply African-Americans were more likely to choose private w xschool. However, in light of the work of Clotfelter 4 , this result might also indicate the presence of African-Americans in public schools led to an
  • 52. increase in private school attendance of other racial groups. Unfortu- nately, no measure of the student composition of public schools in 1970 exists, preventing us from distinguishing between the two effects. In almost every case, the elasticity of public school demand with respect to the fraction Catholic is negative, consistent with the expectation that communities with larger fractions Catholic have larger fractions of stu- 25The Wald statistic for the null of equality across time is 1478.8, significant at the 1% level. khalid alharbi DOWNES AND SCHOEMAN438 dents attending private school. Expectations on the effect of the presence of desegregation programs are also borne out. Districts with desegregation programs have less demand for public schooling. These results confirm the implications of the trends in the public school share in reform states. Reforms and accompanying constraints on local discretion contributed significantly to the reduction in the
  • 53. public school share. In addition, the estimates above mask an important difference between this work and previous work: the inclusion of controls for the heterogeneity of private alternatives. Further, the results abstract away from the impact of reform on the supply side. The rapid growth in the number of private schools, from 1505 in 1970 to 2130 in 1980, indicates a supply side response cannot be ruled out. In the next section we explore how the public school share would have changed in the absence of any changes save for changes on the supply side. 6. SIMULATING THE EFFECTS OF REFORM In this section, we present results of several thought exercises. The first asks how the fraction attending public school would have changed if the choice set had remained unchanged from 1970 to 1980, if demographics and the structure of demand had remained unchanged, and if the direct �effects of the finance reforms as measured by changes in the pupil-teacher .ratio and inclusion of the changes in revenue limits were allowed to take place. In other words, we use as our baseline estimates the coefficient estimates for 1970 in Table 5, Eq. 2. We restrict the private
  • 54. schooling options to those schools among the 1505 existing in 1970 located in the county of residence of the family making the schooling choice, and we assume that the district demographics were as in 1970. The public school pupil]teacher ratio is assigned its 1980 value, and the influence of future expectations is accounted for by including the product of the change in the revenue limit and its coefficient. Under these assumptions, we calculated for each district the implied public school share. Since in this simulation we assume that the finance reforms had no effect on the private school options or on the choice set, all of the effects of limits are assumed to work through changes in the pupil]teacher ratio and the revenue limits. These changes could understate or overstate the full impact of reform on inputs to education, but understatement is likely since no structural or supply-side changes are allowed. Still, given available data, this simulation provides the best measure of the magnitude of the demand-side effects of reform. In this first simulation, overstatement of the effects of reform could result if some of the growth in the pupil]teacher ratio would have occurred in the absence of reform. However, if political support
  • 55. for public schooling had slipped, then this upward trend in the pupil]teacher ratio khalid alharbi khalid alharbi FINANCE REFORM AND PRIVATE SCHOOL ENROLLMENT 439 may have reflected a reduction in the statewide commitment to public education. For this reason, we cannot assume that the reforms only affected input levels in high wealth districts.26 Nonetheless, to provide a range of possible effects of reform, we also consider a variant of the first simulation in which we assume that none of the change in the mean pupil]teacher ratio and all of the reduction in the dispersion in the pupil]teacher ratio were attributable to finance reforms.27 To implement this assumption, in 1970 we assigned each district its 1980 pupil]teacher � .ratio multiplied first by 22.454r27.229 , the ratio of the mean pupil]teacher ratios in 1970 and 1980. We continue to fix both the choice
  • 56. set and the characteristics of each district’s population at the 1970 levels. The final thought exercise explores the changes in public school enroll- ment when the choice set is allowed to expand but when public school characteristics and demographics are fixed at their 1970 levels. In combi- nation with the estimates above, these three simulations provide an indica- tion of the extent to which the changes in the fraction of students in public schools can be attributed to the finance reforms. Table 7 gives the predicted levels of the fraction attending public school under each scenario outlined above along with the actual levels. The first simulation indicates that, ceteris paribus, the changes in the pupil]teacher ratio from 1970 to 1980, together with the imposition of spending limits, would have led to a decrease in the fraction attending public schools from 0.9071 to 0.8894. This change is 44.5% of the actual change in the fraction private. Even if this predicted change is an upper bound on the reform-in- duced change in the public school share, the case is made that the finance reforms could have generated a significant portion of the change in California private school attendance in the late 1970s. The second simulation indicates that, unless the finance reforms changed
  • 57. support for public education at the state level, there is no persuasive evidence that the increases in the private school share can be attributed to the reforms. If only the reduction in dispersion in the pupil]teacher ratio is attributed to the finance reforms, the estimates imply that the reforms 26It was apparent to most state residents that, after the finance reforms, any increase in the state government’s spending on education would be financed by increases in revenues from w xCalifornia’s progressive income tax 12 . Further, since high wealth districts continued to be w xless dependent on the state for funding their public schools 6 , residents of these districts would be less affected by slower growth in the state government’s spending on education. Reform-induced opposition to increases in state spending could have resulted in increases in pupil]teacher ratios even in districts with the lowest property wealth. The evidence seems to confirm this view. Between the 1969]70 and 1979]80 school years, the percentage changes in average daily attendance in California and in the nation were essentially equal. In that same period, the number of teachers increased by 2% in California and 8.4% in the nation. 27Thanks to an anonymous referee for suggesting this simulation.
  • 58. DOWNES AND SCHOEMAN440 TABLE 7 Simulation Results Variable Mean fraction public Actual fraction public in 1970 0.9047 Actual fraction public in 1980 0.8670 � .Predicted fraction public in 1970}Eq. 2 , Table 5 0.9071 � .Predicted fraction public in 1980}Eq. 2 , Table 5 0.8673 Predicted fraction public in 1980}Simulation 1 0.8894 Predicted fraction public in 1980}Simulation 2 0.9113 Predicted fraction public in 1980}Simulation 3 0.9055 Note: For description of the simulations, see Section 6 of the text. would have had no effect on the private school share. In fact, the share of students in the private schools would have decreased slightly from 0.0929 to 0.0887. Thus, it would seem that the actual impact of the reforms could range from no appreciable effect on the private school share to the 19.1% decrease in this share implied by the first simulation. The strength of the w xattitude changes in California 12 and estimates of the effect of the w xfinance reforms on spending on public education in
  • 59. California 21 suggest that the changes resulting from the reforms were near the top end of this range. The results of the final simulation are far less dramatic. The simulation implies that, if individuals in 1970 had available the schooling options present in 1980, the mean fraction in public schools would have fallen to 0.9055. These supply-side changes explain only 4% of the fall in public enrollment. Nonetheless, this simulation supports the argument that, by failing to account for the diversity of choices in private schooling and the changing nature of the choice set, earlier work has incorrectly attributed a portion of the growth in private schooling to time effects uncorrelated with observable determinants of demand. 7. CONCLUSION In this paper we have shown that education finance reform played a major role in the rapid decline in California public school enrollment during the 1970s. California and other reform states exhibited markedly different trends in private school enrollment in comparison to the rest of the nation. In California, the rapid growth in the private school sector
  • 60. followed the implementation of reforms in response to the first California Supreme Court decision in the Serrano case. Further, that private school FINANCE REFORM AND PRIVATE SCHOOL ENROLLMENT 441 enrollment increased rapidly after the passage of reforms, before any real change in public provision occurred, indicates individuals may have re- sponded to changing expectations of future provision in the public schools. Previous studies have failed to obtain conclusive results on the effect of school financing reform. We argue this failure is attributable to the omission of several important determinants of the public school share of enrollment. To correct for these omissions, we work from a simple qualita- tive choice model to present several modifications to the basic specifica- tion of public schooling demand considered in earlier work. Estimation of this modified specification leads to four main findings. First, failure to account for common, unobserved determinants of demand results in understatement of the role of reform. Second, the inclusion of spending limits, in addition to per pupil expenditures, provides
  • 61. a truer measure of perceptions of current and future public school quality. All the results are consistent with the claim individuals do make schooling deci- sions based on future quality of education. Third, even relatively simple controls for heterogeneity in the population that is making schooling choices improve the quality of the estimated schooling demand equations. That heterogeneity in demand is important should not be surprising, since, in the long run, private schooling can only exist if there is variation in preferred levels of education provision. Finally, information on character- istics of individual private schools provides better insight into the nature of individual demand for schooling. In simulation results, we find a strong case can be made for the claim that the Serrano decisions led to a significant increase in the fraction of students attending private school. Our best estimate is that, in the absence of any changes in private schooling supply, the reform-induced changes in public schooling provision led to a change from 1970 to 1980 in the public school share equal to about 44.5% of the actual change. This result may understate the portion of the enrollment change attributable to the fi- nance reforms, since limited information on the determinants of
  • 62. supply prevents us from determining the portion of the change in enrollment attributable to supply-side responses to the finance reforms. The main implication of these results is that the full range of behavioral responses must be considered when government-imposed limits on local discretion are implemented. In the case of school finance reforms, if constraints on local choice result in a popular backlash, the relative standing of students in poorer districts might be hurt. Proponents of finance reforms are correct in arguing that reforms to promote equity must account for differences in the costs and revenue-raising capacities of school districts. But aid formulas exist that adjust for such fiscal disparities while imposing no substantive limits on local choice in spending. There is almost no case for forcing equalization by eliminating local discretion. DOWNES AND SCHOEMAN442 REFERENCES 1. R. Bahl, D. Sjoquist, and W. L. Williams, School finance reform and impact on property taxes, in ‘‘Proceedings of the Eighty-Third Annual Congress of the National Tax
  • 63. Association}Tax Institute of America,’’ National Tax Association, Columbus, OH � .1990 . 2. J. H. Boyd and R. E. Mellman, The effect of fuel economy standards on the U.S. automotive market: An hedonic demand analysis, Transportation Research}A, 14A, � .367]378 1980 . 3. J. Chamberlain, Education finance reform and private school enrollment, manuscript, Dept. of Economics, Univ. of California at Davis, 1988. 4. C. T. Clotfelter, School desegregation, ‘tipping,’and private school enrollment, Journal of � .Human Resources, 11, 28]50 1976 . 5. R. Cooper and A. John, Coordinating Coordination failures in Keynesian models, � .Quarterly Journal of Economics, 103, 441]463 1988 . 6. T. A. Downes, Evaluating the impact of school finance reform on the provision of public � .education: The California case, National Tax Journal, 45, 405]419 1992 . 7. T. A. Downes, On estimating individual demand for local public goods from aggregate � .data, manuscript, Dept. of Economics, Northwestern Univ. 1993 . 8. T. A. Downes and D. N. Figlio, School finance reforms, tax limits, and student perfor- mance: Do reforms level-up or dumb down, manuscript, Dept.
  • 64. of Economics, Tufts � .Univ. 1997 . 9. T. A. Downes and D. Schoeman, School financing reform and private school enrollment: Evidence from California, Working Paper 93-8, Center for Urban Affairs and Policy � .Research, Northwestern Univ. 1993 . 10. W. N. Evans, S. Murray and R. M. Schwab, Schoolhouses, courthouses, and statehouses � .after Serrano, Journal of Policy Analysis and Management, 16, 10]31 1997 . 11. W. A. Fischel, Did Serrano cause Proposition 13?, National Tax Journal, 42, 465]473 � .1989 . 12. W. A. Fischel, How Serrano caused Proposition 13, Journal of Law and Politics, 12, � .607]636 1996 . 13. G. S. Goldstein and M. V. Pauly, Tiebout bias on the demand for local public goods, � .Journal of Public Economics, 90, 131]144 1981 . 14. B. W. Hamilton and M. K. Macauley, The determinants and consequences of the � .private]public school choice, Journal of Urban Economics, 29, 282]294 1991 . 15. C. M. Hoxby, All school finance equalizations are not created equal: Marginal tax rates � .matter, manuscript, Dept. of Economics, Harvard Univ. 1996 .
  • 65. 16. J. Kozol, ‘‘Savage Inequalities: Children in America’s Schools,’’ Crown Publishers, New � .York 1991 . 17. D. McFadden and F. Reid, Aggregate travel demand forecasting from disaggregated � .models, Transportation Research Record, 534 1975 . 18. L. O. Picus, Cadillacs or Chevrolets?: The evolution of state control over school finance � .in California, Journal of Education Finance, 17, 33]59 1991 . 19. G. J. Reid, The many faces of Tiebout bias in local education demand parameter � .estimates, Journal of Urban Economics, 27, 232]254 1990 . 20. A. B. Schmidt, Private school enrollment in metropolitan areas, Public Finance Quarterly, � .20, 298]320 1992 . 21. F. Silva and J. Sonstelie, Did Serrano cause a decline in school spending? National Tax � .Journal, 48, 199]215 1995 . FINANCE REFORM AND PRIVATE SCHOOL ENROLLMENT 443 22. J. Sonstelie, Public school quality and private school enrollments, National Tax Journal, � .32, 343]353 1979 . 23. J. Sonstelie, The welfare cost of free public schools, Journal of Political Economy, 90,
  • 66. � .794]808 1982 . 24. J. E. Stiglitz, Demand for education in public and private school systems, Journal of � .Public Economics, 3, 349]386 1974 . 25. C. M. Tiebout, A pure theory of local public expenditures, Journal of Political Economy, � .64, 416]424 1956 . 26. K. Train, ‘‘Qualitative Choice Analysis: Theory, Econometrics, and an Application to � .Automobile Demand,’’MIT Press, Cambridge, MA 1986 . 27. F. Welch and A. Light, ‘‘New Evidence on School Desegregation,’’ United States � .Commission on Civil Rights, Washington, DC 1987 . 1. INTRODUCTION2. NATIONAL TRENDS IN PRIVATE SCHOOL ENROLLMENTFIG. 1.3. AN EMPIRICAL FRAMEWORK4. DATATABLE 1TABLE 25. EMPIRICAL RESULTSTABLE 3TABLE 4TABLE 5TABLE 66. SIMULATING THE EFFECTS OF REFORMTABLE 77. CONCLUSIONREFERENCES