SlideShare a Scribd company logo
1 of 21
Download to read offline
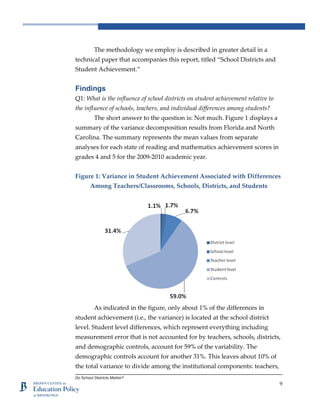
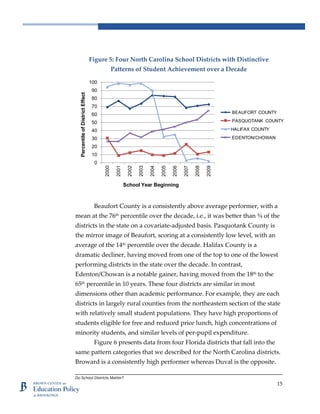
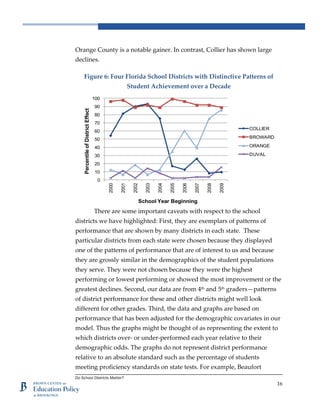
DO SCHOOL DISTRICTS MATTER?
Reuters
Grover J. “Russ” Whitehurst, Matthew M. Chingos,
and Michael R. Gallaher
March 2013
Do School Districts Matter?
1
E X E C U T I V E S U M M A R Y
chool districts occupy center stage in education reform in the U.S.
They manage nearly all public funding and are frequently the locus
of federal and state reform initiatives, e.g., instituting meaningful
teacher evaluation systems. The most charismatic leaders over the last
decade, people such as Michelle Rhee and Joel Klein, have received
considerable national media attention. Financial compensation for district
leaders is high, with many being paid more than the chief state school
officers who oversee the entire systems in which they serve. Some private
philanthropies pour money into initiatives to improve district
performance. Others invest in ways that suggest that they too think
districts are important but as impediments to rather than instruments of
reform.
Despite the centrality of school districts in all the ways described,
we know very little from existing research about how important they are
to student achievement relative to other institutional components for
delivering education services, including teachers and schools. Neither do
we have information on the size of the differences in effectiveness among
districts or whether there are districts that show exceptional patterns of
performance across time, e.g., moving from low to high performing.
We begin to fill these information gaps in the present report by
analyzing 10 years of data involving all public school students and school
districts in Florida and North Carolina. We find that school districts
account for only a small portion (1% to 2%) of the total variation in
student achievement relative to the contribution of schools, teachers,
demographic characteristics of students, and remaining individual
differences among students. Within just the institutional components
affecting student achievement, the effect of schools is about twice that of
districts whereas the effect of teachers is about seven times larger than
that of districts.
Even though district effects are only a small piece of the pie that
represents all the influences on student achievement, there are still
differences among the academic achievement of demographically similar
S
Grover J. Whitehurst
is a senior fellow in
Governance Studies
and director of the
Brown Center on
Education Policy at the
Brookings Institution.
Matthew M. Chingos is
a fellow in the Brown
Center on Education
Policy at the Brookings
Institution.
Michael R. Gallaher is
a research analyst in the
Brown Center on
Education Policy at the
Brookings Institution.
Do School Districts Matter?
2
students in higher and lower performing districts in North Carolina and
Florida that are large enough to be of practical and policy significance.
Combining the data from both states, 4th and 5th grade students in a
district that is at the 70th percentile in district effectiveness are more than 9
weeks ahead of similar students in a district at the 30th
percentile of
effectiveness in their learning of reading and math. There are also districts
that have displayed exceptional patterns of performance in terms of
student achievement over the last decade, including districts that beat
their demographic odds every year, districts that consistently
underperformed, districts that had nose-dive declines, and districts that
experienced transformative growth. These findings provide an empirical
justification for efforts to improve student achievement through district-
level reforms and should be a tantalizing fruit for those who want to
better understand why some districts are better than others and translate
that knowledge into action.
Do School Districts Matter?
3
Do School Districts Matter?
Introduction
School districts occupy center stage in education policy
The roughly 14,000 regular school districts in the U.S. occupy a
central position in the policy and practice of education reform. The
evidence for this assertion is multifaceted. If, for instance, we follow the
money we find that school districts are the accountable agents for nearly
all of the roughly $500 billion annual public investment in elementary and
secondary education through federal, state, and local tax revenues.
Many of the most popular and aggressively promoted school
reform efforts of federal and state governments are focused on school
districts. Performance-based teacher evaluation is a case in point. The
Obama administration’s Race-to-the-Top competition and NCLB state
waivers both required states to commit to plans under which individual
school districts would adopt teacher evaluation systems that produce
meaningful differentiation of teachers, based in part on differences among
teachers in the ability to raise student test scores. In carrying out this
agreement with the federal government, states have provided some broad
guidelines to districts in how to design their evaluation systems, but most
of the details are left up to individual districts to work out.
The central role of individual school districts is also implied by the
media attention that has been given to prominent school superintendents
such as Michelle Rhee in Washington, D.C. and Joel Klein in New York
City. Rhee, for example, was on the cover of Time Magazine in 2008 with
the lead, “Michelle Rhee … head of the D.C. public schools … could
transform public education.”
The pay scale for superintendents also indicates their perceived
importance. In New York State, for example, 63 district leaders each
received over $300,000 in salary and benefits for the 2011-12 school year,
with the superintendent at the top of the list receiving a salary and
benefits package of $541,000.1
Compensation packages for district
Many of the most
popular and
aggressively
promoted school
reform efforts of
federal and state
governments are
focused on school
districts.
Do School Districts Matter?
4
superintendents are typically much higher than for state-level education
officials. To continue with the example of New York, the state
commissioner of education receives a salary of $212,500, which is
substantially less than the salary of many local school district
superintendents in the state system he oversees.
Private philanthropy has invested heavily in district-level reforms
on the premise that districts are powerful agents for change. One of those
philanthropies, the Eli and Edythe Broad Foundation, has led the way in
initiatives that are predicated on the importance of school districts. For
instance, their annual Broad Prize for Education bestows $1 million on the
urban school district that in their judgment has shown the best
performance and improvement.
Other reform initiatives are focused at the district level in the
interesting sense that they are premised on the assumption that traditional
school districts are the problem rather than the solution. Thus advocates
for charter schools, vouchers, inter-district choice, on-line education, and
school portfolio management are making a statement about the
importance of traditional school districts by insisting that they offer a
better alternative.
What do we know about the impact of school districts on student
achievement?
When we turn from policies that assume the importance of school
districts to empirical evidence on their impact, we move from a rich to a
sparse landscape. Little is known about the impact of school districts on
student achievement. And what seems to be known from an earlier
generation of education research rests on a highly questionable set of
methods. A typical study of the importance of school districts conducted
15 years ago would be based on correlations between answers to survey
questions by district superintendents and district-level student
achievement. The finding, for example, that a combination of answers to
questions about leadership style by district superintendents is associated
with differences in student achievement scores would be taken as
Do School Districts Matter?
5
evidence that the leadership style of district leaders is causally related to
student outcomes. Of course, correlation is not causation. By and large the
existing studies on school district effects draw conclusions that could be
due to differences among districts in the characteristics of the students
and families served or other economic and social factors having little to do
with school districts themselves.
New analyses of district effects on student achievement
We address the influence of school districts on student achievement
with new data and analyses, taking up four questions: First: What is the
influence of school districts on student achievement relative to the influence of
schools, teachers, and individual differences among students? We want to know
the size of the school district slice of the pie that represents the total
variation in student achievement. The answer to this question may have
considerable relevance for public policy. If, for example, student outcomes
vary considerably in association with the classroom/teacher to which
students are assigned but very little based on the district in which
students are schooled, it would suggest that federal or state policies
directed at improvements in the quality of the teacher workforce might
pay greater dividends than policies directed at improving the quality of
district leaders or district management practices.
Assuming the district slice of the achievement pie is substantively
greater than zero: Are there differences among districts in their contribution to
student achievement that are large enough to be relevant for policy? If the
answer to our first question is that districts account for a small but
statistically significant amount of variation in student achievement, this
implies that there are differences among districts that have an impact on
student outcomes. However, it does not tell us whether the differences are
large enough to be the focus of public policy. If, for example, the
difference in student performance in districts in the upper vs. the lower
tail of the state distribution of district performance were equivalent to a
difference in schooling of a few days in a school year, policymakers might
be wise to hesitate before investing significant resources to try to close the
We want to
know the size of
the school
district slice of
the pie that
represents the
total variation in
student
achievement.
Do School Districts Matter?
6
district performance gap. In contrast, gaps in student achievement
attributable to differences in school districts equivalent to several weeks of
schooling might well be worth addressing by policies intended to
strengthen lower performing districts.
Can districts be categorized based on patterns of influence on student
academic achievement in ways that would inform efforts to improve district
performance? This question presumes that we answer the first two
questions in the affirmative, i.e., districts have statistically significant
impacts on student achievement that are large enough to be of practical
importance. Establishing policies intended to strengthen district
performance requires predictability in the performance of districts over
time in exactly the same way that building human resource policies
around teacher evaluation data requires that teacher evaluation scores in
one year predict their performance in subsequent years. In other words,
one year of data won’t do. Neither will multiple years of data that
demonstrate a lack of predictability from year to year in terms of which
districts are doing well and which are not. Ideally, we would want to be
able to identify some districts as consistently high performers over time
and others as the opposite, while yet other districts could be categorized
as gainers or decliners.
Being able to address our fourth question (What are the distinctive
features of exceptional districts?) depends on our ability to identify
consistent patterns of district performance over time. If such distinctive
patterns exist, we can ask, for example, whether higher performing
districts are distinguishable from lower performing districts by
characteristics of their superintendents, by the consistency of the
performance of their schools, by their per-pupil expenditures, and so
forth. And we can search for changes in policy and practice that are
associated with districts showing gains and districts showing declines. We
will address the fourth question in a subsequent report.
Two caveats are in order before we present our findings and policy
conclusions. First, we will frequently use terminology that suggests causal
effects because alternate phrasing would be convoluted. However, our
Ideally, we
would want to be
able to identify
some districts as
consistently high
performers over
time and others
as the opposite.
Do School Districts Matter?
7
methods are observational and do not support causal conclusions. When
we write, for example, about “gaps in student achievement attributable to
school districts” we might more accurately write about “associations
among student test scores and the districts in which students are educated
that remain after accounting for variation in student achievement within
districts that is associated with teachers and schools, and with the
inclusion of statistical controls for demographic characteristics of
students.”
The second caveat is that our approach can only identify possible
district effects that result from differences among districts in their
practices. We cannot identify district effects that result from practices that
are common to all districts. For example, suppose that school districts
have a positive impact on student outcomes by relieving those closer to
instructional interactions, such as building principals, from tasks, such as
handling staff payrolls and bus transportation, that take time away from
instructionally relevant activities. This kind of effect would not appear in
our analyses because all districts provide these services and thus all
would improve student achievement by so doing. Note, however, that
this model of why school districts might be important—to let educators at
the building level focus on education—is very different from a model in
which districts compete for great leaders to drive education reform and
enhance student achievement.
Methods
We use K-12 student-level administrative data from the states of
Florida and North Carolina spanning the decade from 2000-2001 to 2009-
2010. Every student in both states who was in grades 4 and 5 in this
decade and participated in the state assessments of reading or
mathematics is represented in our data, as are the classrooms, schools, and
districts those students attended. There are roughly a half million student
observations for each year of data (200,000 for NC and 300,000 for FL),
which leads to about 5 million student data points in our dataset for the
decade.
Do School Districts Matter?
8
We measure how much student achievement varies across districts
in the context of variation in student achievement at the school, classroom,
and student levels. We conduct our most intensive analysis with one year
of data from the 2009-10 school year. We extend our analysis across the
decade of data to identify individual districts that show exceptional
patterns of association with student achievement. Our analyses are multi-
level, using a technique called Hierarchical Linear Modeling, or HLM. The
use of HLM allows us to simultaneously consider differences at the
student, classroom, school, and district levels that take into account the
lack of independence in the observations within these levels.
Our analytic approach employs a rich set of demographic data to
account for differences among classrooms, schools, and districts that arise
because students go to the schools that are close to their place of residence,
and residential neighborhoods vary substantially within and between
districts in their demographics. To the extent that we have valid measures
of demographic differences and control statistically for their uneven
distribution across districts, schools, and classrooms, the more assurance
we have that any differences that remain are due to the impact of teachers,
schools, and districts on student achievement. Our analyses include
controls for student age, race/ethnicity, cognitive disability status, free and
reduced lunch program status (FRPL), limited English proficiency status,
and, for Florida only, whether the parent/student are native English
speakers and whether the student was born in the U.S.2
We limit our analyses to reading and math scores on the state
assessments for students in grades 4-5 because students in these grades
are nearly always in a single classroom for which classroom effects can be
estimated whereas students in later grades are in multiple classrooms and
students in earlier grades do not have the requisite achievement test
results. Being able to estimate teacher effects is important to our goal of
comparing the contribution of districts to student achievement relative to
the contribution of schools and classrooms.3
Our analytic
approach
employs a rich
set of
demographic
data to account
for differences
among
classrooms,
schools, and
districts.
Do School Districts Matter?
9
The methodology we employ is described in greater detail in a
technical paper that accompanies this report, titled “School Districts and
Student Achievement.”
Findings
Q1: What is the influence of school districts on student achievement relative to
the influence of schools, teachers, and individual differences among students?
The short answer to the question is: Not much. Figure 1 displays a
summary of the variance decomposition results from Florida and North
Carolina. The summary represents the mean values from separate
analyses for each state of reading and mathematics achievement scores in
grades 4 and 5 for the 2009-2010 academic year.
Figure 1: Variance in Student Achievement Associated with Differences
Among Teachers/Classrooms, Schools, Districts, and Students
As indicated in the figure, only about 1% of the differences in
student achievement (i.e., the variance) is located at the school district
level. Student level differences, which represent everything including
measurement error that is not accounted for by teachers, schools, districts,
and demographic controls, account for 59% of the variability. The
demographic controls account for another 31%. This leaves about 10% of
the total variance to divide among the institutional components: teachers,
Do School Districts Matter?
10
schools, and districts. Teachers get the bulk of this, followed by schools,
and then districts. The variance decomposition represented in Figure 1
differs somewhat by state and by subject matter. The strongest result for
the district component occurs for mathematics in North Carolina where
the district contribution rises to about 2%.
Q2: Are there differences among districts in their contribution to student
achievement that are large enough to be relevant for policy?
It may appear from the variance decomposition represented in
Figure 1 that school districts have such a small role to play in affecting
student achievement that districts should be ignored by education
reformers. Clearly the differences between districts that influence student
achievement are smaller than differences between teachers and schools
within districts that affect student achievement, whereas all three of these
institutional components are swamped by differences among students and
demographics.
But consider the 6.7% contribution by teachers that is pictured in
Figure 1. That too seems small when compared to the 90% of variance that
is controlled by demographic covariates and differences among students
within classrooms. However, we know from a large body of econometric
research that a standard deviation in teacher effectiveness, e.g., the
difference between teachers who are roughly at the 30th
vs. the 70th
percentiles of teacher performance, is associated with between 0.10 and
0.25 student-level standard deviations on academic tests.4
In our data, a
standard deviation in teacher effectiveness is associated with 0.16 student
standard deviations. This is equivalent to 36% of a school year.5
In other
words, a student with a teacher at the 69th
percentile of effectiveness (0.50
standard deviations above the mean for all teachers) would experience the
equivalent of 13 more weeks of school in a single year compared to a
student with a teacher at the 31st
percentile of effectiveness (0.50 standard
deviations below the mean).6
Of course, differences in teachers more
extreme than 1 standard deviation would have even larger impacts. Thus,
District level
differences
account for
about 1%
of the
variability in
student
achievement.
Do School Districts Matter?
11
a variable that accounts for a relatively small piece of the total student
achievement pie can still be important.
Figure 2: Estimates of Effects on Student Achievement of
Individual School Districts in North Carolina
Figures 2 and 3 suggest that at least at the extremes there are school
districts in both Florida and North Carolina that have impacts on student
achievement that are important to understand and incorporate into
policies and practices that are intended to enhance student achievement.
Each data point in Figures 2 and 3 represents an estimate of the impact of
a single school district in the state on math scores in 2009-10 using the
same model and data that generated the results depicted in Figure 1. The
error bars around each data point represent the 95% confidence limits for
that district’s estimate. Recall that the model we employ is multi-level and
includes a rich set of demographic controls. Thus estimates for individual
districts control for differences in students across districts.
Do School Districts Matter?
12
Figure 3: Estimates of Effects on Student Achievement of
Individual School Districts in Florida
There are several notable findings. First, there are a number of
districts in both states that perform at levels that are above or below the
average for districts in the state by a statistically significant margin. In
Florida, 10% of districts are statistically above average and 7% are
statistically below average. The comparable numbers in North Carolina
are 10% above and 14% below. This means there are districts that are over-
or under-performing on student achievement relative to what might be
expected of them given the characteristics of their students: they add or
subtract value.
Second, the difference in performance between districts is quite
large at the extremes: 0.30 student standard deviations separate the
highest and lowest performing district in the Florida data whereas the
difference is 0.42 standard deviations for North Carolina. Normatively a
year’s growth in math performance for students in 4th
and 5th
grades is
approximately 0.50 standard deviations. This means that the average 4th
and 5th grader in the top-performing district in Florida in 2009-2010 was
Do School Districts Matter?
13
60% of a school year ahead of the average 4th and 5th grader in the lowest
performing district in Florida, controlling for other factors that could
impact student achievement included in our model. The comparable
difference in North Carolina was even larger, at over 80% of a school year.
Of course, comparison of the two districts that differ the most in the
overall distribution of performance can generate a misleading guide to the
potential for improving district performance because any policies
intended to raise student performance in the state by improving the
performance of less effective districts would have to involve many
districts, not just the one that happens to be the low performer in a given
year. Further, the two districts that happen to be the lowest and highest
performers in a given year can hold these ranks due to chance (values in
the tails of a distribution are much less stable than values closer to the
mean).
A more realistic view of the practical importance of district
differences comes from looking at district effects in exactly the same way
that we described teacher effects. We described a standard deviation of
teacher effectiveness as associated with 0.16 standard deviations of
difference in student achievement averaged across reading and math,
which corresponds to about 13 weeks of additional learning for a student
with a teacher 0.50 standard deviations above the mean of teachers
compared to a student with a teacher 0.50 standard deviations below the
mean for teachers. The corresponding relationship for districts is that a
one standard deviation difference in district effectiveness equals 0.11
standard deviations in student achievement. This means that a student in
a district 0.50 standard deviations above the average of all districts would
experience the equivalent of roughly 9 more weeks of learning time by the
end of 4th
and 5th
grade compared to a student in a district 0.50 standard
deviations below the average of all districts. This is about a quarter of a
school year. We suggest that a variable that can potentially increase
education productivity by 25% is important.7
The relationship between the magnitude of district, school, and
teacher effects on student achievement is seen in Figure 4.
In Florida, 10%
of districts are
statistically
above average
and 7% are
statistically
below average.
Do School Districts Matter?
14
Figure 4: Comparison of One Standard Deviation of Teacher/Classroom,
School, and District Differences on Student Achievement*
(* 0.10 student standard deviations = roughly 25% of a school year of learning)
Q3: Can districts be categorized based on patterns of influence on student
academic achievement in ways that would inform efforts to improve district
performance?
We have heretofore presented findings from one school year (2009-
2010) that indicate that even though districts account for only a small
fraction of the overall variance in student achievement on state tests, there
are nonetheless differences among districts in their performance that
suggest the importance of improving district policies and practice. But
district reform is nearly always a multi-year endeavor that would need to
be informed by more than one year of data on student performance. A
district targeted for improvement should be one that is chronically
underperforming or is in decline. Similarly, a district to be singled out for
its excellence and pointed to as a model for others to use for improvement
should be one that is either persistently high performing or has shown a
clear pattern of improvement. Are there such identifiable patterns of
performance among school districts in Florida and North Carolina?
Figure 5 displays data from four districts in North Carolina with
exceptional patterns of performance over the decade from 2000-2001 to
2009-2010. The horizontal axis is the school year. The vertical axis displays
the percentile score of each district for each year on math performance
relative to other districts, with individual district effect sizes adjusted for
demographic covariates and the multi-level nature of our analysis using
the same model that generated the data in Figure 1.
A district
targeted for
improvement
should be one
that is
chronically
underperforming
or is in decline.
Do School Districts Matter?
15
Figure 5: Four North Carolina School Districts with Distinctive
Patterns of Student Achievement over a Decade
Beaufort County is a consistently above average performer, with a
mean at the 76th
percentile over the decade, i.e., it was better than Âľ of the
districts in the state on a covariate-adjusted basis. Pasquotank County is
the mirror image of Beaufort, scoring at a consistently low level, with an
average of the 14th
percentile over the decade. Halifax County is a
dramatic decliner, having moved from one of the top to one of the lowest
performing districts in the state over the decade. In contrast,
Edenton/Chowan is a notable gainer, having moved from the 18th
to the
65th
percentile in 10 years. These four districts are similar in most
dimensions other than academic performance. For example, they are each
districts in largely rural counties from the northeastern section of the state
with relatively small student populations. They have high proportions of
students eligible for free and reduced price lunch, high concentrations of
minority students, and similar levels of per-pupil expenditure.
Figure 6 presents data from four Florida districts that fall into the
same pattern categories that we described for the North Carolina districts.
Broward is a consistently high performer whereas Duval is the opposite.
0
10
20
30
40
50
60
70
80
90
100
2000
2001
2002
2003
2004
2005
2006
2007
2008
2009
PercentileofDistrictEffect
School Year Beginning
BEAUFORT COUNTY
PASQUOTANK COUNTY
HALIFAX COUNTY
EDENTON/CHOWAN
Do School Districts Matter?
16
Orange County is a notable gainer. In contrast, Collier has shown large
declines.
Figure 6: Four Florida School Districts with Distinctive Patterns of
Student Achievement over a Decade
There are some important caveats with respect to the school
districts we have highlighted: First, they are exemplars of patterns of
performance that are shown by many districts in each state. These
particular districts from each state were chosen because they displayed
one of the patterns of performance that are of interest to us and because
they are grossly similar in the demographics of the student populations
they serve. They were not chosen because they were the highest
performing or lowest performing or showed the most improvement or the
greatest declines. Second, our data are from 4th
and 5th
graders—patterns
of district performance for these and other districts might well look
different for other grades. Third, the data and graphs are based on
performance that has been adjusted for the demographic covariates in our
model. Thus the graphs might be thought of as representing the extent to
which districts over- or under-performed each year relative to their
demographic odds. The graphs do not represent district performance
relative to an absolute standard such as the percentage of students
meeting proficiency standards on state tests. For example, Beaufort
0
10
20
30
40
50
60
70
80
90
100
2000
2001
2002
2003
2004
2005
2006
2007
2008
2009
PercentileofDistrictEffect
School Year Beginning
COLLIER
BROWARD
ORANGE
DUVAL
Do School Districts Matter?
17
County, which averaged in the top quartile of North Carolina districts in
our covariate-adjusted model, was slightly below average based on the
raw scores of its 4th and 5th graders. Thus the district did very well relative
to the rest of the state given its high minority, high poverty student
population but many of its students did not reach proficiency standards
on state tests and the majority of its schools failed to make adequate
yearly progress under No Child Left Behind.
Summary and conclusions
Very little of the total variation in student achievement, only about
1% to 2%, lies at the level of the school district. Despite that, differences
between school districts in effectiveness are large enough at the extremes
to represent more than a half-year difference in schooling. In other words,
if students educated in the least effective school district in North Carolina
or Florida had been educated instead in the most effective district, the
evidence suggests that their academic performance at the end of 4th
and 5th
grade would be higher by an amount equivalent to having attended
school for at least a half-year more. Even the difference between a district
that lies at the 31st
percentile and one at the 69th
percentile (a 1 standard
deviation difference in district effectiveness) is equivalent to more than
two months of schooling. These are differences that are large enough to
warrant policy attention.
Further, individual districts within the states of Florida and North
Carolina display patterns of effectiveness over many years that cry out for
explanation and understanding. Some districts show patterns of
continuous improvement that move them from very low performing to
substantially above average. Other districts show precipitous declines.
Still other districts manage to beat their demographic odds year after year,
whereas others are consistently low performers. If we found such
differential patterns of effectiveness in the context of industrial production
or sports team win/loss records or chain store sales or hospital
readmission rates we would think that surely it would be possible to find
out what accounts for them. And we would reasonably assume that
Individual
districts display
patterns of
effectiveness over
many years that
cry out for
explanation and
understanding.
Do School Districts Matter?
18
knowledge of why one plant or team or store or hospital does better than
others would lead to interventions that would successfully bring up the
low performers. The same logic model applies to differences in the
effectiveness of school districts.
There is no reason to expect that a particular intervention intended
to improve district level performance such as hiring a superstar
superintendent or providing more autonomy to school leaders or
changing teacher compensation packages would come close to achieving
outcomes as large as the naturally occurring differences in district
effectiveness found in our analysis. In that sense, our estimates are upper
bounds on what might be expected from policies intended to improve
lower performing districts. But our finding of large differences in
performance over time between the upper and lower echelon districts as
well as the existence of transformative districts that have shown
substantial improvement or deterioration in their performance suggests a
tantalizing fruit for education researchers and reformers.
Do School Districts Matter?
19
Endnotes
1
New York State Education Department, Administrative Compensation Information for 2011-
2012 (New York City: New York State Education Department, 2011).
http://www.p12.nysed.gov/mgtserv/admincomp/docs/2011-
12_AdminSalDisc_5_11_11_Post_r.xls
2
We do not use in the present report a student growth model that measures district effectiveness
by the gains that students experience on state tests from one year to the next. It is possible and
probably likely that districts that have an impact on student achievement do so in all or most
grades. If we measured district effectiveness only by the gains generated for students between
grades 4 and 5 we would penalize districts that impacted student outcomes in earlier grades.
3
We use a student growth model in a technical paper that accompanies this report and in future
work on districts using the same dataset. We limit our analysis in the present report to 4th
and 5th
graders for whom the growth model can be calculated rather than also including 3rd
graders in
order to retain comparability with results from these other, related papers.
4
Thomas J, Kane, Eric S. Taylor, John H. Tyler, and Amy L. Wooten, Identifying Effective
Classroom Practices Using Student Achievement Data, Working Paper 15803 (Cambridge:
National Bureau of Economic Research, 2010).
5
This calculation is based on a normal year’s average growth in reading and math in grades 4 and
5 of 0.42 standard deviations, as reported in Carolyn J. Hill, Howard S. Bloom, Alison Rebeck
Black, and Mark W. Lipsey, Empirical Benchmarks for Interpreting Effect Sizes in Research,
MDRC Working Papers on Research Methodology (New York: MDRC, 2007).
6
This conversion is based on a 180-day school year, equivalent to 36 full weeks of instruction.
7
Teacher and district effects as we measure them accrue over different time spans. Teacher effects
can be attributed to the teachers students experienced in grades 4 and 5. District effects, in
contrast, are a result of school experiences that cumulate from kindergarten. This may make it
seem that the district effects should be adjusted downward by dividing them by the years of
schooling on which they are estimated if they are to be compared to teacher effects. However,
whereas district effects represent the net boost to student achievement that result from going to
school in a particular school district for a given number of years, teacher effects over the same
time span within the same district would average zero unless there were improvements over time
in the overall quality of the teacher workforce. This is because children on average would
experience both good and bad teachers in equal numbers as they move through the grades with
effects that would cancel out each other.
Do School Districts Matter?
20
About the Brown Center on Education Policy
Established in 1992, the Brown Center on Education Policy conducts research and provides policy
recommendations on topics in American education. The Brown Center is part of The Brookings
Institution, a private nonprofit organization devoted to independent research and innovative policy
solutions. For more than 90 years, Brookings has analyzed current and emerging issues and
produced new ideas that matter - for the nation and the world.
Brown Center on Education Policy
The Brookings Institution
1775 Massachusetts Ave. NW
Washington DC, 20036
202.797.6090
202.797.6144 (f)
http://www.brookings.edu/brown.aspx
Email your comments to
browncenter@brookings.edu
The Brookings Institution is a private non-profit
organization. Its mission is to conduct high-
quality, independent research and, based on that
research, to provide innovative, practical
recommendations for policymakers and the
public. The conclusions and recommendations of
any Brookings publication are solely those of its
author(s), and do not reflect the views of the
Institution, its management, or its other scholars.
Brookings recognizes that the value it provides is
in its absolute commitment to quality,
independence and impact. Activities supported by
its donors reflect this commitment and the
analysis and recommendations are not
determined or influenced by any donation.
Governance Studies
The Brookings Institution
1775 Massachusetts Ave., NW
Washington, DC 20036
Tel: 202.797.6090
Fax: 202.797.6144
www.brookings.edu/governance.aspx
Editing, Production & Layout
Ashley Inman

More Related Content

What's hot

Power and Authority Presentation
Power and Authority PresentationPower and Authority Presentation
Power and Authority Presentationrayboss1100
 
McGuinn CV Sept 2016
McGuinn CV Sept 2016McGuinn CV Sept 2016
McGuinn CV Sept 2016Patrick McGuinn
 
How leadership-influences-student-learning
How leadership-influences-student-learningHow leadership-influences-student-learning
How leadership-influences-student-learningElniziana
 
By The People For The People: People’s Influence On Students In Selecting Tec...
By The People For The People: People’s Influence On Students In Selecting Tec...By The People For The People: People’s Influence On Students In Selecting Tec...
By The People For The People: People’s Influence On Students In Selecting Tec...Prashant Mahajan
 
Dr. William Allan Kritsonis, Editor-in-Chief, NATIONAL FORUM JOURNALS (Since ...
Dr. William Allan Kritsonis, Editor-in-Chief, NATIONAL FORUM JOURNALS (Since ...Dr. William Allan Kritsonis, Editor-in-Chief, NATIONAL FORUM JOURNALS (Since ...
Dr. William Allan Kritsonis, Editor-in-Chief, NATIONAL FORUM JOURNALS (Since ...William Kritsonis
 
Dr. W.A. Kritsonis, Editor, NATIONAL FORUM JOURNALS
Dr. W.A. Kritsonis, Editor, NATIONAL FORUM JOURNALSDr. W.A. Kritsonis, Editor, NATIONAL FORUM JOURNALS
Dr. W.A. Kritsonis, Editor, NATIONAL FORUM JOURNALSWilliam Kritsonis
 
Assessing the Impact of Academic Preparation, Finances and Social Ca...
Assessing the Impact  of Academic Preparation, Finances         and Social Ca...Assessing the Impact  of Academic Preparation, Finances         and Social Ca...
Assessing the Impact of Academic Preparation, Finances and Social Ca...Iria Puyosa
 
Parenting Politics-Stacey Davenport
Parenting Politics-Stacey DavenportParenting Politics-Stacey Davenport
Parenting Politics-Stacey Davenportmcpheecdlegs
 
Education & Socioeconomic Status Fact Sheet
Education & Socioeconomic Status Fact SheetEducation & Socioeconomic Status Fact Sheet
Education & Socioeconomic Status Fact Sheetmokshacts
 
Encouraging Enrolments by People’s Influence; A desperate need for Technical ...
Encouraging Enrolments by People’s Influence; A desperate need for Technical ...Encouraging Enrolments by People’s Influence; A desperate need for Technical ...
Encouraging Enrolments by People’s Influence; A desperate need for Technical ...Prashant Mahajan
 
Memo4_BerkeleyCTeate.docx
Memo4_BerkeleyCTeate.docxMemo4_BerkeleyCTeate.docx
Memo4_BerkeleyCTeate.docxBerkeley Teate
 
CAAE_Annotated_Bibliography_FINAL
CAAE_Annotated_Bibliography_FINALCAAE_Annotated_Bibliography_FINAL
CAAE_Annotated_Bibliography_FINALErin McCarthy
 
Bullying characteristics
Bullying characteristicsBullying characteristics
Bullying characteristicsEDITHA HONRADEZ
 
Culturally responsive pbis (8) (2)
Culturally responsive pbis (8) (2)Culturally responsive pbis (8) (2)
Culturally responsive pbis (8) (2)UO_AcademicExtension
 
The iGeneration Goes to College
The iGeneration Goes to CollegeThe iGeneration Goes to College
The iGeneration Goes to CollegeJohny Tadros
 
Influence of Financial Support Services on Academic Performance of Secondary ...
Influence of Financial Support Services on Academic Performance of Secondary ...Influence of Financial Support Services on Academic Performance of Secondary ...
Influence of Financial Support Services on Academic Performance of Secondary ...QUESTJOURNAL
 
Dr. William Allan Kritsonis, Dissertation Chair for Sheri L. Miller-Williams,...
Dr. William Allan Kritsonis, Dissertation Chair for Sheri L. Miller-Williams,...Dr. William Allan Kritsonis, Dissertation Chair for Sheri L. Miller-Williams,...
Dr. William Allan Kritsonis, Dissertation Chair for Sheri L. Miller-Williams,...William Kritsonis
 

What's hot (18)

Power and Authority Presentation
Power and Authority PresentationPower and Authority Presentation
Power and Authority Presentation
 
McGuinn CV Sept 2016
McGuinn CV Sept 2016McGuinn CV Sept 2016
McGuinn CV Sept 2016
 
How leadership-influences-student-learning
How leadership-influences-student-learningHow leadership-influences-student-learning
How leadership-influences-student-learning
 
By The People For The People: People’s Influence On Students In Selecting Tec...
By The People For The People: People’s Influence On Students In Selecting Tec...By The People For The People: People’s Influence On Students In Selecting Tec...
By The People For The People: People’s Influence On Students In Selecting Tec...
 
Dr. William Allan Kritsonis, Editor-in-Chief, NATIONAL FORUM JOURNALS (Since ...
Dr. William Allan Kritsonis, Editor-in-Chief, NATIONAL FORUM JOURNALS (Since ...Dr. William Allan Kritsonis, Editor-in-Chief, NATIONAL FORUM JOURNALS (Since ...
Dr. William Allan Kritsonis, Editor-in-Chief, NATIONAL FORUM JOURNALS (Since ...
 
Dr. W.A. Kritsonis, Editor, NATIONAL FORUM JOURNALS
Dr. W.A. Kritsonis, Editor, NATIONAL FORUM JOURNALSDr. W.A. Kritsonis, Editor, NATIONAL FORUM JOURNALS
Dr. W.A. Kritsonis, Editor, NATIONAL FORUM JOURNALS
 
Assessing the Impact of Academic Preparation, Finances and Social Ca...
Assessing the Impact  of Academic Preparation, Finances         and Social Ca...Assessing the Impact  of Academic Preparation, Finances         and Social Ca...
Assessing the Impact of Academic Preparation, Finances and Social Ca...
 
How Parents Experience Public School Choice
How Parents Experience Public School ChoiceHow Parents Experience Public School Choice
How Parents Experience Public School Choice
 
Parenting Politics-Stacey Davenport
Parenting Politics-Stacey DavenportParenting Politics-Stacey Davenport
Parenting Politics-Stacey Davenport
 
Education & Socioeconomic Status Fact Sheet
Education & Socioeconomic Status Fact SheetEducation & Socioeconomic Status Fact Sheet
Education & Socioeconomic Status Fact Sheet
 
Encouraging Enrolments by People’s Influence; A desperate need for Technical ...
Encouraging Enrolments by People’s Influence; A desperate need for Technical ...Encouraging Enrolments by People’s Influence; A desperate need for Technical ...
Encouraging Enrolments by People’s Influence; A desperate need for Technical ...
 
Memo4_BerkeleyCTeate.docx
Memo4_BerkeleyCTeate.docxMemo4_BerkeleyCTeate.docx
Memo4_BerkeleyCTeate.docx
 
CAAE_Annotated_Bibliography_FINAL
CAAE_Annotated_Bibliography_FINALCAAE_Annotated_Bibliography_FINAL
CAAE_Annotated_Bibliography_FINAL
 
Bullying characteristics
Bullying characteristicsBullying characteristics
Bullying characteristics
 
Culturally responsive pbis (8) (2)
Culturally responsive pbis (8) (2)Culturally responsive pbis (8) (2)
Culturally responsive pbis (8) (2)
 
The iGeneration Goes to College
The iGeneration Goes to CollegeThe iGeneration Goes to College
The iGeneration Goes to College
 
Influence of Financial Support Services on Academic Performance of Secondary ...
Influence of Financial Support Services on Academic Performance of Secondary ...Influence of Financial Support Services on Academic Performance of Secondary ...
Influence of Financial Support Services on Academic Performance of Secondary ...
 
Dr. William Allan Kritsonis, Dissertation Chair for Sheri L. Miller-Williams,...
Dr. William Allan Kritsonis, Dissertation Chair for Sheri L. Miller-Williams,...Dr. William Allan Kritsonis, Dissertation Chair for Sheri L. Miller-Williams,...
Dr. William Allan Kritsonis, Dissertation Chair for Sheri L. Miller-Williams,...
 

Viewers also liked

Hvordan skal Norge bygge merkevaren om kysten og kystkulturen?
Hvordan skal Norge bygge merkevaren om kysten og kystkulturen?Hvordan skal Norge bygge merkevaren om kysten og kystkulturen?
Hvordan skal Norge bygge merkevaren om kysten og kystkulturen?Innovation Norway
 
Presentation on JBA services for visiting Kenyan librarians
Presentation on JBA services for visiting Kenyan librariansPresentation on JBA services for visiting Kenyan librarians
Presentation on JBA services for visiting Kenyan librariansTara Lannen-Stanton
 
Mercedes f7001
Mercedes f7001Mercedes f7001
Mercedes f7001dimgaloutzis1
 
Farma & farma no maranhĂŁo
Farma & farma no maranhĂŁoFarma & farma no maranhĂŁo
Farma & farma no maranhĂŁofarmaefarma
 

Viewers also liked (7)

Hvordan skal Norge bygge merkevaren om kysten og kystkulturen?
Hvordan skal Norge bygge merkevaren om kysten og kystkulturen?Hvordan skal Norge bygge merkevaren om kysten og kystkulturen?
Hvordan skal Norge bygge merkevaren om kysten og kystkulturen?
 
Fab10 MakerConvent
Fab10 MakerConventFab10 MakerConvent
Fab10 MakerConvent
 
Emprendimiento
EmprendimientoEmprendimiento
Emprendimiento
 
Presentation on JBA services for visiting Kenyan librarians
Presentation on JBA services for visiting Kenyan librariansPresentation on JBA services for visiting Kenyan librarians
Presentation on JBA services for visiting Kenyan librarians
 
Mercedes f7001
Mercedes f7001Mercedes f7001
Mercedes f7001
 
Slideshare
SlideshareSlideshare
Slideshare
 
Farma & farma no maranhĂŁo
Farma & farma no maranhĂŁoFarma & farma no maranhĂŁo
Farma & farma no maranhĂŁo
 

Similar to Do School Districts Matter?

sharon william griffin & green done
sharon william griffin & green donesharon william griffin & green done
sharon william griffin & green doneWilliam Kritsonis
 
Matthew_Sullivan_Honors_Thesis
Matthew_Sullivan_Honors_ThesisMatthew_Sullivan_Honors_Thesis
Matthew_Sullivan_Honors_ThesisMatthew Sullivan
 
Identifying District Policy Aimed At Upgrading Math And Science Curriculum
Identifying District Policy Aimed At Upgrading Math And Science CurriculumIdentifying District Policy Aimed At Upgrading Math And Science Curriculum
Identifying District Policy Aimed At Upgrading Math And Science Curriculumnoblex1
 
Multiple Regression Review1) Please explain why the adjusted R
Multiple Regression Review1) Please explain why the adjusted RMultiple Regression Review1) Please explain why the adjusted R
Multiple Regression Review1) Please explain why the adjusted Rsimisterchristen
 
Hemmer, lynn a cross case state analysis ijobe v2 n1 2014
Hemmer, lynn a cross case state analysis ijobe v2 n1 2014Hemmer, lynn a cross case state analysis ijobe v2 n1 2014
Hemmer, lynn a cross case state analysis ijobe v2 n1 2014William Kritsonis
 
Creating Schools That Are Successful In Teaching And Learning
Creating Schools That Are Successful In Teaching And LearningCreating Schools That Are Successful In Teaching And Learning
Creating Schools That Are Successful In Teaching And Learningnoblex1
 
EDUCARNIVAL 2014 at IIT Delhi- How leadership-influences-student-learning
EDUCARNIVAL 2014 at IIT Delhi- How leadership-influences-student-learningEDUCARNIVAL 2014 at IIT Delhi- How leadership-influences-student-learning
EDUCARNIVAL 2014 at IIT Delhi- How leadership-influences-student-learningEduexcellence
 
The Fiscal Externalities of Charter Schools: Evidence from North Carolina
The Fiscal Externalities of Charter Schools: Evidence from North CarolinaThe Fiscal Externalities of Charter Schools: Evidence from North Carolina
The Fiscal Externalities of Charter Schools: Evidence from North CarolinaAnalisa Sorrells
 
Institutional Retention Strategies at Historically Black Colleges and Univers...
Institutional Retention Strategies at Historically Black Colleges and Univers...Institutional Retention Strategies at Historically Black Colleges and Univers...
Institutional Retention Strategies at Historically Black Colleges and Univers...Dawn Follin
 
Chapter 6 edu 250
Chapter 6  edu 250Chapter 6  edu 250
Chapter 6 edu 250amb75878
 
Ventura counseling presentation 12 1 3
Ventura counseling presentation 12 1 3Ventura counseling presentation 12 1 3
Ventura counseling presentation 12 1 3mdalgarn
 
Graduationrates
GraduationratesGraduationrates
Graduationrateslcmsturgis
 
Many rural California high schools are impacted by the disadva.docx
Many rural California high schools are impacted by the disadva.docxMany rural California high schools are impacted by the disadva.docx
Many rural California high schools are impacted by the disadva.docxalfredacavx97
 
EDD614ASSIGNMENTCASE2Trident International University .docx
EDD614ASSIGNMENTCASE2Trident International University .docxEDD614ASSIGNMENTCASE2Trident International University .docx
EDD614ASSIGNMENTCASE2Trident International University .docxbudabrooks46239
 
Educational Leaders Must Strive To Increase Resources Available For Their Sch...
Educational Leaders Must Strive To Increase Resources Available For Their Sch...Educational Leaders Must Strive To Increase Resources Available For Their Sch...
Educational Leaders Must Strive To Increase Resources Available For Their Sch...RajaDastan
 
Module OverviewLiberal and Market Models of Higher Education .docx
Module OverviewLiberal and Market Models of Higher Education .docxModule OverviewLiberal and Market Models of Higher Education .docx
Module OverviewLiberal and Market Models of Higher Education .docxaudeleypearl
 
Module OverviewLiberal and Market Models of Higher Education
Module OverviewLiberal and Market Models of Higher Education Module OverviewLiberal and Market Models of Higher Education
Module OverviewLiberal and Market Models of Higher Education AlyciaGold776
 
Empirical Reasearch Project
Empirical Reasearch ProjectEmpirical Reasearch Project
Empirical Reasearch ProjectEmerald J Kleespies
 
Running head HIGHER EDUCATION POLICIES1HIGHER EDUCATION POLIC.docx
Running head HIGHER EDUCATION POLICIES1HIGHER EDUCATION POLIC.docxRunning head HIGHER EDUCATION POLICIES1HIGHER EDUCATION POLIC.docx
Running head HIGHER EDUCATION POLICIES1HIGHER EDUCATION POLIC.docxwlynn1
 

Similar to Do School Districts Matter? (20)

sharon william griffin & green done
sharon william griffin & green donesharon william griffin & green done
sharon william griffin & green done
 
Matthew_Sullivan_Honors_Thesis
Matthew_Sullivan_Honors_ThesisMatthew_Sullivan_Honors_Thesis
Matthew_Sullivan_Honors_Thesis
 
Identifying District Policy Aimed At Upgrading Math And Science Curriculum
Identifying District Policy Aimed At Upgrading Math And Science CurriculumIdentifying District Policy Aimed At Upgrading Math And Science Curriculum
Identifying District Policy Aimed At Upgrading Math And Science Curriculum
 
Multiple Regression Review1) Please explain why the adjusted R
Multiple Regression Review1) Please explain why the adjusted RMultiple Regression Review1) Please explain why the adjusted R
Multiple Regression Review1) Please explain why the adjusted R
 
Hemmer, lynn a cross case state analysis ijobe v2 n1 2014
Hemmer, lynn a cross case state analysis ijobe v2 n1 2014Hemmer, lynn a cross case state analysis ijobe v2 n1 2014
Hemmer, lynn a cross case state analysis ijobe v2 n1 2014
 
Creating Schools That Are Successful In Teaching And Learning
Creating Schools That Are Successful In Teaching And LearningCreating Schools That Are Successful In Teaching And Learning
Creating Schools That Are Successful In Teaching And Learning
 
EDUCARNIVAL 2014 at IIT Delhi- How leadership-influences-student-learning
EDUCARNIVAL 2014 at IIT Delhi- How leadership-influences-student-learningEDUCARNIVAL 2014 at IIT Delhi- How leadership-influences-student-learning
EDUCARNIVAL 2014 at IIT Delhi- How leadership-influences-student-learning
 
The Fiscal Externalities of Charter Schools: Evidence from North Carolina
The Fiscal Externalities of Charter Schools: Evidence from North CarolinaThe Fiscal Externalities of Charter Schools: Evidence from North Carolina
The Fiscal Externalities of Charter Schools: Evidence from North Carolina
 
Institutional Retention Strategies at Historically Black Colleges and Univers...
Institutional Retention Strategies at Historically Black Colleges and Univers...Institutional Retention Strategies at Historically Black Colleges and Univers...
Institutional Retention Strategies at Historically Black Colleges and Univers...
 
Chapter 6 edu 250
Chapter 6  edu 250Chapter 6  edu 250
Chapter 6 edu 250
 
Ventura counseling presentation 12 1 3
Ventura counseling presentation 12 1 3Ventura counseling presentation 12 1 3
Ventura counseling presentation 12 1 3
 
Graduationrates
GraduationratesGraduationrates
Graduationrates
 
Many rural California high schools are impacted by the disadva.docx
Many rural California high schools are impacted by the disadva.docxMany rural California high schools are impacted by the disadva.docx
Many rural California high schools are impacted by the disadva.docx
 
EDD614ASSIGNMENTCASE2Trident International University .docx
EDD614ASSIGNMENTCASE2Trident International University .docxEDD614ASSIGNMENTCASE2Trident International University .docx
EDD614ASSIGNMENTCASE2Trident International University .docx
 
Educational Leaders Must Strive To Increase Resources Available For Their Sch...
Educational Leaders Must Strive To Increase Resources Available For Their Sch...Educational Leaders Must Strive To Increase Resources Available For Their Sch...
Educational Leaders Must Strive To Increase Resources Available For Their Sch...
 
Module OverviewLiberal and Market Models of Higher Education .docx
Module OverviewLiberal and Market Models of Higher Education .docxModule OverviewLiberal and Market Models of Higher Education .docx
Module OverviewLiberal and Market Models of Higher Education .docx
 
Module OverviewLiberal and Market Models of Higher Education
Module OverviewLiberal and Market Models of Higher Education Module OverviewLiberal and Market Models of Higher Education
Module OverviewLiberal and Market Models of Higher Education
 
Empirical Reasearch Project
Empirical Reasearch ProjectEmpirical Reasearch Project
Empirical Reasearch Project
 
Wp 182
Wp 182Wp 182
Wp 182
 
Running head HIGHER EDUCATION POLICIES1HIGHER EDUCATION POLIC.docx
Running head HIGHER EDUCATION POLICIES1HIGHER EDUCATION POLIC.docxRunning head HIGHER EDUCATION POLICIES1HIGHER EDUCATION POLIC.docx
Running head HIGHER EDUCATION POLICIES1HIGHER EDUCATION POLIC.docx
 

More from Luis Taveras EMBA, MS

Where is Our Government? Part II
Where is Our Government? Part IIWhere is Our Government? Part II
Where is Our Government? Part IILuis Taveras EMBA, MS
 
NYC DOE's Overssight of Computer Hardware Purchased
NYC DOE's Overssight of Computer Hardware PurchasedNYC DOE's Overssight of Computer Hardware Purchased
NYC DOE's Overssight of Computer Hardware PurchasedLuis Taveras EMBA, MS
 
How NYC'S Pension Costs Threaten Its Future
How NYC'S Pension Costs Threaten Its FutureHow NYC'S Pension Costs Threaten Its Future
How NYC'S Pension Costs Threaten Its FutureLuis Taveras EMBA, MS
 
American Competitiveness Initiative:Leading the World in Innovation aci06-b...
American Competitiveness Initiative:Leading the World in Innovation   aci06-b...American Competitiveness Initiative:Leading the World in Innovation   aci06-b...
American Competitiveness Initiative:Leading the World in Innovation aci06-b...Luis Taveras EMBA, MS
 
The Latino Effect on Economic Growth
The Latino Effect on Economic Growth The Latino Effect on Economic Growth
The Latino Effect on Economic Growth Luis Taveras EMBA, MS
 
AUDIT REPORT OF SUCCESS ACADEMY CHARTER SCHOOLS
AUDIT REPORT OF SUCCESS ACADEMY CHARTER SCHOOLSAUDIT REPORT OF SUCCESS ACADEMY CHARTER SCHOOLS
AUDIT REPORT OF SUCCESS ACADEMY CHARTER SCHOOLSLuis Taveras EMBA, MS
 
Investigation of The City University of New York
Investigation of The City University of New York Investigation of The City University of New York
Investigation of The City University of New York Luis Taveras EMBA, MS
 
Optimization with an Impact (OpIm)
Optimization with an Impact (OpIm)Optimization with an Impact (OpIm)
Optimization with an Impact (OpIm)Luis Taveras EMBA, MS
 
Global Pensions Asset Study 2016
Global Pensions Asset Study 2016Global Pensions Asset Study 2016
Global Pensions Asset Study 2016Luis Taveras EMBA, MS
 
The Securities Industry in New York City
The Securities Industry in New York CityThe Securities Industry in New York City
The Securities Industry in New York CityLuis Taveras EMBA, MS
 
School Finance_Traditional vs. Charter Schools
School Finance_Traditional vs. Charter SchoolsSchool Finance_Traditional vs. Charter Schools
School Finance_Traditional vs. Charter SchoolsLuis Taveras EMBA, MS
 
The Educational Impact of Broadband Sudsidies for Schools Under ERate
The Educational Impact of Broadband Sudsidies for Schools Under ERateThe Educational Impact of Broadband Sudsidies for Schools Under ERate
The Educational Impact of Broadband Sudsidies for Schools Under ERateLuis Taveras EMBA, MS
 
I don't want to see homeless riff raff
I don't want to see homeless riff raff I don't want to see homeless riff raff
I don't want to see homeless riff raff Luis Taveras EMBA, MS
 
High-Tech Employees "No Poach" Antitrust Litigation
High-Tech Employees "No Poach" Antitrust LitigationHigh-Tech Employees "No Poach" Antitrust Litigation
High-Tech Employees "No Poach" Antitrust LitigationLuis Taveras EMBA, MS
 
How Apple Sidesteps Billions in Taxes
How Apple Sidesteps Billions in TaxesHow Apple Sidesteps Billions in Taxes
How Apple Sidesteps Billions in TaxesLuis Taveras EMBA, MS
 

More from Luis Taveras EMBA, MS (20)

Where is Our Government? Part II
Where is Our Government? Part IIWhere is Our Government? Part II
Where is Our Government? Part II
 
Leadership Academy _Audit
Leadership Academy _AuditLeadership Academy _Audit
Leadership Academy _Audit
 
NYC DOE's Overssight of Computer Hardware Purchased
NYC DOE's Overssight of Computer Hardware PurchasedNYC DOE's Overssight of Computer Hardware Purchased
NYC DOE's Overssight of Computer Hardware Purchased
 
How NYC'S Pension Costs Threaten Its Future
How NYC'S Pension Costs Threaten Its FutureHow NYC'S Pension Costs Threaten Its Future
How NYC'S Pension Costs Threaten Its Future
 
American Competitiveness Initiative:Leading the World in Innovation aci06-b...
American Competitiveness Initiative:Leading the World in Innovation   aci06-b...American Competitiveness Initiative:Leading the World in Innovation   aci06-b...
American Competitiveness Initiative:Leading the World in Innovation aci06-b...
 
NYC PENSION COST
NYC PENSION COST NYC PENSION COST
NYC PENSION COST
 
The Latino Effect on Economic Growth
The Latino Effect on Economic Growth The Latino Effect on Economic Growth
The Latino Effect on Economic Growth
 
AUDIT REPORT OF SUCCESS ACADEMY CHARTER SCHOOLS
AUDIT REPORT OF SUCCESS ACADEMY CHARTER SCHOOLSAUDIT REPORT OF SUCCESS ACADEMY CHARTER SCHOOLS
AUDIT REPORT OF SUCCESS ACADEMY CHARTER SCHOOLS
 
PresentationtoCD
PresentationtoCDPresentationtoCD
PresentationtoCD
 
Investigation of The City University of New York
Investigation of The City University of New York Investigation of The City University of New York
Investigation of The City University of New York
 
Optimization with an Impact (OpIm)
Optimization with an Impact (OpIm)Optimization with an Impact (OpIm)
Optimization with an Impact (OpIm)
 
Global Pensions Asset Study 2016
Global Pensions Asset Study 2016Global Pensions Asset Study 2016
Global Pensions Asset Study 2016
 
The Securities Industry in New York City
The Securities Industry in New York CityThe Securities Industry in New York City
The Securities Industry in New York City
 
References
ReferencesReferences
References
 
School Finance_Traditional vs. Charter Schools
School Finance_Traditional vs. Charter SchoolsSchool Finance_Traditional vs. Charter Schools
School Finance_Traditional vs. Charter Schools
 
The Educational Impact of Broadband Sudsidies for Schools Under ERate
The Educational Impact of Broadband Sudsidies for Schools Under ERateThe Educational Impact of Broadband Sudsidies for Schools Under ERate
The Educational Impact of Broadband Sudsidies for Schools Under ERate
 
I don't want to see homeless riff raff
I don't want to see homeless riff raff I don't want to see homeless riff raff
I don't want to see homeless riff raff
 
High-Tech Employees "No Poach" Antitrust Litigation
High-Tech Employees "No Poach" Antitrust LitigationHigh-Tech Employees "No Poach" Antitrust Litigation
High-Tech Employees "No Poach" Antitrust Litigation
 
How Apple Sidesteps Billions in Taxes
How Apple Sidesteps Billions in TaxesHow Apple Sidesteps Billions in Taxes
How Apple Sidesteps Billions in Taxes
 
Gleevec
GleevecGleevec
Gleevec
 

Recently uploaded

How to Make a Pirate ship Primary Education.pptx
How to Make a Pirate ship Primary Education.pptxHow to Make a Pirate ship Primary Education.pptx
How to Make a Pirate ship Primary Education.pptxmanuelaromero2013
 
Meghan Sutherland In Media Res Media Component
Meghan Sutherland In Media Res Media ComponentMeghan Sutherland In Media Res Media Component
Meghan Sutherland In Media Res Media ComponentInMediaRes1
 
POINT- BIOCHEMISTRY SEM 2 ENZYMES UNIT 5.pptx
POINT- BIOCHEMISTRY SEM 2 ENZYMES UNIT 5.pptxPOINT- BIOCHEMISTRY SEM 2 ENZYMES UNIT 5.pptx
POINT- BIOCHEMISTRY SEM 2 ENZYMES UNIT 5.pptxSayali Powar
 
Hierarchy of management that covers different levels of management
Hierarchy of management that covers different levels of managementHierarchy of management that covers different levels of management
Hierarchy of management that covers different levels of managementmkooblal
 
Capitol Tech U Doctoral Presentation - April 2024.pptx
Capitol Tech U Doctoral Presentation - April 2024.pptxCapitol Tech U Doctoral Presentation - April 2024.pptx
Capitol Tech U Doctoral Presentation - April 2024.pptxCapitolTechU
 
“Oh GOSH! Reflecting on Hackteria's Collaborative Practices in a Global Do-It...
“Oh GOSH! Reflecting on Hackteria's Collaborative Practices in a Global Do-It...“Oh GOSH! Reflecting on Hackteria's Collaborative Practices in a Global Do-It...
“Oh GOSH! Reflecting on Hackteria's Collaborative Practices in a Global Do-It...Marc Dusseiller Dusjagr
 
ESSENTIAL of (CS/IT/IS) class 06 (database)
ESSENTIAL of (CS/IT/IS) class 06 (database)ESSENTIAL of (CS/IT/IS) class 06 (database)
ESSENTIAL of (CS/IT/IS) class 06 (database)Dr. Mazin Mohamed alkathiri
 
Crayon Activity Handout For the Crayon A
Crayon Activity Handout For the Crayon ACrayon Activity Handout For the Crayon A
Crayon Activity Handout For the Crayon AUnboundStockton
 
Proudly South Africa powerpoint Thorisha.pptx
Proudly South Africa powerpoint Thorisha.pptxProudly South Africa powerpoint Thorisha.pptx
Proudly South Africa powerpoint Thorisha.pptxthorishapillay1
 
Full Stack Web Development Course for Beginners
Full Stack Web Development Course  for BeginnersFull Stack Web Development Course  for Beginners
Full Stack Web Development Course for BeginnersSabitha Banu
 
18-04-UA_REPORT_MEDIALITERAСY_INDEX-DM_23-1-final-eng.pdf
18-04-UA_REPORT_MEDIALITERAСY_INDEX-DM_23-1-final-eng.pdf18-04-UA_REPORT_MEDIALITERAСY_INDEX-DM_23-1-final-eng.pdf
18-04-UA_REPORT_MEDIALITERAСY_INDEX-DM_23-1-final-eng.pdfssuser54595a
 
Incoming and Outgoing Shipments in 1 STEP Using Odoo 17
Incoming and Outgoing Shipments in 1 STEP Using Odoo 17Incoming and Outgoing Shipments in 1 STEP Using Odoo 17
Incoming and Outgoing Shipments in 1 STEP Using Odoo 17Celine George
 
Final demo Grade 9 for demo Plan dessert.pptx
Final demo Grade 9 for demo Plan dessert.pptxFinal demo Grade 9 for demo Plan dessert.pptx
Final demo Grade 9 for demo Plan dessert.pptxAvyJaneVismanos
 
EPANDING THE CONTENT OF AN OUTLINE using notes.pptx
EPANDING THE CONTENT OF AN OUTLINE using notes.pptxEPANDING THE CONTENT OF AN OUTLINE using notes.pptx
EPANDING THE CONTENT OF AN OUTLINE using notes.pptxRaymartEstabillo3
 
Enzyme, Pharmaceutical Aids, Miscellaneous Last Part of Chapter no 5th.pdf
Enzyme, Pharmaceutical Aids, Miscellaneous Last Part of Chapter no 5th.pdfEnzyme, Pharmaceutical Aids, Miscellaneous Last Part of Chapter no 5th.pdf
Enzyme, Pharmaceutical Aids, Miscellaneous Last Part of Chapter no 5th.pdfSumit Tiwari
 
KSHARA STURA .pptx---KSHARA KARMA THERAPY (CAUSTIC THERAPY)————IMP.OF KSHARA ...
KSHARA STURA .pptx---KSHARA KARMA THERAPY (CAUSTIC THERAPY)————IMP.OF KSHARA ...KSHARA STURA .pptx---KSHARA KARMA THERAPY (CAUSTIC THERAPY)————IMP.OF KSHARA ...
KSHARA STURA .pptx---KSHARA KARMA THERAPY (CAUSTIC THERAPY)————IMP.OF KSHARA ...M56BOOKSTORE PRODUCT/SERVICE
 
Historical philosophical, theoretical, and legal foundations of special and i...
Historical philosophical, theoretical, and legal foundations of special and i...Historical philosophical, theoretical, and legal foundations of special and i...
Historical philosophical, theoretical, and legal foundations of special and i...jaredbarbolino94
 
Software Engineering Methodologies (overview)
Software Engineering Methodologies (overview)Software Engineering Methodologies (overview)
Software Engineering Methodologies (overview)eniolaolutunde
 

Recently uploaded (20)

How to Make a Pirate ship Primary Education.pptx
How to Make a Pirate ship Primary Education.pptxHow to Make a Pirate ship Primary Education.pptx
How to Make a Pirate ship Primary Education.pptx
 
Meghan Sutherland In Media Res Media Component
Meghan Sutherland In Media Res Media ComponentMeghan Sutherland In Media Res Media Component
Meghan Sutherland In Media Res Media Component
 
POINT- BIOCHEMISTRY SEM 2 ENZYMES UNIT 5.pptx
POINT- BIOCHEMISTRY SEM 2 ENZYMES UNIT 5.pptxPOINT- BIOCHEMISTRY SEM 2 ENZYMES UNIT 5.pptx
POINT- BIOCHEMISTRY SEM 2 ENZYMES UNIT 5.pptx
 
Hierarchy of management that covers different levels of management
Hierarchy of management that covers different levels of managementHierarchy of management that covers different levels of management
Hierarchy of management that covers different levels of management
 
Capitol Tech U Doctoral Presentation - April 2024.pptx
Capitol Tech U Doctoral Presentation - April 2024.pptxCapitol Tech U Doctoral Presentation - April 2024.pptx
Capitol Tech U Doctoral Presentation - April 2024.pptx
 
“Oh GOSH! Reflecting on Hackteria's Collaborative Practices in a Global Do-It...
“Oh GOSH! Reflecting on Hackteria's Collaborative Practices in a Global Do-It...“Oh GOSH! Reflecting on Hackteria's Collaborative Practices in a Global Do-It...
“Oh GOSH! Reflecting on Hackteria's Collaborative Practices in a Global Do-It...
 
ESSENTIAL of (CS/IT/IS) class 06 (database)
ESSENTIAL of (CS/IT/IS) class 06 (database)ESSENTIAL of (CS/IT/IS) class 06 (database)
ESSENTIAL of (CS/IT/IS) class 06 (database)
 
Crayon Activity Handout For the Crayon A
Crayon Activity Handout For the Crayon ACrayon Activity Handout For the Crayon A
Crayon Activity Handout For the Crayon A
 
Proudly South Africa powerpoint Thorisha.pptx
Proudly South Africa powerpoint Thorisha.pptxProudly South Africa powerpoint Thorisha.pptx
Proudly South Africa powerpoint Thorisha.pptx
 
Full Stack Web Development Course for Beginners
Full Stack Web Development Course  for BeginnersFull Stack Web Development Course  for Beginners
Full Stack Web Development Course for Beginners
 
Model Call Girl in Tilak Nagar Delhi reach out to us at 🔝9953056974🔝
Model Call Girl in Tilak Nagar Delhi reach out to us at 🔝9953056974🔝Model Call Girl in Tilak Nagar Delhi reach out to us at 🔝9953056974🔝
Model Call Girl in Tilak Nagar Delhi reach out to us at 🔝9953056974🔝
 
18-04-UA_REPORT_MEDIALITERAСY_INDEX-DM_23-1-final-eng.pdf
18-04-UA_REPORT_MEDIALITERAСY_INDEX-DM_23-1-final-eng.pdf18-04-UA_REPORT_MEDIALITERAСY_INDEX-DM_23-1-final-eng.pdf
18-04-UA_REPORT_MEDIALITERAСY_INDEX-DM_23-1-final-eng.pdf
 
Incoming and Outgoing Shipments in 1 STEP Using Odoo 17
Incoming and Outgoing Shipments in 1 STEP Using Odoo 17Incoming and Outgoing Shipments in 1 STEP Using Odoo 17
Incoming and Outgoing Shipments in 1 STEP Using Odoo 17
 
Final demo Grade 9 for demo Plan dessert.pptx
Final demo Grade 9 for demo Plan dessert.pptxFinal demo Grade 9 for demo Plan dessert.pptx
Final demo Grade 9 for demo Plan dessert.pptx
 
TataKelola dan KamSiber Kecerdasan Buatan v022.pdf
TataKelola dan KamSiber Kecerdasan Buatan v022.pdfTataKelola dan KamSiber Kecerdasan Buatan v022.pdf
TataKelola dan KamSiber Kecerdasan Buatan v022.pdf
 
EPANDING THE CONTENT OF AN OUTLINE using notes.pptx
EPANDING THE CONTENT OF AN OUTLINE using notes.pptxEPANDING THE CONTENT OF AN OUTLINE using notes.pptx
EPANDING THE CONTENT OF AN OUTLINE using notes.pptx
 
Enzyme, Pharmaceutical Aids, Miscellaneous Last Part of Chapter no 5th.pdf
Enzyme, Pharmaceutical Aids, Miscellaneous Last Part of Chapter no 5th.pdfEnzyme, Pharmaceutical Aids, Miscellaneous Last Part of Chapter no 5th.pdf
Enzyme, Pharmaceutical Aids, Miscellaneous Last Part of Chapter no 5th.pdf
 
KSHARA STURA .pptx---KSHARA KARMA THERAPY (CAUSTIC THERAPY)————IMP.OF KSHARA ...
KSHARA STURA .pptx---KSHARA KARMA THERAPY (CAUSTIC THERAPY)————IMP.OF KSHARA ...KSHARA STURA .pptx---KSHARA KARMA THERAPY (CAUSTIC THERAPY)————IMP.OF KSHARA ...
KSHARA STURA .pptx---KSHARA KARMA THERAPY (CAUSTIC THERAPY)————IMP.OF KSHARA ...
 
Historical philosophical, theoretical, and legal foundations of special and i...
Historical philosophical, theoretical, and legal foundations of special and i...Historical philosophical, theoretical, and legal foundations of special and i...
Historical philosophical, theoretical, and legal foundations of special and i...
 
Software Engineering Methodologies (overview)
Software Engineering Methodologies (overview)Software Engineering Methodologies (overview)
Software Engineering Methodologies (overview)
 

Do School Districts Matter?

  • 1. DO SCHOOL DISTRICTS MATTER? Reuters Grover J. “Russ” Whitehurst, Matthew M. Chingos, and Michael R. Gallaher March 2013
  • 2. Do School Districts Matter? 1 E X E C U T I V E S U M M A R Y chool districts occupy center stage in education reform in the U.S. They manage nearly all public funding and are frequently the locus of federal and state reform initiatives, e.g., instituting meaningful teacher evaluation systems. The most charismatic leaders over the last decade, people such as Michelle Rhee and Joel Klein, have received considerable national media attention. Financial compensation for district leaders is high, with many being paid more than the chief state school officers who oversee the entire systems in which they serve. Some private philanthropies pour money into initiatives to improve district performance. Others invest in ways that suggest that they too think districts are important but as impediments to rather than instruments of reform. Despite the centrality of school districts in all the ways described, we know very little from existing research about how important they are to student achievement relative to other institutional components for delivering education services, including teachers and schools. Neither do we have information on the size of the differences in effectiveness among districts or whether there are districts that show exceptional patterns of performance across time, e.g., moving from low to high performing. We begin to fill these information gaps in the present report by analyzing 10 years of data involving all public school students and school districts in Florida and North Carolina. We find that school districts account for only a small portion (1% to 2%) of the total variation in student achievement relative to the contribution of schools, teachers, demographic characteristics of students, and remaining individual differences among students. Within just the institutional components affecting student achievement, the effect of schools is about twice that of districts whereas the effect of teachers is about seven times larger than that of districts. Even though district effects are only a small piece of the pie that represents all the influences on student achievement, there are still differences among the academic achievement of demographically similar S Grover J. Whitehurst is a senior fellow in Governance Studies and director of the Brown Center on Education Policy at the Brookings Institution. Matthew M. Chingos is a fellow in the Brown Center on Education Policy at the Brookings Institution. Michael R. Gallaher is a research analyst in the Brown Center on Education Policy at the Brookings Institution.
  • 3. Do School Districts Matter? 2 students in higher and lower performing districts in North Carolina and Florida that are large enough to be of practical and policy significance. Combining the data from both states, 4th and 5th grade students in a district that is at the 70th percentile in district effectiveness are more than 9 weeks ahead of similar students in a district at the 30th percentile of effectiveness in their learning of reading and math. There are also districts that have displayed exceptional patterns of performance in terms of student achievement over the last decade, including districts that beat their demographic odds every year, districts that consistently underperformed, districts that had nose-dive declines, and districts that experienced transformative growth. These findings provide an empirical justification for efforts to improve student achievement through district- level reforms and should be a tantalizing fruit for those who want to better understand why some districts are better than others and translate that knowledge into action.
  • 4. Do School Districts Matter? 3 Do School Districts Matter? Introduction School districts occupy center stage in education policy The roughly 14,000 regular school districts in the U.S. occupy a central position in the policy and practice of education reform. The evidence for this assertion is multifaceted. If, for instance, we follow the money we find that school districts are the accountable agents for nearly all of the roughly $500 billion annual public investment in elementary and secondary education through federal, state, and local tax revenues. Many of the most popular and aggressively promoted school reform efforts of federal and state governments are focused on school districts. Performance-based teacher evaluation is a case in point. The Obama administration’s Race-to-the-Top competition and NCLB state waivers both required states to commit to plans under which individual school districts would adopt teacher evaluation systems that produce meaningful differentiation of teachers, based in part on differences among teachers in the ability to raise student test scores. In carrying out this agreement with the federal government, states have provided some broad guidelines to districts in how to design their evaluation systems, but most of the details are left up to individual districts to work out. The central role of individual school districts is also implied by the media attention that has been given to prominent school superintendents such as Michelle Rhee in Washington, D.C. and Joel Klein in New York City. Rhee, for example, was on the cover of Time Magazine in 2008 with the lead, “Michelle Rhee … head of the D.C. public schools … could transform public education.” The pay scale for superintendents also indicates their perceived importance. In New York State, for example, 63 district leaders each received over $300,000 in salary and benefits for the 2011-12 school year, with the superintendent at the top of the list receiving a salary and benefits package of $541,000.1 Compensation packages for district Many of the most popular and aggressively promoted school reform efforts of federal and state governments are focused on school districts.
  • 5. Do School Districts Matter? 4 superintendents are typically much higher than for state-level education officials. To continue with the example of New York, the state commissioner of education receives a salary of $212,500, which is substantially less than the salary of many local school district superintendents in the state system he oversees. Private philanthropy has invested heavily in district-level reforms on the premise that districts are powerful agents for change. One of those philanthropies, the Eli and Edythe Broad Foundation, has led the way in initiatives that are predicated on the importance of school districts. For instance, their annual Broad Prize for Education bestows $1 million on the urban school district that in their judgment has shown the best performance and improvement. Other reform initiatives are focused at the district level in the interesting sense that they are premised on the assumption that traditional school districts are the problem rather than the solution. Thus advocates for charter schools, vouchers, inter-district choice, on-line education, and school portfolio management are making a statement about the importance of traditional school districts by insisting that they offer a better alternative. What do we know about the impact of school districts on student achievement? When we turn from policies that assume the importance of school districts to empirical evidence on their impact, we move from a rich to a sparse landscape. Little is known about the impact of school districts on student achievement. And what seems to be known from an earlier generation of education research rests on a highly questionable set of methods. A typical study of the importance of school districts conducted 15 years ago would be based on correlations between answers to survey questions by district superintendents and district-level student achievement. The finding, for example, that a combination of answers to questions about leadership style by district superintendents is associated with differences in student achievement scores would be taken as
  • 6. Do School Districts Matter? 5 evidence that the leadership style of district leaders is causally related to student outcomes. Of course, correlation is not causation. By and large the existing studies on school district effects draw conclusions that could be due to differences among districts in the characteristics of the students and families served or other economic and social factors having little to do with school districts themselves. New analyses of district effects on student achievement We address the influence of school districts on student achievement with new data and analyses, taking up four questions: First: What is the influence of school districts on student achievement relative to the influence of schools, teachers, and individual differences among students? We want to know the size of the school district slice of the pie that represents the total variation in student achievement. The answer to this question may have considerable relevance for public policy. If, for example, student outcomes vary considerably in association with the classroom/teacher to which students are assigned but very little based on the district in which students are schooled, it would suggest that federal or state policies directed at improvements in the quality of the teacher workforce might pay greater dividends than policies directed at improving the quality of district leaders or district management practices. Assuming the district slice of the achievement pie is substantively greater than zero: Are there differences among districts in their contribution to student achievement that are large enough to be relevant for policy? If the answer to our first question is that districts account for a small but statistically significant amount of variation in student achievement, this implies that there are differences among districts that have an impact on student outcomes. However, it does not tell us whether the differences are large enough to be the focus of public policy. If, for example, the difference in student performance in districts in the upper vs. the lower tail of the state distribution of district performance were equivalent to a difference in schooling of a few days in a school year, policymakers might be wise to hesitate before investing significant resources to try to close the We want to know the size of the school district slice of the pie that represents the total variation in student achievement.
  • 7. Do School Districts Matter? 6 district performance gap. In contrast, gaps in student achievement attributable to differences in school districts equivalent to several weeks of schooling might well be worth addressing by policies intended to strengthen lower performing districts. Can districts be categorized based on patterns of influence on student academic achievement in ways that would inform efforts to improve district performance? This question presumes that we answer the first two questions in the affirmative, i.e., districts have statistically significant impacts on student achievement that are large enough to be of practical importance. Establishing policies intended to strengthen district performance requires predictability in the performance of districts over time in exactly the same way that building human resource policies around teacher evaluation data requires that teacher evaluation scores in one year predict their performance in subsequent years. In other words, one year of data won’t do. Neither will multiple years of data that demonstrate a lack of predictability from year to year in terms of which districts are doing well and which are not. Ideally, we would want to be able to identify some districts as consistently high performers over time and others as the opposite, while yet other districts could be categorized as gainers or decliners. Being able to address our fourth question (What are the distinctive features of exceptional districts?) depends on our ability to identify consistent patterns of district performance over time. If such distinctive patterns exist, we can ask, for example, whether higher performing districts are distinguishable from lower performing districts by characteristics of their superintendents, by the consistency of the performance of their schools, by their per-pupil expenditures, and so forth. And we can search for changes in policy and practice that are associated with districts showing gains and districts showing declines. We will address the fourth question in a subsequent report. Two caveats are in order before we present our findings and policy conclusions. First, we will frequently use terminology that suggests causal effects because alternate phrasing would be convoluted. However, our Ideally, we would want to be able to identify some districts as consistently high performers over time and others as the opposite.
  • 8. Do School Districts Matter? 7 methods are observational and do not support causal conclusions. When we write, for example, about “gaps in student achievement attributable to school districts” we might more accurately write about “associations among student test scores and the districts in which students are educated that remain after accounting for variation in student achievement within districts that is associated with teachers and schools, and with the inclusion of statistical controls for demographic characteristics of students.” The second caveat is that our approach can only identify possible district effects that result from differences among districts in their practices. We cannot identify district effects that result from practices that are common to all districts. For example, suppose that school districts have a positive impact on student outcomes by relieving those closer to instructional interactions, such as building principals, from tasks, such as handling staff payrolls and bus transportation, that take time away from instructionally relevant activities. This kind of effect would not appear in our analyses because all districts provide these services and thus all would improve student achievement by so doing. Note, however, that this model of why school districts might be important—to let educators at the building level focus on education—is very different from a model in which districts compete for great leaders to drive education reform and enhance student achievement. Methods We use K-12 student-level administrative data from the states of Florida and North Carolina spanning the decade from 2000-2001 to 2009- 2010. Every student in both states who was in grades 4 and 5 in this decade and participated in the state assessments of reading or mathematics is represented in our data, as are the classrooms, schools, and districts those students attended. There are roughly a half million student observations for each year of data (200,000 for NC and 300,000 for FL), which leads to about 5 million student data points in our dataset for the decade.
  • 9. Do School Districts Matter? 8 We measure how much student achievement varies across districts in the context of variation in student achievement at the school, classroom, and student levels. We conduct our most intensive analysis with one year of data from the 2009-10 school year. We extend our analysis across the decade of data to identify individual districts that show exceptional patterns of association with student achievement. Our analyses are multi- level, using a technique called Hierarchical Linear Modeling, or HLM. The use of HLM allows us to simultaneously consider differences at the student, classroom, school, and district levels that take into account the lack of independence in the observations within these levels. Our analytic approach employs a rich set of demographic data to account for differences among classrooms, schools, and districts that arise because students go to the schools that are close to their place of residence, and residential neighborhoods vary substantially within and between districts in their demographics. To the extent that we have valid measures of demographic differences and control statistically for their uneven distribution across districts, schools, and classrooms, the more assurance we have that any differences that remain are due to the impact of teachers, schools, and districts on student achievement. Our analyses include controls for student age, race/ethnicity, cognitive disability status, free and reduced lunch program status (FRPL), limited English proficiency status, and, for Florida only, whether the parent/student are native English speakers and whether the student was born in the U.S.2 We limit our analyses to reading and math scores on the state assessments for students in grades 4-5 because students in these grades are nearly always in a single classroom for which classroom effects can be estimated whereas students in later grades are in multiple classrooms and students in earlier grades do not have the requisite achievement test results. Being able to estimate teacher effects is important to our goal of comparing the contribution of districts to student achievement relative to the contribution of schools and classrooms.3 Our analytic approach employs a rich set of demographic data to account for differences among classrooms, schools, and districts.
  • 10. Do School Districts Matter? 9 The methodology we employ is described in greater detail in a technical paper that accompanies this report, titled “School Districts and Student Achievement.” Findings Q1: What is the influence of school districts on student achievement relative to the influence of schools, teachers, and individual differences among students? The short answer to the question is: Not much. Figure 1 displays a summary of the variance decomposition results from Florida and North Carolina. The summary represents the mean values from separate analyses for each state of reading and mathematics achievement scores in grades 4 and 5 for the 2009-2010 academic year. Figure 1: Variance in Student Achievement Associated with Differences Among Teachers/Classrooms, Schools, Districts, and Students As indicated in the figure, only about 1% of the differences in student achievement (i.e., the variance) is located at the school district level. Student level differences, which represent everything including measurement error that is not accounted for by teachers, schools, districts, and demographic controls, account for 59% of the variability. The demographic controls account for another 31%. This leaves about 10% of the total variance to divide among the institutional components: teachers,
  • 11. Do School Districts Matter? 10 schools, and districts. Teachers get the bulk of this, followed by schools, and then districts. The variance decomposition represented in Figure 1 differs somewhat by state and by subject matter. The strongest result for the district component occurs for mathematics in North Carolina where the district contribution rises to about 2%. Q2: Are there differences among districts in their contribution to student achievement that are large enough to be relevant for policy? It may appear from the variance decomposition represented in Figure 1 that school districts have such a small role to play in affecting student achievement that districts should be ignored by education reformers. Clearly the differences between districts that influence student achievement are smaller than differences between teachers and schools within districts that affect student achievement, whereas all three of these institutional components are swamped by differences among students and demographics. But consider the 6.7% contribution by teachers that is pictured in Figure 1. That too seems small when compared to the 90% of variance that is controlled by demographic covariates and differences among students within classrooms. However, we know from a large body of econometric research that a standard deviation in teacher effectiveness, e.g., the difference between teachers who are roughly at the 30th vs. the 70th percentiles of teacher performance, is associated with between 0.10 and 0.25 student-level standard deviations on academic tests.4 In our data, a standard deviation in teacher effectiveness is associated with 0.16 student standard deviations. This is equivalent to 36% of a school year.5 In other words, a student with a teacher at the 69th percentile of effectiveness (0.50 standard deviations above the mean for all teachers) would experience the equivalent of 13 more weeks of school in a single year compared to a student with a teacher at the 31st percentile of effectiveness (0.50 standard deviations below the mean).6 Of course, differences in teachers more extreme than 1 standard deviation would have even larger impacts. Thus, District level differences account for about 1% of the variability in student achievement.
  • 12. Do School Districts Matter? 11 a variable that accounts for a relatively small piece of the total student achievement pie can still be important. Figure 2: Estimates of Effects on Student Achievement of Individual School Districts in North Carolina Figures 2 and 3 suggest that at least at the extremes there are school districts in both Florida and North Carolina that have impacts on student achievement that are important to understand and incorporate into policies and practices that are intended to enhance student achievement. Each data point in Figures 2 and 3 represents an estimate of the impact of a single school district in the state on math scores in 2009-10 using the same model and data that generated the results depicted in Figure 1. The error bars around each data point represent the 95% confidence limits for that district’s estimate. Recall that the model we employ is multi-level and includes a rich set of demographic controls. Thus estimates for individual districts control for differences in students across districts.
  • 13. Do School Districts Matter? 12 Figure 3: Estimates of Effects on Student Achievement of Individual School Districts in Florida There are several notable findings. First, there are a number of districts in both states that perform at levels that are above or below the average for districts in the state by a statistically significant margin. In Florida, 10% of districts are statistically above average and 7% are statistically below average. The comparable numbers in North Carolina are 10% above and 14% below. This means there are districts that are over- or under-performing on student achievement relative to what might be expected of them given the characteristics of their students: they add or subtract value. Second, the difference in performance between districts is quite large at the extremes: 0.30 student standard deviations separate the highest and lowest performing district in the Florida data whereas the difference is 0.42 standard deviations for North Carolina. Normatively a year’s growth in math performance for students in 4th and 5th grades is approximately 0.50 standard deviations. This means that the average 4th and 5th grader in the top-performing district in Florida in 2009-2010 was
  • 14. Do School Districts Matter? 13 60% of a school year ahead of the average 4th and 5th grader in the lowest performing district in Florida, controlling for other factors that could impact student achievement included in our model. The comparable difference in North Carolina was even larger, at over 80% of a school year. Of course, comparison of the two districts that differ the most in the overall distribution of performance can generate a misleading guide to the potential for improving district performance because any policies intended to raise student performance in the state by improving the performance of less effective districts would have to involve many districts, not just the one that happens to be the low performer in a given year. Further, the two districts that happen to be the lowest and highest performers in a given year can hold these ranks due to chance (values in the tails of a distribution are much less stable than values closer to the mean). A more realistic view of the practical importance of district differences comes from looking at district effects in exactly the same way that we described teacher effects. We described a standard deviation of teacher effectiveness as associated with 0.16 standard deviations of difference in student achievement averaged across reading and math, which corresponds to about 13 weeks of additional learning for a student with a teacher 0.50 standard deviations above the mean of teachers compared to a student with a teacher 0.50 standard deviations below the mean for teachers. The corresponding relationship for districts is that a one standard deviation difference in district effectiveness equals 0.11 standard deviations in student achievement. This means that a student in a district 0.50 standard deviations above the average of all districts would experience the equivalent of roughly 9 more weeks of learning time by the end of 4th and 5th grade compared to a student in a district 0.50 standard deviations below the average of all districts. This is about a quarter of a school year. We suggest that a variable that can potentially increase education productivity by 25% is important.7 The relationship between the magnitude of district, school, and teacher effects on student achievement is seen in Figure 4. In Florida, 10% of districts are statistically above average and 7% are statistically below average.
  • 15. Do School Districts Matter? 14 Figure 4: Comparison of One Standard Deviation of Teacher/Classroom, School, and District Differences on Student Achievement* (* 0.10 student standard deviations = roughly 25% of a school year of learning) Q3: Can districts be categorized based on patterns of influence on student academic achievement in ways that would inform efforts to improve district performance? We have heretofore presented findings from one school year (2009- 2010) that indicate that even though districts account for only a small fraction of the overall variance in student achievement on state tests, there are nonetheless differences among districts in their performance that suggest the importance of improving district policies and practice. But district reform is nearly always a multi-year endeavor that would need to be informed by more than one year of data on student performance. A district targeted for improvement should be one that is chronically underperforming or is in decline. Similarly, a district to be singled out for its excellence and pointed to as a model for others to use for improvement should be one that is either persistently high performing or has shown a clear pattern of improvement. Are there such identifiable patterns of performance among school districts in Florida and North Carolina? Figure 5 displays data from four districts in North Carolina with exceptional patterns of performance over the decade from 2000-2001 to 2009-2010. The horizontal axis is the school year. The vertical axis displays the percentile score of each district for each year on math performance relative to other districts, with individual district effect sizes adjusted for demographic covariates and the multi-level nature of our analysis using the same model that generated the data in Figure 1. A district targeted for improvement should be one that is chronically underperforming or is in decline.
  • 16. Do School Districts Matter? 15 Figure 5: Four North Carolina School Districts with Distinctive Patterns of Student Achievement over a Decade Beaufort County is a consistently above average performer, with a mean at the 76th percentile over the decade, i.e., it was better than Âľ of the districts in the state on a covariate-adjusted basis. Pasquotank County is the mirror image of Beaufort, scoring at a consistently low level, with an average of the 14th percentile over the decade. Halifax County is a dramatic decliner, having moved from one of the top to one of the lowest performing districts in the state over the decade. In contrast, Edenton/Chowan is a notable gainer, having moved from the 18th to the 65th percentile in 10 years. These four districts are similar in most dimensions other than academic performance. For example, they are each districts in largely rural counties from the northeastern section of the state with relatively small student populations. They have high proportions of students eligible for free and reduced price lunch, high concentrations of minority students, and similar levels of per-pupil expenditure. Figure 6 presents data from four Florida districts that fall into the same pattern categories that we described for the North Carolina districts. Broward is a consistently high performer whereas Duval is the opposite. 0 10 20 30 40 50 60 70 80 90 100 2000 2001 2002 2003 2004 2005 2006 2007 2008 2009 PercentileofDistrictEffect School Year Beginning BEAUFORT COUNTY PASQUOTANK COUNTY HALIFAX COUNTY EDENTON/CHOWAN
  • 17. Do School Districts Matter? 16 Orange County is a notable gainer. In contrast, Collier has shown large declines. Figure 6: Four Florida School Districts with Distinctive Patterns of Student Achievement over a Decade There are some important caveats with respect to the school districts we have highlighted: First, they are exemplars of patterns of performance that are shown by many districts in each state. These particular districts from each state were chosen because they displayed one of the patterns of performance that are of interest to us and because they are grossly similar in the demographics of the student populations they serve. They were not chosen because they were the highest performing or lowest performing or showed the most improvement or the greatest declines. Second, our data are from 4th and 5th graders—patterns of district performance for these and other districts might well look different for other grades. Third, the data and graphs are based on performance that has been adjusted for the demographic covariates in our model. Thus the graphs might be thought of as representing the extent to which districts over- or under-performed each year relative to their demographic odds. The graphs do not represent district performance relative to an absolute standard such as the percentage of students meeting proficiency standards on state tests. For example, Beaufort 0 10 20 30 40 50 60 70 80 90 100 2000 2001 2002 2003 2004 2005 2006 2007 2008 2009 PercentileofDistrictEffect School Year Beginning COLLIER BROWARD ORANGE DUVAL
  • 18. Do School Districts Matter? 17 County, which averaged in the top quartile of North Carolina districts in our covariate-adjusted model, was slightly below average based on the raw scores of its 4th and 5th graders. Thus the district did very well relative to the rest of the state given its high minority, high poverty student population but many of its students did not reach proficiency standards on state tests and the majority of its schools failed to make adequate yearly progress under No Child Left Behind. Summary and conclusions Very little of the total variation in student achievement, only about 1% to 2%, lies at the level of the school district. Despite that, differences between school districts in effectiveness are large enough at the extremes to represent more than a half-year difference in schooling. In other words, if students educated in the least effective school district in North Carolina or Florida had been educated instead in the most effective district, the evidence suggests that their academic performance at the end of 4th and 5th grade would be higher by an amount equivalent to having attended school for at least a half-year more. Even the difference between a district that lies at the 31st percentile and one at the 69th percentile (a 1 standard deviation difference in district effectiveness) is equivalent to more than two months of schooling. These are differences that are large enough to warrant policy attention. Further, individual districts within the states of Florida and North Carolina display patterns of effectiveness over many years that cry out for explanation and understanding. Some districts show patterns of continuous improvement that move them from very low performing to substantially above average. Other districts show precipitous declines. Still other districts manage to beat their demographic odds year after year, whereas others are consistently low performers. If we found such differential patterns of effectiveness in the context of industrial production or sports team win/loss records or chain store sales or hospital readmission rates we would think that surely it would be possible to find out what accounts for them. And we would reasonably assume that Individual districts display patterns of effectiveness over many years that cry out for explanation and understanding.
  • 19. Do School Districts Matter? 18 knowledge of why one plant or team or store or hospital does better than others would lead to interventions that would successfully bring up the low performers. The same logic model applies to differences in the effectiveness of school districts. There is no reason to expect that a particular intervention intended to improve district level performance such as hiring a superstar superintendent or providing more autonomy to school leaders or changing teacher compensation packages would come close to achieving outcomes as large as the naturally occurring differences in district effectiveness found in our analysis. In that sense, our estimates are upper bounds on what might be expected from policies intended to improve lower performing districts. But our finding of large differences in performance over time between the upper and lower echelon districts as well as the existence of transformative districts that have shown substantial improvement or deterioration in their performance suggests a tantalizing fruit for education researchers and reformers.
  • 20. Do School Districts Matter? 19 Endnotes 1 New York State Education Department, Administrative Compensation Information for 2011- 2012 (New York City: New York State Education Department, 2011). http://www.p12.nysed.gov/mgtserv/admincomp/docs/2011- 12_AdminSalDisc_5_11_11_Post_r.xls 2 We do not use in the present report a student growth model that measures district effectiveness by the gains that students experience on state tests from one year to the next. It is possible and probably likely that districts that have an impact on student achievement do so in all or most grades. If we measured district effectiveness only by the gains generated for students between grades 4 and 5 we would penalize districts that impacted student outcomes in earlier grades. 3 We use a student growth model in a technical paper that accompanies this report and in future work on districts using the same dataset. We limit our analysis in the present report to 4th and 5th graders for whom the growth model can be calculated rather than also including 3rd graders in order to retain comparability with results from these other, related papers. 4 Thomas J, Kane, Eric S. Taylor, John H. Tyler, and Amy L. Wooten, Identifying Effective Classroom Practices Using Student Achievement Data, Working Paper 15803 (Cambridge: National Bureau of Economic Research, 2010). 5 This calculation is based on a normal year’s average growth in reading and math in grades 4 and 5 of 0.42 standard deviations, as reported in Carolyn J. Hill, Howard S. Bloom, Alison Rebeck Black, and Mark W. Lipsey, Empirical Benchmarks for Interpreting Effect Sizes in Research, MDRC Working Papers on Research Methodology (New York: MDRC, 2007). 6 This conversion is based on a 180-day school year, equivalent to 36 full weeks of instruction. 7 Teacher and district effects as we measure them accrue over different time spans. Teacher effects can be attributed to the teachers students experienced in grades 4 and 5. District effects, in contrast, are a result of school experiences that cumulate from kindergarten. This may make it seem that the district effects should be adjusted downward by dividing them by the years of schooling on which they are estimated if they are to be compared to teacher effects. However, whereas district effects represent the net boost to student achievement that result from going to school in a particular school district for a given number of years, teacher effects over the same time span within the same district would average zero unless there were improvements over time in the overall quality of the teacher workforce. This is because children on average would experience both good and bad teachers in equal numbers as they move through the grades with effects that would cancel out each other.
  • 21. Do School Districts Matter? 20 About the Brown Center on Education Policy Established in 1992, the Brown Center on Education Policy conducts research and provides policy recommendations on topics in American education. The Brown Center is part of The Brookings Institution, a private nonprofit organization devoted to independent research and innovative policy solutions. For more than 90 years, Brookings has analyzed current and emerging issues and produced new ideas that matter - for the nation and the world. Brown Center on Education Policy The Brookings Institution 1775 Massachusetts Ave. NW Washington DC, 20036 202.797.6090 202.797.6144 (f) http://www.brookings.edu/brown.aspx Email your comments to browncenter@brookings.edu The Brookings Institution is a private non-profit organization. Its mission is to conduct high- quality, independent research and, based on that research, to provide innovative, practical recommendations for policymakers and the public. The conclusions and recommendations of any Brookings publication are solely those of its author(s), and do not reflect the views of the Institution, its management, or its other scholars. Brookings recognizes that the value it provides is in its absolute commitment to quality, independence and impact. Activities supported by its donors reflect this commitment and the analysis and recommendations are not determined or influenced by any donation. Governance Studies The Brookings Institution 1775 Massachusetts Ave., NW Washington, DC 20036 Tel: 202.797.6090 Fax: 202.797.6144 www.brookings.edu/governance.aspx Editing, Production & Layout Ashley Inman