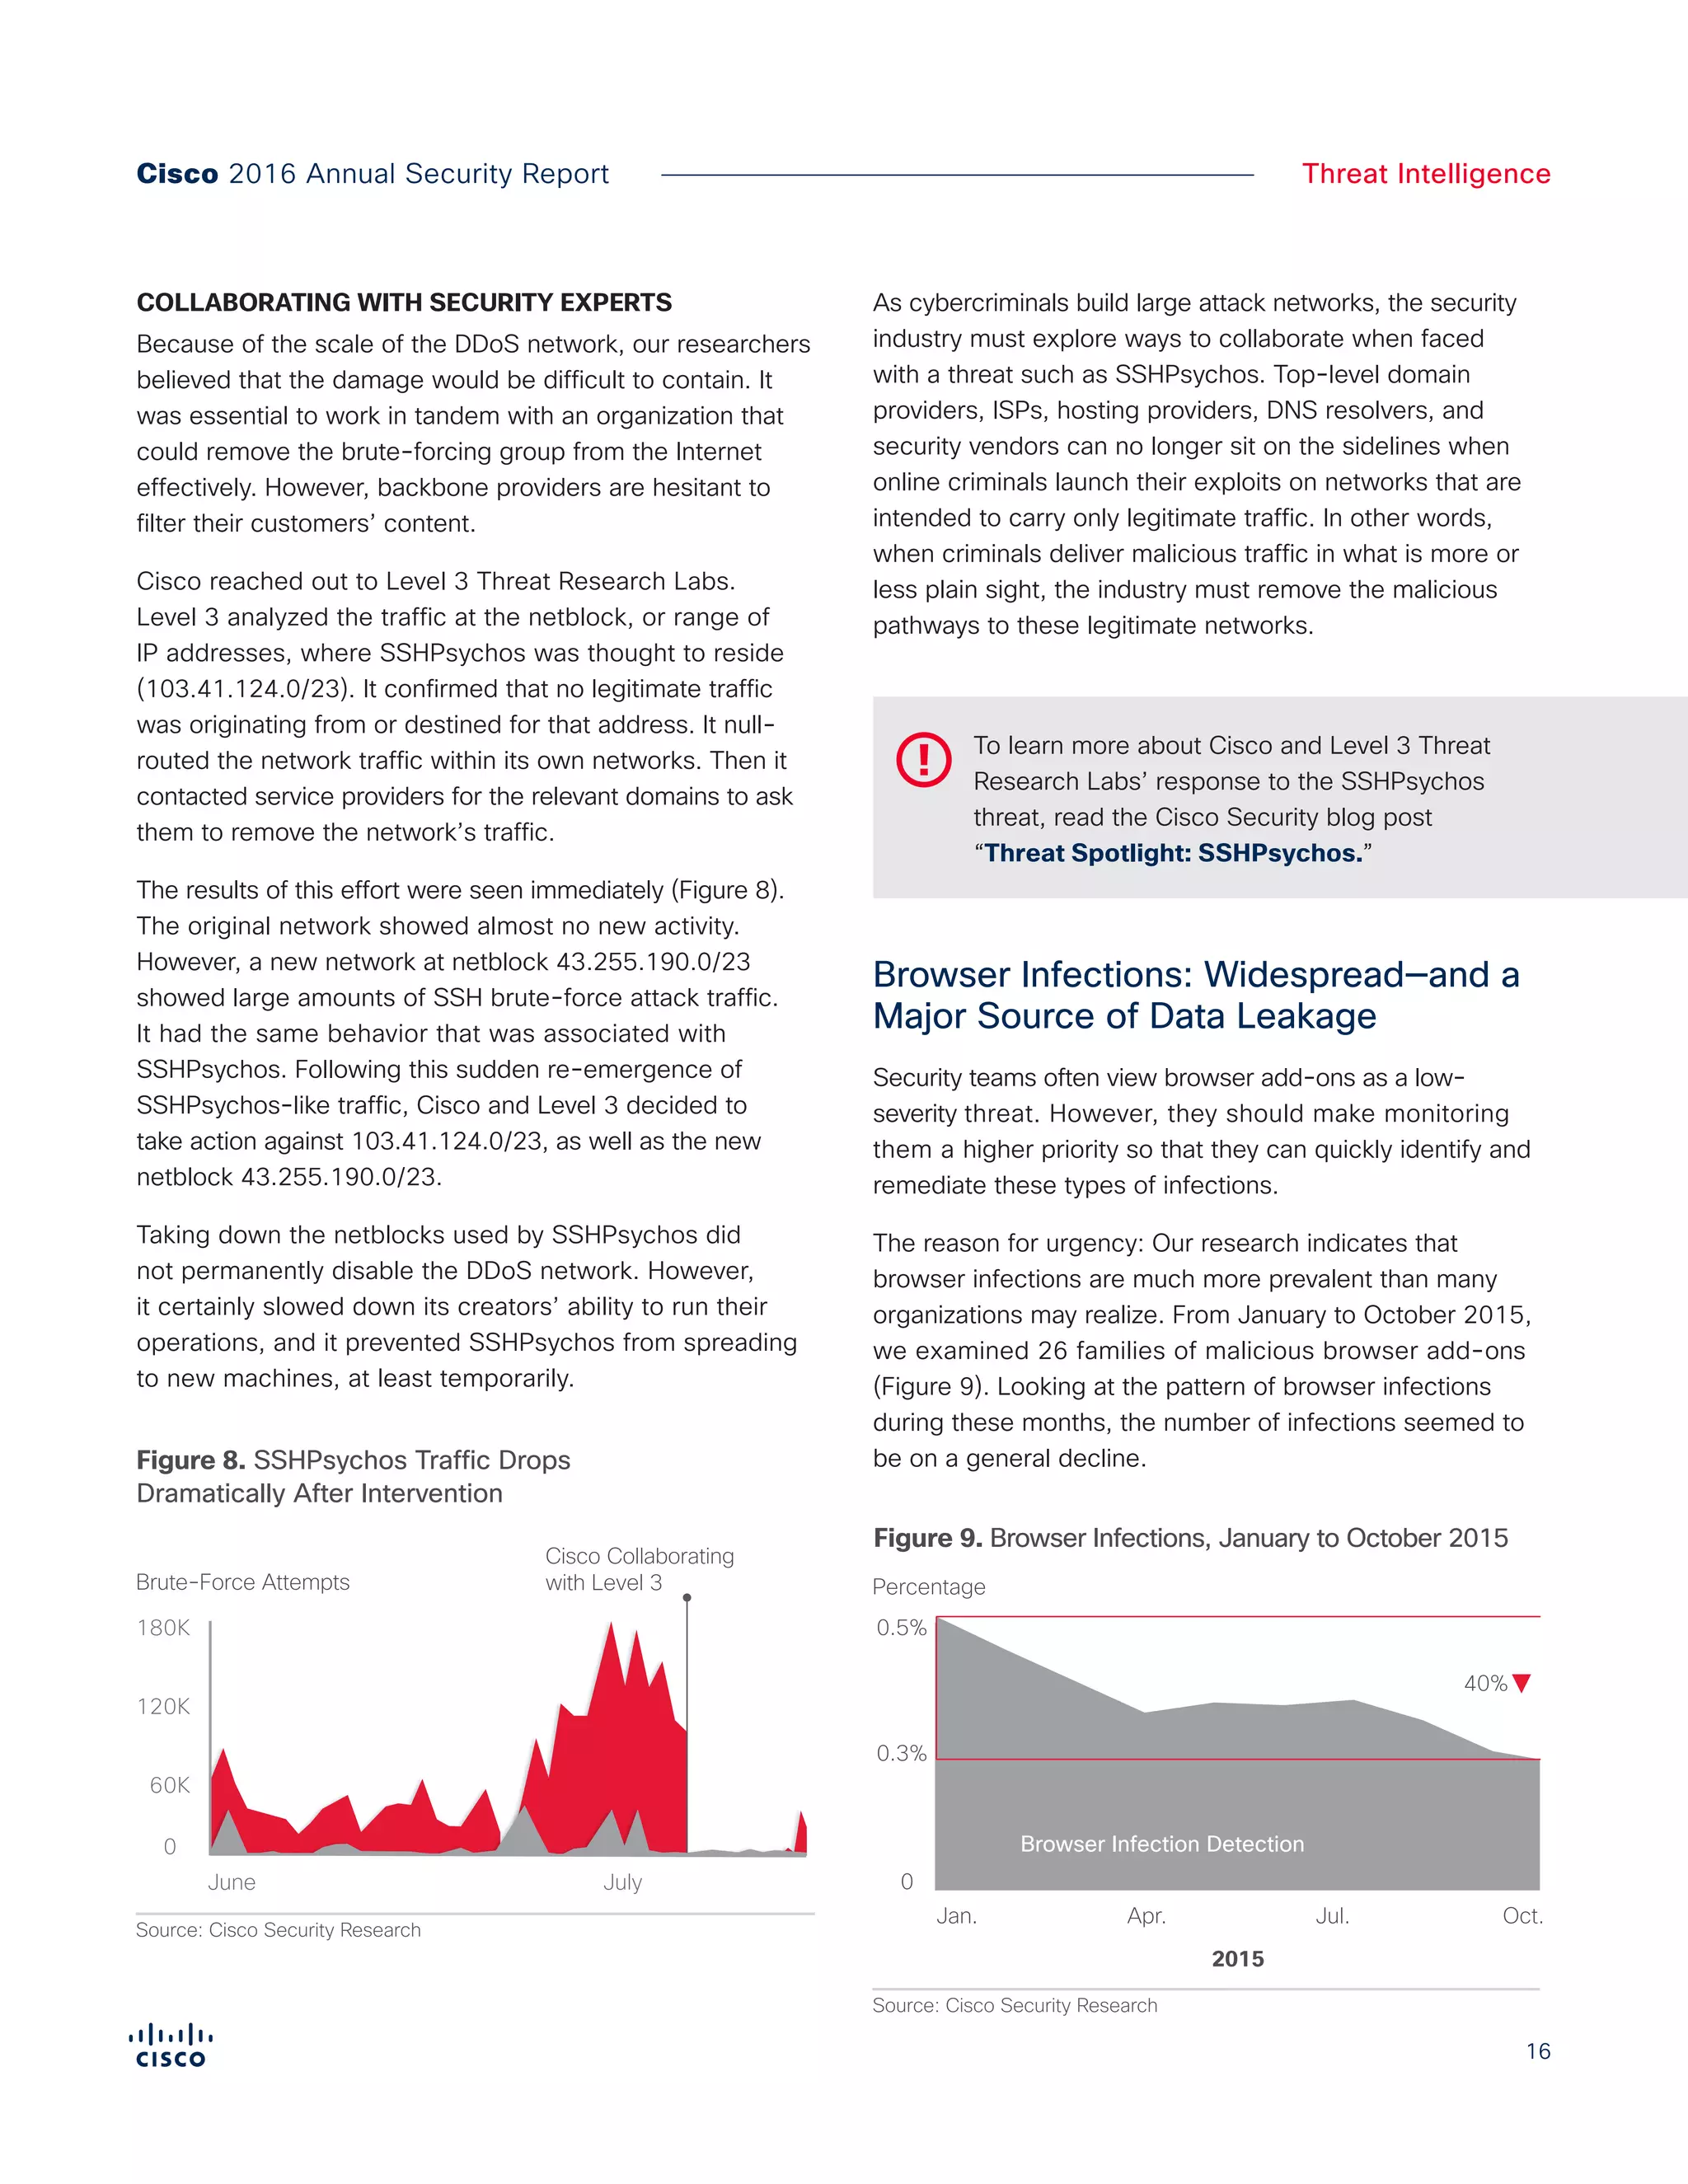
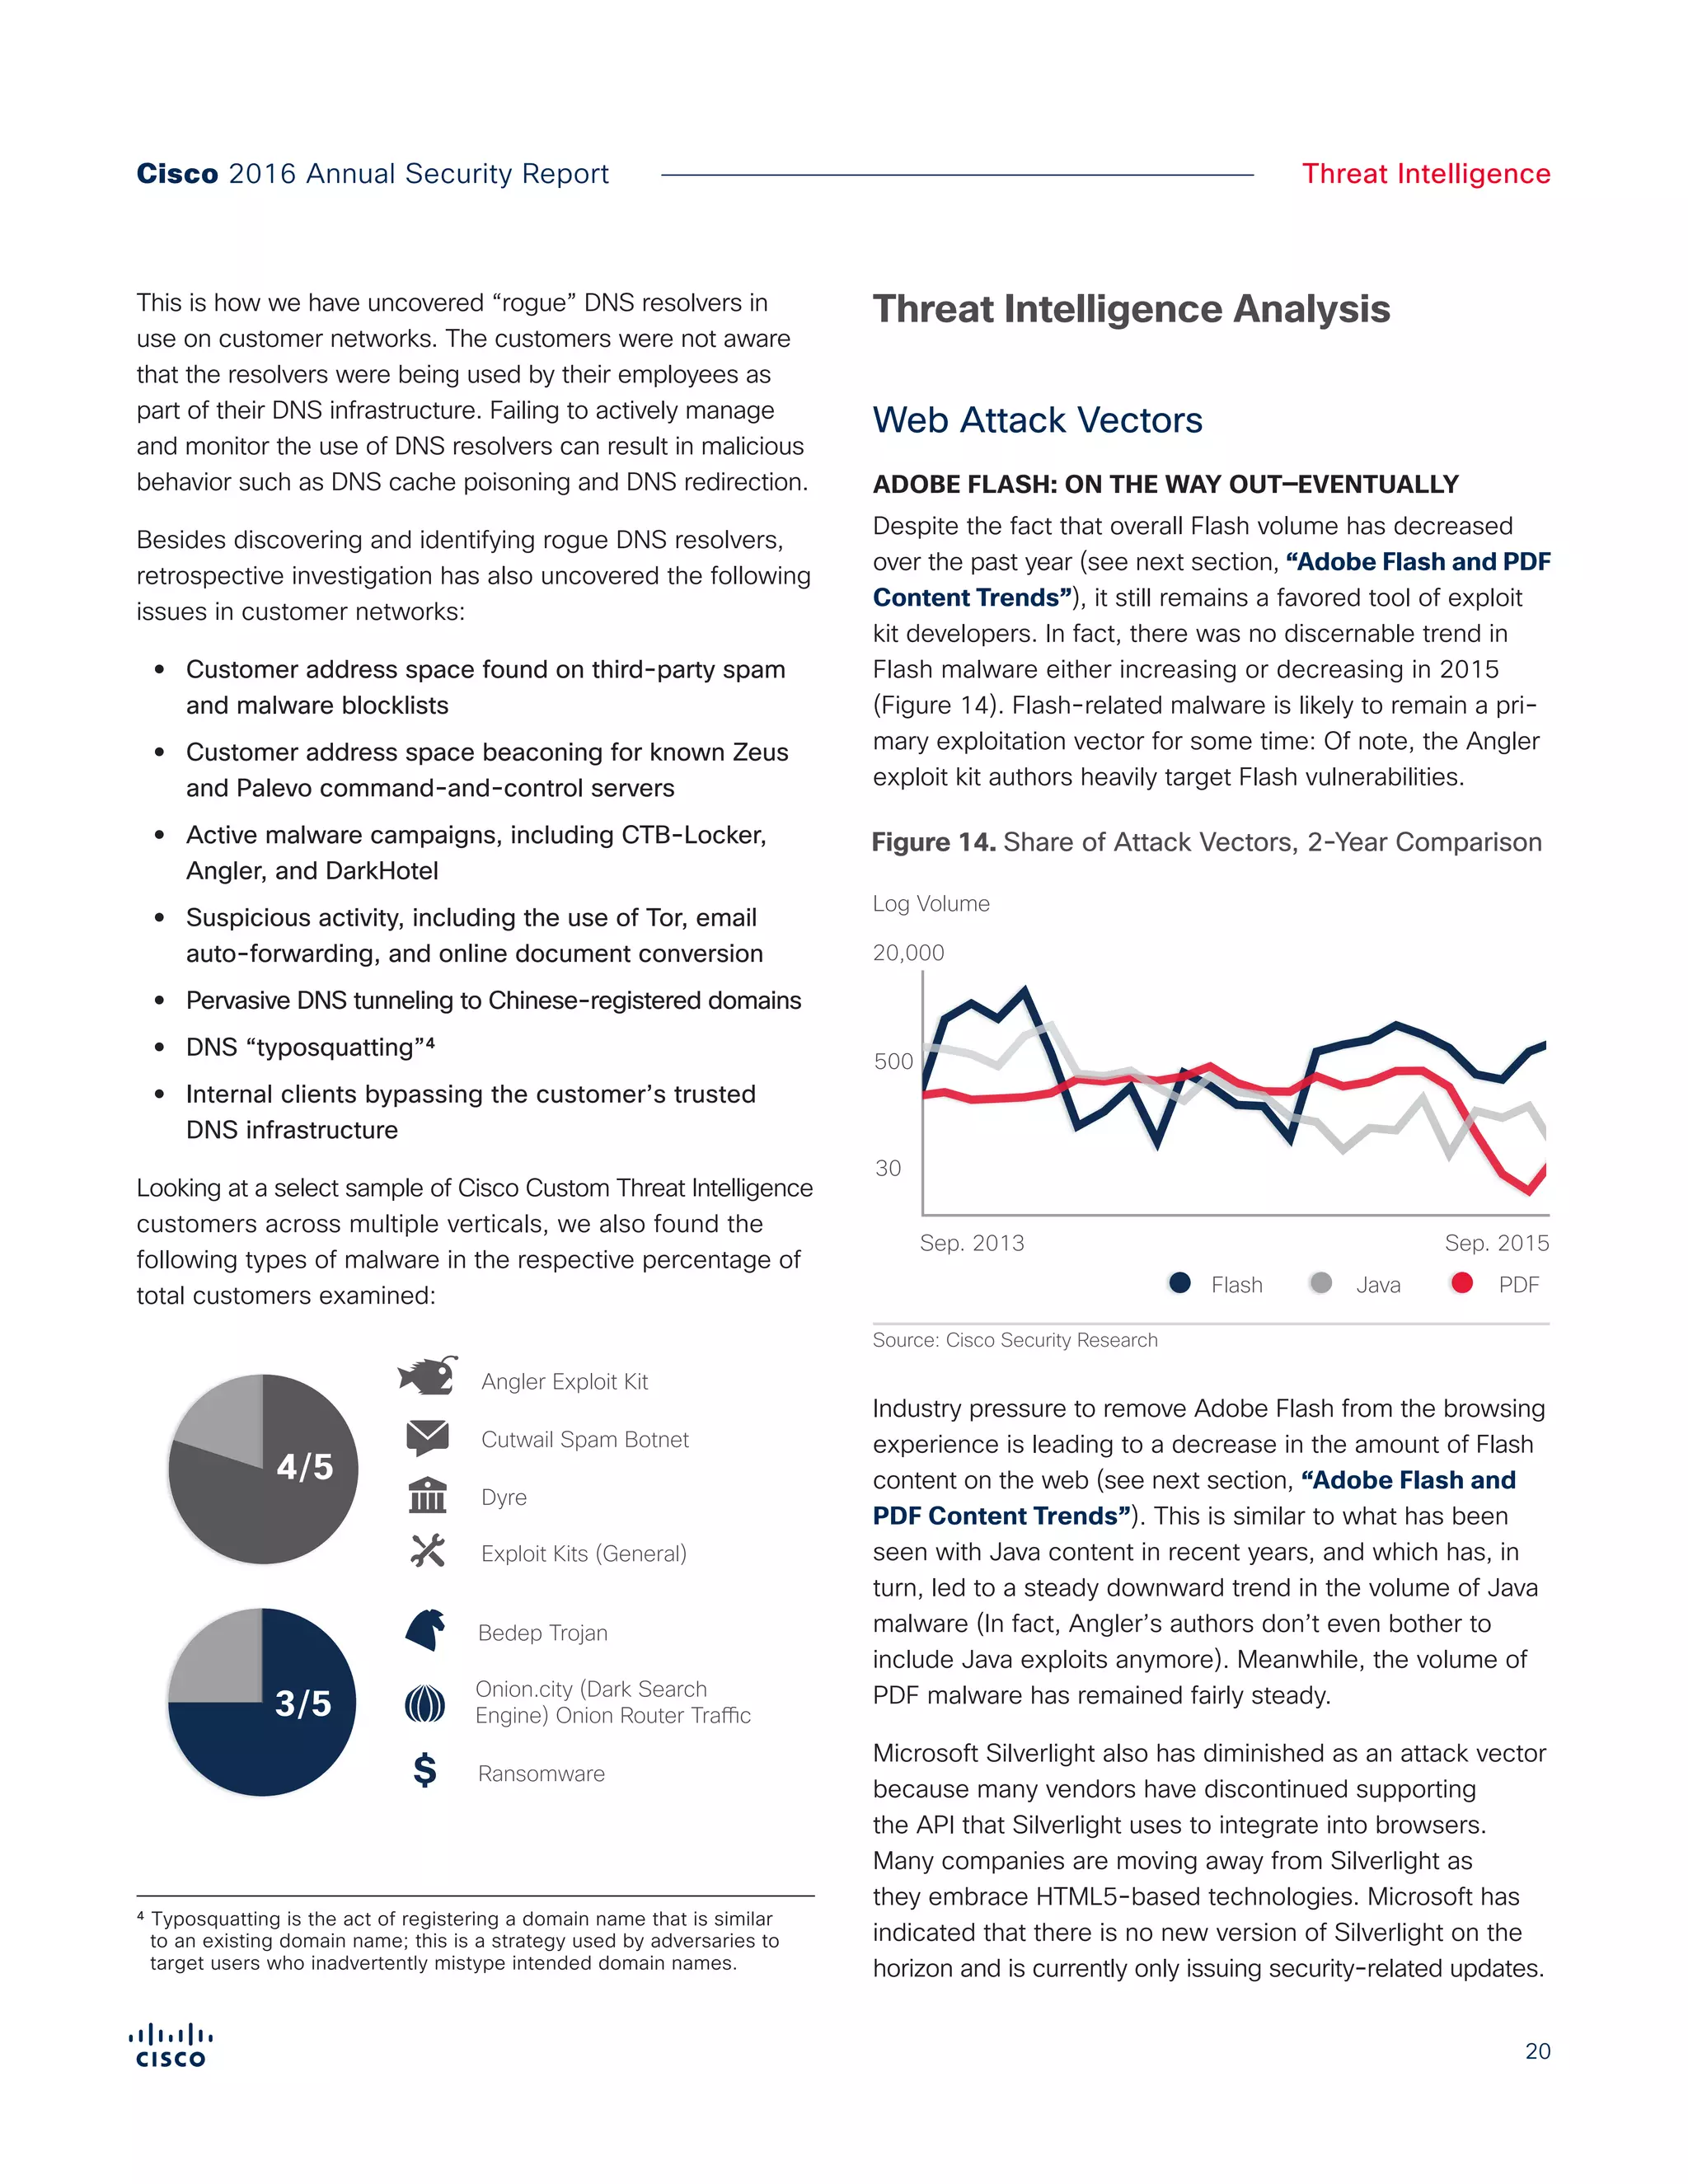
Cisco 2016
Annual Security Report
2
Executive Summary
Adversaries and defenders are both developing technologies
and tactics that are growing in sophistication. For their part,
bad actors are building strong back-end infrastructures
with which to launch and support their campaigns. Online
criminals are refining their techniques for extracting money
from victims and for evading detection even as they continue
to steal data and intellectual property.
The Cisco 2016 Annual Security Report—which presents
research, insights, and perspectives from Cisco Security
Research—highlights the challenges that defenders face
in detecting and blocking attackers who employ a rich
and ever-changing arsenal of tools. The report also
includes research from external experts, such as Level 3
Threat Research Labs, to help shed more light on current
threat trends.
We take a close look at data compiled by Cisco researchers
to show changes over time, provide insights on what this
data means, and explain how security professionals should
respond to threats.
In this report, we present and discuss:
THREAT INTELLIGENCE
This section examines some of the most compelling trends
in cybersecurity as identified by our researchers as well
as updates on web attack vectors, web attack methods,
and vulnerabilities. It also includes a more extensive look
into growing threats such as ransomware. To produce
its analysis of observed trends in 2015, Cisco Security
Research used a global set of telemetry data.
INDUSTRY INSIGHTS
This section examines security trends affecting enterprises,
including the growing use of encryption and the potential
security risks it presents. We look at the weaknesses in
how small and midsize businesses (SMBs) are protecting
their networks. And we present research on enterprises
relying on outdated, unsupported, or end-of-life software
to support their IT infrastructure.
SECURITY CAPABILITIES BENCHMARK STUDY
This section covers the results of Cisco’s second Security
Capabilities Benchmark study, which focused on security
professionals’ perceptions of the state of security in their
organizations. In comparing 2015 survey results with
those of 2014, Cisco found that chief security officers
(CSOs) and security operations (SecOps) managers are
less confident that their security infrastructure is up to
date, or that they are able to thwart attacks. However,
the survey also indicates that enterprises are stepping
up training and other security processes in a bid to
strengthen their networks. The study’s findings are
exclusive to the Cisco 2016 Annual Security Report.
A LOOK FORWARD
This section offers a view of the geopolitical landscape
affecting security. We discuss findings from two
Cisco studies—one examining executives’ concerns
about cybersecurity, and the other focusing on IT
decision-makers’ perceptions about security risk and
trustworthiness. We also give an update on our progress
in reducing time to detection (TTD), and underscore
the value of moving to an integrated threat defense
architecture as a way to combat threats.
Executive Summary
Security professionals must rethink their defense strategies.
Cisco 2016 Annual Security Report
3
Table of Contents
EXECUTIVE SUMMARY........................................... 2
MAJOR DEVELOPMENTS
AND DISCOVERIES................................................. 4
EYE ON THE PRIZE: FOR MODERN
CYBERCRIMINALS, MAKING MONEY
IS PARAMOUNT...................................................... 7
THREAT INTELLIGENCE.......................................... 9
Featured Stories..........................................................................10
Industry Collaboration Helps Cisco Sideline Far-Reaching and
Highly Profitable Exploit Kit and Ransomware Campaign..............10
Coordinated Industry Effort Helps Cripple One of the
Internet’s Largest DDoS Botnets..................................................14
Browser Infections: Widespread—
and a Major Source of Data Leakage...........................................16
Botnet Command and Control: A Global Overview.......................17
The DNS Blind Spot: Attacks Using DNS for
Command and Control.................................................................19
Threat Intelligence Analysis.......................................................20
Web Attack Vectors.....................................................................20
Web Attack Methods....................................................................21
Threat Updates ...........................................................................23
Vertical Risk of Malware Encounters.............................................25
Web Block Activity: Geographic Overview....................................27
INDUSTRY INSIGHTS...........................................29
Encryption: A Growing Trend—and a
Challenge for Defenders............................................................30
Online Criminals Increase Server Activity on WordPress............33
Aging Infrastructure: A Problem 10 Years in the Making............35
Are Small and Midsize Businesses a Weak Link to
Enterprise Security?...................................................................37
CISCO SECURITY CAPABILITIES
BENCHMARK STUDY...........................................41
Decline in Confidence Amid Signs of Preparedness..................42
A LOOK FORWARD..............................................55
Geopolitical Perspective: Uncertainty in the
Internet Governance Landscape................................................56
Cybersecurity Concerns Weigh on Minds of Executives.............57
Trustworthiness Study: Shining a Light on the
Risks and Challenges for Enterprises.........................................58
Time to Detection: The Race to Keep
Narrowing the Window...............................................................60
The Six Tenets of Integrated Threat Defense.............................62
Power in Numbers: The Value of Industry Collaboration.............63
ABOUT CISCO.....................................................64
Contributors to the Cisco 2016 Annual Security Report.............65
Cisco Partner Contributor..........................................................67
APPENDIX................................................................... 68
Table of Contents
Cisco 2016 Annual Security Report
4
Cisco 2016 Annual Security Report Threat Intelligence
Major Developments
and Discoveries
5
Major Developments and Discoveries
•• Cisco, with help from Level 3 Threat Research Labs
and cooperation from the hosting provider Limestone
Networks, identified and sidelined the largest Angler
exploit kit operation in the United States, which was
targeting 90,000 victims per day and generating tens
of millions of dollars annually for the threat actors
behind the campaign.
•• SSHPsychos (Group 93), one of the largest distributed
denial of service (DDoS) botnets ever observed by
Cisco researchers, was significantly weakened by the
combined efforts of Cisco and Level 3 Threat Research
Labs. Like the Angler case study mentioned above, this
success points to the value of industry collaboration to
combat attackers.
•• Malicious browser extensions can be a major source
of data leakage for businesses and are a widespread
problem. We estimate that more than 85 percent of
organizations studied are affected by malicious
browser extensions.
•• Well-known botnets like Bedep, Gamarue, and Miuref
represented the majority of botnet command-and-
control activity affecting one group of organizations
we analyzed in July 2015.
•• Cisco’s analysis of malware validated as “known bad”
found that the majority of that malware—91.3 percent—
uses the Domain Name Service (DNS) to carry out
campaigns. Through retrospective investigation into
DNS queries, Cisco uncovered “rogue” DNS resolvers
in use on customer networks. The customers were
not aware that the resolvers were being used by their
employees as part of their DNS infrastructure.
•• Adobe Flash vulnerabilities continue to be popular
with cybercriminals. However, software vendors
are reducing the risk that users will be exposed to
malware through Flash technology.
•• Observing the trends in 2015, our researchers suggest
that HTTPS encrypted traffic has reached a tipping
point: it will soon become the dominant form of
Internet traffic. Although encryption can help protect
consumers, it also can undermine the effectiveness
of security products, making it more difficult for the
security community to track threats. Adding to the
challenge, some malware may initiate encrypted
communications across a diverse set of ports.
•• Bad actors are making use of compromised websites
created by the popular web development platform
WordPress for their criminal activities. There they can
marshal server resources and evade detection.
Major Developments
and Discoveries
Cybercriminals have refined their back-end infrastructures to
carry out attacks in ways that increase efficiency and profits.
Cisco 2016 Annual Security Report
6
•• Aging infrastructure is growing and leaves
organizations increasingly vulnerable to compromise.
We analyzed 115,000 Cisco® devices on the Internet
and discovered that 92 percent of the devices
in our sample were running software with known
vulnerabilities. In addition, 31 percent of the Cisco
devices in the field that were included in our analysis
are “end of sale” and 8 percent are “end of life.”
•• In 2015, security executives showed lower confidence
in their security tools and processes than they did in
2014, according to Cisco’s 2015 Security Capabilities
Benchmark Study. For example, in 2015, 59 percent
of organizations said their security infrastructure was
“very up to date.” In 2014, 64 percent said the same.
However, their growing concerns about security are
motivating them to improve their defenses.
•• The benchmark study shows that small and midsize
businesses (SMBs) use fewer defenses than larger
enterprises. For example, 48 percent of SMBs said
in 2015 that they used web security, compared to
59 percent in 2014. And 29 percent said they used
patching and configuration tools in 2015, compared
with 39 percent in 2014. Such weaknesses can place
SMBs’ enterprise customers at risk, since attackers
may more easily breach SMB networks.
•• Since May 2015, Cisco has reduced the median time
to detection (TTD) of known threats in our networks to
about 17 hours—less than one day. This far outpaces
the current industry estimate for TTD, which is
100 to 200 days.
Major Developments and DiscoveriesCisco 2016 Annual Security Report
7
Cisco 2016 Annual Security Report Threat Intelligence
Eye on the Prize:
For Modern Cybercriminals,
Making Money Is Paramount
8
Eye on the Prize
In the past, many online criminals lurked in the shadows
of the Internet. They tried to avoid detection by making
only brief incursions into enterprise networks to launch
their exploits. Today, some emboldened cybercriminals are
tapping into legitimate online resources. They leach server
capacity, steal data, and demand ransoms from online
victims whose information they hold hostage.
These campaigns are a sobering escalation in the war
between defenders and attackers. If adversaries find more
places online from which to operate, then their impact can
grow exponentially.
In this report, Cisco security researchers highlight the
tactics that threat actors use to build a solid infrastructure
to make their campaigns stronger and more effective.
Adversaries continue to adopt more efficient methods for
boosting their profits—and many are paying special attention
to harnessing server resources.
The explosion in ransomware (see page 10) is a prime
example. Ransomware provides criminals with an easy
way to extract more money directly from users. When
adversaries establish campaigns that compromise tens of
thousands of users per day with little or no interruption, the
“paycheck” for their efforts can be staggering. In addition
to developing better ways to monetize their campaigns,
attackers are encroaching on legitimate resources as
staging grounds.
Creators of some ransomware variants as well as
developers of other exploits are now shifting traffic to
hacked WordPress websites as a way to avoid detection
and use server space (see page 33). And the perpetrators
of SSHPsychos, one of the largest botnets ever seen
by Cisco researchers, operated on standard networks
with little interference until a combined takedown effort
by Cisco and Level 3 Threat Research Labs persuaded
service providers to block the botnet creator’s traffic.
Eye on the Prize:
For Modern Cybercriminals,
Making Money Is Paramount
Cisco 2016 Annual Security Report
Threat Intelligence
10
Cisco 2016 Annual Security Report Threat Intelligence
The Angler exploit kit is one of the largest and most
effective exploit kits on the market. It has been linked to
several high-profile malvertising (malicious advertising) and
ransomware campaigns. And it has been a major factor
in the overall explosion of ransomware activity that our
threat researchers have been monitoring closely for the
past several years. Miscreants use ransomware to encrypt
users’ files, providing the keys for decryption only after
users pay a “ransom”—usually in the $300 to $500 range.
As reported in the Cisco 2015 Midyear Security Report,
cryptocurrencies like bitcoin and anonymization networks
such as Tor make it easy for adversaries to enter the
malware market and quickly begin generating revenue.
Ransomware’s rise in popularity can be tied to two main
advantages: It is a low-maintenance operation for threat
actors, and it offers a quick path to monetization because
the users pay adversaries directly in cryptocurrencies.
Through research of Angler and related ransomware trends,
Cisco determined that some operators of the exploit kit were
using an inordinate percentage of worldwide proxy servers for
Angler that were on servers operated by Limestone Networks.
This server use is a prime example of another trend that our
researchers have been observing in the shadow economy
of late: threat actors commingling legitimate and malicious
resources to carry out their campaigns.
In this case, the IP infrastructure supporting Angler was
not large. The daily number of active systems generally
hovered between 8 and 12. Most were active for only one
day. Figure 1 shows the number of unique IP addresses
that Cisco observed throughout July 2015.
Cisco found that Angler operators were essentially
rolling through IP addresses in a linear fashion to conceal
the threat activity and to prevent any interruption to
their moneymaking.
Featured Stories
Industry Collaboration Helps Cisco Sideline Far-Reaching and
Highly Profitable Exploit Kit and Ransomware Campaign
Threat Intelligence
Cisco has assembled and analyzed a global set of telemetry data for
this report. Our ongoing research and analysis of discovered threats,
such as malware traffic, can provide insights on possible future criminal
behavior and aid in the detection of threats.
Source: Cisco Security Research
Figure X.
Angler IP Addresses by Date, July 2015
July 2015
16
# of IP Addresses
Hovered between 8-12
12
8
4
311 15 2010
Figure 1. Number of Angler IP Addresses
by Date, July 2015
SHARE
11
Cisco 2016 Annual Security Report Threat Intelligence
As Figure 2 illustrates, Angler starts with an IP address
(here, 74.63.217.218). As the system compromises users
and generates “noise” that defenders begin to detect, the
adversaries shift to an adjacent IP address (74.63.217.219).
This activity continues through near-contiguous blocks of IP
space from a single hosting provider.
Cisco examined the IP information to identify the autonomous
system numbers (ASNs) and the providers associated with the
IP addresses. We determined that most of the Angler-related
traffic was coming from servers operated by two legitimate
hosting providers: Limestone Networks and Hetzner
(Figure 3). They accounted for almost 75 percent of the
overall volume of traffic for the month of July.
Cisco reached out first to Limestone Networks, which
appeared to be hosting the largest global portion of
Angler. Limestone embraced the opportunity to collaborate.
The company had been dealing with excessive credit card
chargebacks every month because adversaries were using
fraudulent names and credit cards to buy random batches
of their servers worth thousands of dollars.
74.63.217.218
Limestone Network IP Addresses
July 2015
Figure X. Low IP Infrastructure Supporting Angler
74.63.217.219
74.63.217.220
74.63.217.221
74.63.217.222
74.63.237.178
74.63.237.181
74.63.237.179
74.63.237.180
74.63.237.182
2 8
Source: Cisco Security Research
3 4 5 6 7
Figure 2. Low IP Infrastructure Supporting Angler
Figure 3. Angler HTTP Requests by Provider, July 2015
Source: Cisco Security Research
Figure X. Angler HTTP Requests by Provider, July 2015
Provider A
Provider B
Provider C
Provider D
Provider E
Provider F
Provider G
Provider H
Provider I
Provider J
Provider K
Provider L
10,0006000Number of Requests
(Limestone Networks)
(Hetzner)
75% of all
measured
traffic
SHARE
12
Cisco 2016 Annual Security Report Threat Intelligence
The adversaries’ approach to purchasing the servers made
it difficult to associate the fraudulent activity with a single
actor. For example, a miscreant might buy three or four
servers on one day, and then use a different name and
credit card to purchase three or four servers the next day.
In this way, they could essentially “roll” from one IP address
to the next when compromised servers were identified and
taken offline by defenders.
To investigate this activity, Cisco enlisted help from
Level 3 Threat Research Labs as well as from OpenDNS,
a Cisco company. Level 3 Threat Research Labs was able
to provide greater global insight into the threat, giving
Cisco the ability to see a little deeper into the scope of
the threat and how far-reaching it was at its peak. OpenDNS,
meanwhile, provided a unique look at the domain activity
associated with the threat, giving Cisco a more complete
understanding of how techniques like domain shadowing
were being incorporated by the adversaries.
Cisco threat researchers then looked into how, specifically,
users were encountering Angler and subsequently being
served malicious payloads. The researchers observed
popular websites redirecting users to the Angler exploit kit
through malvertising. The false ads were placed on hundreds
of major news, real estate, and popular culture sites. These
types of sites are commonly referred to in the security
community as “known good” sites.
Additionally, Cisco threat researchers found countless
examples of small, seemingly random websites doing
the same type of redirection, including a single person’s
obituary from a small, rural newspaper in the United States.
More than likely, the latter strategy was designed to target
elderly people. This population is generally more likely to use
default web browsers such as Microsoft Internet Explorer and
are less likely to be aware of the need to regularly patch
Adobe Flash vulnerabilities.
Another notable aspect of this Angler operation was the
volume of unique referers and the low frequency with which
they were used (Figure 4). We found more than 15,000
unique sites pushing people to the Angler exploit kit,
99.8 percent of which were used fewer than 10 times. Most
of the referers were therefore active only for a short period
and were removed after a handful of users were targeted.
In our July 2015 analysis, we noted that the peaks in activity
coincided with the various Hacking Team zero-day exploits
(CVE-2015-5119, CVE-2015-5122).1
Cisco determined that about 60 percent of the Angler
payloads delivered through this particular operation were
delivering some type of ransomware variant, the majority
being Cryptowall 3.0. Other types of payloads included
Bedep, a malware downloader that is commonly used
to install click-fraud campaign malware. (See “Browser
Infections: Widespread—and a Major Source of Data
Leakage,” page16.) Both types of malware are designed to
help adversaries make a lot of money from compromised
users very quickly, and with little or no effort.
	
Figure 4. Unique Referers by Day, July 2015
July 2015
311 15
Source: Cisco Security Research
Figure X. Unique Referers by Day, July 2015
Numberofuniquesitesdrivingtraffictoexploitserver
Peak activities coincided with zero-day exploits
2K
0
¹ “Adobe Patches Hacking Team’s Flash Player Zero-Day,” by Eduard Kovacs, SecurityWeek, July 8, 2015:
http://www.securityweek.com/adobe-patches-hacking-teams-flash-player-zero-day.
13
Cisco 2016 Annual Security Report Threat Intelligence
According to Cisco’s research, the primary actor
responsible for about half of the Angler exploit kit activity in
this particular campaign was targeting up to 90,000 victims
per day. By our estimation, the campaign was netting the
adversaries more than $30 million annually.
Presumably, the network out of Hetzner had a similar
success rate. That means the threat actor behind the
operation involving the Limestone Networks and Hetzner
servers was responsible for half of all global Angler activity
at the time of Cisco’s analysis. Cisco researchers estimate
that this operation was capable of generating gross
income of $60 million per year.
Angler Revenue
X
90Ktargets
per server
per day
10%
served exploits
62%
delivered
ransomware
2.9%
of ransoms paid
$
300
9515 users are paying ransoms per month
average ransom
147redirection
servers
per month
$
34Mgross yearly income
for ransomware
per campaign
40%
compromised
=
SHARE
Figure X. Angler Revenue
Source: Cisco Security Research
targets per day
90K of Angler infections
delivered ransomware
62%
unique IP addresses
were served exploits
in a single day
9K
of users being
served exploits
were compromised
40%
147 average ransom
$
300 gross yearly income
for ransomware
per campaign
$
34Mof ransoms
paid per day
redirection
servers
2.9%
X X =
14
Cisco 2016 Annual Security Report Threat Intelligence
Cisco also discovered that the servers that the users were
connecting to did not actually host any of the malicious
Angler activity. They were serving as a conduit. A user
would get into the redirection chain and submit a GET
request for a landing page, which would land on the proxy
server. The proxy server would route the traffic to an exploit
server in a different country, on a different provider. During
our research, we found that a single exploit server was
associated with multiple proxy servers. (See Figure 5.)
Cisco identified a status server that was handling tasks
such as health monitoring. Every single proxy server that
the status server was monitoring had a pair of unique URLs.
If the path was queried, the status server would return
an HTTP status code “204” message. The adversaries
could uniquely identify each proxy server and make sure
it not only was operating, but also that defenders had not
tampered with it. Using the other URL, the attackers could
collect the logs from the proxy server and determine how
efficiently their network was operating.
Industry collaboration was a critical component in Cisco’s
ability to investigate the Angler exploit kit activity. Ultimately,
it helped stop redirects to the Angler proxy servers on
a U.S. service provider and bring awareness to a highly
sophisticated cybercrime operation that was affecting
thousands of users every day.
Cisco worked closely with Limestone Networks to identify
new servers as they were brought online and monitored
them closely to make sure they were taken down. After
a while the adversaries moved away from Limestone
Networks, and a global decrease in Angler activity followed.
Coordinated Industry Effort Helps
Cripple One of the Internet’s Largest
DDoS Botnets
Integrated threat defense technologies can often halt major
attacks before they affect enterprise networks. However,
in many cases, bringing down a potentially massive
attack requires not only technological defenses, but also
coordination among service providers, security vendors,
and industry groups.
As criminals become even more serious about monetizing
their activities, the technology industry needs to do a
better job of partnering to take down criminal campaigns.
SSHPsychos (also called Group 93), one of the largest
DDoS botnets ever observed by Cisco security
researchers, was significantly weakened after Cisco
collaborated with Level 3 Threat Research Labs.
Figure 5. Angler Back-End Infrastructure
User Status ServerProxy Server
Exploit Server
Requests
page
Referred to
proxy server
Proxy server gets data from
exploit server (Port 81)
Exploit server sends HTTP
requests to status server
Rollup of log
data pushed to
master server
Status server tracks
HTTP requests/status
Figure X. Angler: Back–End Infrastructure
Source: Cisco Security Research
Master Server
SHARE
For more information on how Cisco disrupted a
significant international revenue stream generated
by the Angler exploit kit, read the Cisco Security
blog post “Threat Spotlight: Cisco Talos
Thwarts Access to Massive International
Exploit Kit Generating $60M Annually from
Ransomware Alone.”
15
Cisco 2016 Annual Security Report Threat Intelligence
UNIQUE THREAT
The SSHPsychos DDoS network is a unique threat for
several reasons. Because it enlists tens of thousands of
machines distributed across the Internet, it has the power
to launch a distributed denial of service (DDoS) attack
that cannot be addressed on a device-by-device basis. In
this case, the botnet was being created using brute-force
attacks involving secure shell (SSH) traffic (Figure 6).
The SSH protocol is used to allow secure communications,
and it is commonly used for the remote administration of
systems. At times, SSHPsychos accounted for more than
35 percent of all global Internet SSH traffic (Figure 7),
according to analysis by Cisco and Level 3.
SSHPsychos is operational in two countries: China and
the United States. The brute-force login attempts,
using 300,000 unique passwords, originated from a hosting
provider based in China. When adversaries were able to log
in by guessing the correct root password, the brute-force
attacks ceased. Twenty-four hours later, adversaries then
logged in from a U.S. IP address and installed a DDoS
rootkit to the affected machine. This was clearly a tactic to
reduce suspicion from network administrators. The botnet’s
targets varied, but in many cases appeared to be large
Internet service providers (ISPs).
Scanners completing
successful logins
Malware Host
SSH brute-force attempts
(300K unique passwords)
Target Network
Source: Cisco Security Research
Figure 6. SSHPsychos Uses Brute-Force Attacks
Figure 7. At Its Peak, SSHPsychos Accounted for 35 Percent of Global Internet Traffic
50K
100K
150K
Brute-Force Attempts
Feb. Mar. Apr.
SSHPsychos 103.41.125.0/23 SSHPsychos 43.255.190.0/23SSHPsychos 103.41.124.0/23
Figure X. At Peak, SSHPsychos Accounted for 35% of Internet SSH Traffic
Source: Cisco Security Research
SHARE
16
Cisco 2016 Annual Security Report Threat Intelligence
COLLABORATING WITH SECURITY EXPERTS
Because of the scale of the DDoS network, our researchers
believed that the damage would be difficult to contain. It
was essential to work in tandem with an organization that
could remove the brute-forcing group from the Internet
effectively. However, backbone providers are hesitant to
filter their customers’ content.
Cisco reached out to Level 3 Threat Research Labs.
Level 3 analyzed the traffic at the netblock, or range of
IP addresses, where SSHPsychos was thought to reside
(103.41.124.0/23). It confirmed that no legitimate traffic
was originating from or destined for that address. It null-
routed the network traffic within its own networks. Then it
contacted service providers for the relevant domains to ask
them to remove the network’s traffic.
The results of this effort were seen immediately (Figure 8).
The original network showed almost no new activity.
However, a new network at netblock 43.255.190.0/23
showed large amounts of SSH brute-force attack traffic.
It had the same behavior that was associated with
SSHPsychos. Following this sudden re-emergence of
SSHPsychos-like traffic, Cisco and Level 3 decided to
take action against 103.41.124.0/23, as well as the new
netblock 43.255.190.0/23.
Taking down the netblocks used by SSHPsychos did
not permanently disable the DDoS network. However,
it certainly slowed down its creators’ ability to run their
operations, and it prevented SSHPsychos from spreading
to new machines, at least temporarily.
As cybercriminals build large attack networks, the security
industry must explore ways to collaborate when faced
with a threat such as SSHPsychos. Top-level domain
providers, ISPs, hosting providers, DNS resolvers, and
security vendors can no longer sit on the sidelines when
online criminals launch their exploits on networks that are
intended to carry only legitimate traffic. In other words,
when criminals deliver malicious traffic in what is more or
less plain sight, the industry must remove the malicious
pathways to these legitimate networks.
Browser Infections: Widespread—and a
Major Source of Data Leakage
Security teams often view browser add-ons as a low-
severity threat. However, they should make monitoring
them a higher priority so that they can quickly identify and
remediate these types of infections.
The reason for urgency: Our research indicates that
browser infections are much more prevalent than many
organizations may realize. From January to October 2015,
we examined 26 families of malicious browser add-ons
(Figure 9). Looking at the pattern of browser infections
during these months, the number of infections seemed to
be on a general decline.
0
180K
Brute-Force Attempts
Cisco Collaborating
with Level 3
120K
60K
June July
Figure X. SSHPsychos Traffic Drops
Dramatically After Intervention
Source: Cisco Security Research
Figure 8. SSHPsychos Traffic Drops
Dramatically After Intervention
Figure 9. Browser Infections, January to October 2015
To learn more about Cisco and Level 3 Threat
Research Labs’ response to the SSHPsychos
threat, read the Cisco Security blog post
“Threat Spotlight: SSHPsychos.”
Jan.
0.5%
Percentage
0.3%
0
Browser Infection Detection
Jul.Apr.
2015
Oct.
Source: Cisco Security Research
Figure X. Increased Encryption Makes
IOC Detection More Difficult
40%
17
Cisco 2016 Annual Security Report Threat Intelligence
This pattern is deceptive, however. The increasing
volume of HTTPS traffic over those months made it
difficult to identify the indicators of compromise typically
associated with the 26 families we tracked because URL
information was not visible due to encryption. (For more
on encryption, and the challenges it creates for defenders,
see “Encryption: A Growing Trend—and a Challenge for
Defenders,” page 30.)
Malicious browser extensions can steal information, and
they can be a major source of data leakage. Every time a
user opens a new webpage with a compromised browser,
malicious browser extensions collect data. They are exfiltrating
more than the basic details about every internal or external
webpage that the user visits. They are also gathering highly
sensitive information embedded in the URL. This information
can include user credentials, customer data, and details about
an organization’s internal APIs and infrastructure.
Multipurpose malicious browser extensions are delivered
by software bundles or adware. They are designed to pull
in revenue by exploiting users in a number of ways. In an
infected browser, they can lead users to click on malvertising
such as display ads or pop-ups. They can also distribute
malware by enticing users to click a compromised link or
to download an infected file encountered in malvertising.
And they can hijack users’ browser requests and then inject
malicious webpages into search engine results pages.
Across the 45 companies in our sample, we determined
that in every month we observed more than 85 percent
of organizations were affected by malicious browser
extensions—a finding that underscores the massive scale
of these operations. Because infected browsers are
often considered a relatively minor threat, they can go
undetected or unresolved for days or even longer—giving
adversaries more time and opportunity to carry out their
campaigns (see “Time to Detection: The Race to Keep
Narrowing the Window,” page 60).
We therefore suggest that it is well worth security teams’
time to devote more resources to monitoring this risk, and to
consider increased use of automation to help prioritize threats.
Botnet Command and Control:
A Global Overview
Botnets are networks of malware-infected computers.
Adversaries can control them as a group and command
them to carry out a specific task, such as sending spam
or launching a DDoS attack. They have been growing in
both size and number for years. To better understand the
current threat landscape on a global scale, we analyzed the
networks of 121 companies from April to October 2015 for
evidence of one or more of eight commonly seen botnets.
The data was normalized to provide a general overview of
botnet activity (Figure 10).
We found that during this period, Gamarue—a modular,
multipurpose information stealer that has been around for
years—was the most common command-and-control threat.
BotnetActivityVolume
400
0
Apr. May Jun. Jul. Aug. Sep. Oct.
2015
Miuref
Other
Gamarue
Vawtrak
Bedep
Cryptowall
Figure X. Growth of Individual Threats
(Ratio of Infected Users)
Source: Cisco Security Research
Figure 10. Growth of Individual Threats
(Ratio of Infected Users)
18
Cisco 2016 Annual Security Report Threat Intelligence
A significant spike in the number of infections involving
the ransomware Cryptowall 3.0 was identified in July. This
activity is attributed largely to the Angler exploit kit, which
is known to drop the Cryptowall payload. As reported in the
Cisco 2015 Midyear Security Report, the authors of Angler
and other exploit kits have been quick to exploit “patching
gaps” with Adobe Flash—the time between Adobe’s release
of an update and when users actually upgrade.² Cisco
threat researchers attribute the July 2015 spike to the Flash
zero-day exploit CVE-2015-5119 that was exposed as
part of the Hacking Team leaks.³
The Angler exploit kit also delivers the Bedep Trojan, which
is used to perform click-fraud campaigns. A slight spike in
the prevalence of that threat was noted during July as
well (Figure 11).
Bedep, Gamarue, and Miuref (another Trojan and browser
hijacker that can perform click fraud) together represented
more than 65 percent of the botnet command-and-control
activity in the user base we analyzed.
The percentage of Bedep infections remained relatively
stable during the period we analyzed. However, a perceived
decrease in Miuref infections was observed. We attribute
this to the increase in HTTPS traffic, which helped to
conceal Miuref’s indicators of compromise.
Figure 12 shows the types of botnets that were responsible
for the most infections during the time frame we monitored.
Multipurpose botnets like Gamarue and Sality led the pack,
followed by click-fraud botnets. Banking Trojans were third,
showing that this type of threat, while old, is still widespread.
Comparison of
Botnet Infections
200
0
100
Spike due to zero–day exploit
Figure X. Monthly Threat Coverage,
Based on Number of Infected Users
Apr. May Jun. Jul. Aug. Sep. Oct.
2015
MiurefGamarue
Vawtrak
Bedep
Cryptowall
Source: Cisco Security Research
Figure 11. Monthly Threat Coverage, Based on the
Number of Infected Users
Figure X. Monthly Threat Coverage, Based on
Threat Categories
Apr. May Jun.
0
100
Jul. Aug. Sep. Oct.
2015
Click-Fraud Botnets
Ransomware
Multipurpose Botnets
Banking Trojans
Source: Cisco Security Research
%ofBotnetTypes
Figure 12. Monthly Threat Coverage, Based on
Threat Categories
² Cisco 2015 Midyear Security Report: http://www.cisco.com/web/offers/lp/2015-midyear-security-report/index.html.
³ “Adobe Patches Hacking Team’s Flash Player Zero-Day,” by Eduard Kovacs, SecurityWeek, July 8, 2015:
http://www.securityweek.com/adobe-patches-hacking-teams-flash-player-zero-day.
SHARE
19
Cisco 2016 Annual Security Report Threat Intelligence
Cisco’s analysis of malware validated as “known bad”
found that the majority of that malware—91.3 percent—use
the Domain Name Service in one of these three ways:
•• To gain command and control
•• To exfiltrate data
•• To redirect traffic
To arrive at this percentage, we mined all sample behaviors
from a variety of sandboxes that we own. Malware that was
determined not to use DNS in any way, or that simply used
DNS to conduct Internet “health checks,” was removed
from the sample for analysis. The remaining malware was
using DNS to connect to sites that were validated as bad or
were considered suspicious.
Despite adversaries’ reliance on DNS to help further malware
campaigns, few companies are monitoring DNS for security
purposes (or monitoring DNS at all). This lack of oversight
makes DNS an ideal avenue for attackers. According to a
recent survey we conducted (see Figure 13), 68 percent of
security professionals report that their organizations do
not monitor threats from recursive DNS. (Recursive DNS
nameservers provide the IP addresses of intended domain
names to the requesting hosts.)
Why is DNS a security blind spot for so many organizations?
A primary reason is that security teams and DNS experts
typically work in different IT groups within a company and
don’t interact frequently.
But they should. Monitoring DNS is essential for identifying
and containing malware infections that are already using
DNS for one of the three activities listed earlier. It is also
an important first step in mapping out other components
that can be used for further investigating an attack, from
determining the type of infrastructure supporting the attack
to finding its source.
Monitoring DNS takes more than collaboration between
security and DNS teams, however. It requires the alignment
of the right technology and expertise for correlation
analysis. (For more insight, see “Industry Collaboration
Helps Cisco Sideline Far-Reaching and Highly Profitable
Exploit Kit and Ransomware Campaign” on page 10 to find
out how OpenDNS helped Cisco gain more domain visibility
into the IPs that the Angler exploit kit was using.)
RETROSPECTIVE DNS ANALYSIS
Cisco’s retrospective investigation into DNS queries and
subsequent TCP and UDP traffic identifies a number of
malware sources. These include command-and-control
servers, websites, and distribution points. Retrospective
investigation also detects high-threat content using
intelligence from threat lists, community threat reports,
observed trends in cyber compromises, and knowledge of
the unique vulnerabilities facing a customer’s industry.
Our retrospective reporting helps to identify “low and
slow” data exfiltration attempts commonly associated with
advanced persistent threat (APT) behavior and which, in
many cases, is not captured by traditional threat detection
technologies. The objective of the analysis is to identify
anomalies within the vast quantity of outgoing communications
traffic. This “inside out” approach can uncover possible data
compromises and damaging network activity that might
otherwise be overlooked.
Figure X.
Monitoring Threats via Recursive DNS
Source: Cisco Security Research
of organizations
don’t monitor
recursive DNS
of malware uses
DNS in attacks
68%91.3%
Figure 13. Monitoring Threats from Recursive DNS
The DNS Blind Spot: Attacks Using DNS for Command and Control
20
Cisco 2016 Annual Security Report Threat Intelligence
This is how we have uncovered “rogue” DNS resolvers in
use on customer networks. The customers were not aware
that the resolvers were being used by their employees as
part of their DNS infrastructure. Failing to actively manage
and monitor the use of DNS resolvers can result in malicious
behavior such as DNS cache poisoning and DNS redirection.
Besides discovering and identifying rogue DNS resolvers,
retrospective investigation has also uncovered the following
issues in customer networks:
•• Customer address space found on third-party spam
and malware blocklists
•• Customer address space beaconing for known Zeus
and Palevo command-and-control servers
•• Active malware campaigns, including CTB-Locker,
Angler, and DarkHotel
•• Suspicious activity, including the use of Tor, email
auto-forwarding, and online document conversion
•• Pervasive DNS tunneling to Chinese-registered domains
•• DNS “typosquatting”⁴
•• Internal clients bypassing the customer’s trusted
DNS infrastructure
Looking at a select sample of Cisco Custom Threat Intelligence
customers across multiple verticals, we also found the
following types of malware in the respective percentage of
total customers examined:
Threat Intelligence Analysis
Web Attack Vectors
ADOBE FLASH: ON THE WAY OUT—EVENTUALLY
Despite the fact that overall Flash volume has decreased
over the past year (see next section, “Adobe Flash and PDF
Content Trends”), it still remains a favored tool of exploit
kit developers. In fact, there was no discernable trend in
Flash malware either increasing or decreasing in 2015
(Figure 14). Flash-related malware is likely to remain a pri-
mary exploitation vector for some time: Of note, the Angler
exploit kit authors heavily target Flash vulnerabilities.
Industry pressure to remove Adobe Flash from the browsing
experience is leading to a decrease in the amount of Flash
content on the web (see next section, “Adobe Flash and
PDF Content Trends”). This is similar to what has been
seen with Java content in recent years, and which has, in
turn, led to a steady downward trend in the volume of Java
malware (In fact, Angler’s authors don’t even bother to
include Java exploits anymore). Meanwhile, the volume of
PDF malware has remained fairly steady.
Microsoft Silverlight also has diminished as an attack vector
because many vendors have discontinued supporting
the API that Silverlight uses to integrate into browsers.
Many companies are moving away from Silverlight as
they embrace HTML5-based technologies. Microsoft has
indicated that there is no new version of Silverlight on the
horizon and is currently only issuing security-related updates.
Figure X. Types of Malware Number
of Total Customers
Source: Cisco Security Research
4/5
3/5
Angler Exploit Kit
Cutwail Spam Botnet
Dyre
Exploit Kits (General)
Bedep Trojan
Ransomware
Onion.city (Dark Search
Engine) Onion Router Traffic
Figure X. Types of Malware Number
of Total Customers
Source: Cisco Security Research
4/5
3/5
Angler Exploit Kit
Cutwail Spam Botnet
Dyre
Exploit Kits (General)
Bedep Trojan
Ransomware
Onion.city (Dark Search
Engine) Onion Router Traffic
30
500
20,000
Log Volume
Sep. 2013 Sep. 2015
Flash Java PDF
Figure X. Share of Attack Vectors,
Two–Year Comparison
Source: Cisco Security Research
Figure 14. Share of Attack Vectors, 2-Year Comparison
⁴ Typosquatting is the act of registering a domain name that is similar
to an existing domain name; this is a strategy used by adversaries to
target users who inadvertently mistype intended domain names.
21
Cisco 2016 Annual Security Report Threat Intelligence
ADOBE FLASH AND PDF CONTENT TRENDS
Cisco researchers have been watching a general decline in
the amount of Adobe Flash content on the web (Figure 15).
Recent actions by Amazon, Google, and other large players
in the Internet space are a factor for the decrease in Flash
content. These companies either no longer accept web
advertising that uses Flash, or they block it.
PDF content, meanwhile, has remained fairly stable over
the past year and is likely to remain so. However, it has not
been a major web attack vector for some time.
The decline in Flash content is likely to continue—and
perhaps, even accelerate—in the near term now that Adobe
has announced that it will be phasing out Flash.⁵ But it will
likely be some time before Flash content fades. Flash is
embedded in browsers such as Google Chrome, Microsoft
Internet Explorer, and Microsoft Edge and is still widely
used in web content, including gaming and video content.
However, in the years ahead, as new technologies are
adopted (such as HTML5 and mobile platforms), the
longer-term trend for web attack vectors like Java, Flash,
and Silverlight is becoming increasingly clear. Over time,
they will become less prevalent. Therefore, they are likely
to become much less attractive vectors to profit-minded
adversaries who focus on vectors that allow them to easily
compromise large populations of users and generate
revenue quickly.
Web Attack Methods
Figures 16 and 17 show the various types of malware
that adversaries are using to gain access to organizational
networks. Figure 16 illustrates the most commonly seen
malware: adware, spyware, malicious redirectors, iFrame
exploits, and phishing.
Figure 15. Percentage of Overall Traffic for Flash and PDF
Jan.
% of Overall Internet Traffic
60%
14%
Nov.
Source: Cisco Security Research
Figure X.
Percentage of Total Traffic for Flash and PDF
Flash PDF
Figure 16. Most Commonly Observed Malware
Source: Cisco Security Research
Sum (sample_count) x1000
Figure X. Most Commonly Observed Malware
Windows Binaries5070
Windows Trojan Downloader4911
JavaScript Trojan Downloader14,816
Facebook Scams36,681
JavaScript31,627
Phishing3798
iFrame3726
JavaScript Obfuscation3552
Redir3383
3261 Android Trojan Downloader
⁵ “Adobe News: Flash, HTML5 and Open Web Standards,” Adobe, November 30, 2015:
http://blogs.adobe.com/conversations/2015/11/flash-html5-and-open-web-standards.html.
22
Cisco 2016 Annual Security Report Threat Intelligence
Figure 16 can essentially be viewed as a collection of
types of malware that criminals use to gain initial access.
These are the tried-and-true and most cost-effective
methods of compromising large populations of users with
relative ease. JavaScript exploits and Facebook scams
(social engineering) were the most frequently used attack
methods, according to our research.
Figure 17 shows lower-volume malware. Note that “lower
volume” does not mean “less effective.” According to Cisco
Security Research, lower-volume malware can represent
emerging threats or highly targeted campaigns.
Many of these more sophisticated techniques are designed
to extract as much value as possible from compromised
users. They steal high-value data, or hold users’ digital
assets for ransom.
Therefore, when monitoring web malware, it is not enough
to simply focus on the types of threats most commonly
seen. The full spectrum of attacks must be considered.
Source: Cisco Security Research
Figure X.
Sample of Lower-Volume Malware Observed
Sum (sample_count) <40
Windows Downloader “Upatre”2
Windows Backdoor2
Windows Hoax2
Trojan Downloader3
Suspicious PDFs7
Windows Backdoor “Ace”5
JavaScript “Blackhole”10
Windows Trojan9
Windows “Gampass” Malware15
Windows “Krap-K” Malware35
Windows “Sality” Malware44
Windows Worm1
Windows Trojan “Upatre”1
Windows Tojan Downloader1
iFrame2
JavaScript Trojan Downloader1
Figure 17. Sample of Observed Lower-Volume Malware
Cisco 2016 Annual Security Report Threat Intelligence
Figure 18. Total Number of CVEs by Vendor
Source: Cisco Security Research, National Vulnerability Database
Figure X. Total Number of CVEs by Vendor
O
racle
M
icrosoft
Cisco
Adobe
Apple
IBM
Google
M
ozillaW
ordPress
Ubuntu
(Canonical)
Debian
HP
EM
C
Linux
Red
Hat
SAP
Apache
Siem
ensFedora
ProjectW
ireshark
Novell
NumberofCVEs
200
0
400
600
Source: Cisco Security Research, Metasploit, Exploit DB
5
0
10
15
20
Adobe Microsoft Apple Cisco Novell Joomla VMware
AvailablePublicExploits
Figure X. Number of Public Exploits Available
by Vendor Vulernability
Figure 19. Number of Public Exploits Available
by Vendor Vulnerability
The chart above shows the total number of CVEs published
in 2015 by vendor. Note that Adobe is not as prominent on
this chart as it is in the chart on the right, which shows the
vulnerabilities for which exploits are available.
In addition, WordPress shows only 12 vulnerabilities for 2015
for its own product. The additional 240 vulnerabilities come
from plugins and scripts created by third-party contributors.
As noted in Figure 20, lists of vulnerabilities and related
exploits can provide guidance for security professionals. They
can use them to manage and prioritize the vulnerabilities that
are high risk and most common, and patch them more quickly
than low-risk vulnerabilities. See the CVE Details website
(https://www.cvedetails.com/top-50-products.php) for
more information about CVEs by vendor.
23
Threat Updates
ADOBE FLASH TOPS VULNERABILITIES LIST
The Adobe Flash platform has been a popular threat vector
for criminals for several years. Flash vulnerabilities still
turn up frequently on lists of high-urgency alerts. In 2015,
the good news was that the vendors of products in which
these exploits commonly occur, such as web browsers,
recognized this weakness and are now taking steps to
reduce opportunities for adversaries.
In 2016, criminals are most likely to focus their exploits
and attacks on Adobe Flash users. Some of these Flash
vulnerabilities have exploits available online either publicly
or for sale as part of exploit kits. (As noted on page 21, the
volume of Flash-related content has declined, but Flash
remains a primary exploitation vector.)
Following up on tactics used to lessen the impact of Java—
another common threat vector—many web browsers block
or sandbox Flash as a way to protect users. Although this
is a positive development, it’s important to remember that
attackers will still succeed in launching exploits for some
time to come. Users may fail to update their browsers
as needed, and criminals will continue to launch exploits
aimed at older versions of browser software.
However, Cisco researchers believe that the protections
now built into some commonly used web browsers and
operating systems will lessen criminals’ reliance on Flash.
Because online attackers focus on achieving the best
possible results (such as high profitability) for the most
efficiency, they will put little effort into attacks that are less
likely to provide a return on investment.
SHARE
24
Flash EK
Hanjuan
NullHole
Sweet Orange
Fiesta
Nuclear
Rig
Neutrino
Nuclear Pack
Magnitude
Angler
CVE-2015 - 7645556024191671 51225119311331043090035903360311 03130310
Figure X. Common Vulnerabilities
Source: Cisco Security Research
Public Exploits
3105
Flash Vulnerabilities Other Vulnerabilities
Figure 20. Common Vulnerabilities
Figure 20 displays high-risk vulnerabilities, and indicates
whether the vulnerability is part of an exploit kit for hire
(see “Flash EK” line) or has exploits publicly available (see
“Public Exploits” line). Vulnerabilities for which functional
exploits are available are a high priority for patching.
This list can be used to help security professionals prioritize
their patching and remediation activities. The existence of
an exploit for a given product—publicly or within an exploit
kit—does not necessarily indicate that attacks are occurring.
Cisco 2016 Annual Security Report Threat Intelligence
25
Cisco 2016 Annual Security Report Threat Intelligence
Vertical Risk of Malware Encounters
To track high-risk verticals for web malware encounters,
we examined the relative volumes of attack traffic (“block
rates”) and “normal” or expected traffic.
Figure 21 shows the top 28 industries and their relative
block activity as a proportion of normal network traffic.
A ratio of 1.0 means the number of blocks is proportional
to the volume of observed traffic. Anything above 1.0
represents higher-than-expected block rates, and anything
below 1.0 represents lower-than-expected block rates.
Source: Cisco Security Research
1
6
8
4
2
1
6
8
4
2
1
6
8
4
2
1
6
8
4
2
Nov.
2014
Sept.
2015
Nov.
2014
Sept.
2015
Nov.
2014
Sept.
2015
Nov.
2014
Sept.
2015
Food and
Beverage
Transportation
and Shipping
Entertainment
Heating,
Plumbing,
and A/C
Engineering and
Construction
Industrial
Healthcare
Professional
Services
ElectronicsGovernment
Utilities
Insurance
Education
IT Telecom. Accounting
Media and
Publishing
Aviation
Travel and
Leisure
Charities
and NGO
Real Estate
and Land Mgmt.
Pharmaceutical
and Chemical
Automotive Legal
Retail and
Wholesale
Banking
and Finance
Energy, Oil,
and Gas
Manufacturing
Agriculture
and Mining
1
4
2
1
4
2
1
4
2
1
4
2
1
4
2
1
4
2
1
2
1
4
2
1
4
2
1
4
2
1
4
2
1
4
2
1
4
2
1
4
2
1
4
2
1
4
2
1
2
1
2
1
2
1
2
1
2
1
2
1
2
1
2
4
Figure 21. Monthly Vertical Block Rates, November 2014–September 2015
26
Cisco 2016 Annual Security Report Threat Intelligence
SHARE
Figure 22 illustrates how adversaries’ focus on specific
verticals can be fleeting. (Zero represents no net change.)
From January to March 2015, government was the vertical
with the highest block rate activity. From March to May, it
was electronics. In midsummer, professional services saw
the most blocks. And in the fall of 2015, healthcare was
leading all verticals in the number of block rates.
According to our research, the four verticals with the most
block activity in 2015 were all targeted with Trojan-related
attacks. The government vertical also faced a high number
of PHP injection attacks, while the professional services
vertical was hit with a high number of iFrame attacks.
Figure 22. Relative Block Rates of Verticals, Month to Month Comparison
Source: Cisco Security Research
Nov.
2014
Sept.
2015
Nov.
2014
Sept.
2015
Nov.
2014
Sept.
2015
Nov.
2014
Sept.
2015
Food and
Beverage
Transportation
and Shipping
Entertainment
Heating,
Plumbing,
and A/C
Engineering and
Construction
Industrial
Utilities
Insurance
Education
IT Telecom. Accounting
Media
and Publishing
Aviation
Travel and
Leisure
Charities
and NGO
Real Estate
andLand Mgmt.
Pharmaceutical
and Chemical
Automotive Legal
Retail and
Wholesale
Banking
and Finance
Energy, Oil,
and Gas
Manufacturing
Agriculture
and Mining
-2
2
0
-2
2
0
-2
2
0
-2
2
0
-2
2
0
-2
2
0
-2
2
0
-2
2
0
-2
2
0
-2
2
0
-2
2
0
-2
2
0
-2
2
0
-2
2
0
-2
2
0
-2
2
0
-2
2
0
-2
2
0
-2
2
0
-2
2
0
-2
2
0
-2
2
0
-2
2
0
-2
2
0
-8
4
8
0
-2
-8
4
8
0
-2
-8
4
8
0
-2
-8
4
8
0
-2
Healthcare
Professional
Services
ElectronicsGovernment
27
Cisco 2016 Annual Security Report Threat Intelligence
Poland 1.5
Figure X. Web Blocks by Country or Region
Russia 1Denmark 1
Japan 1
Canada 1.5
China 4France 2
Block activity = malicious traffic/expected traffic
United States 1
Source: Cisco Security Research
Hong Kong 9
Germany 1.5
Figure 23. Web Blocks by Country or Region
Web Block Activity: Geographic Overview
We also examined where malware-based block activity
originates by country or region, as seen in Figure 23. The
countries were selected for the study based on their volume
of Internet traffic. A “block ratio” value of 1.0 indicates that
the number of blocks we see is proportional to network size.
Countries and regions with block activity that we consider
higher than normal probably have many web servers and
hosts with unpatched vulnerabilities on their networks.
Malicious actors do not respect country boundaries and
will host malware where it is most effective.
28
Cisco 2016 Annual Security Report Threat Intelligence
A presence in large, commercially viable networks that
handle high Internet volume is another factor for high block
activity—which is one reason why Hong Kong tops our list.
Figure 24, which shows a month-to-month comparison of web
blocks by country or region from November 2014 to October
2015, provides some additional context for these rankings.
Note that Hong Kong saw higher than normal web block
activity beginning in the spring of 2015, as did France.
Both have since experienced a significant drop in web
block activity, but because the higher rates of activity earlier
this year were so far above the baseline, the recent decline
in activity still leaves Hong Kong quite higher by the end
of the year than at the start. The spike in block activity in
France returned to normal levels by midsummer.
Figure X. Realative Web Block Activity by Country or Region, Month to Month,
November 2014–October 2015
Source: Cisco Security Research
Nov.
2014
Hong Kong
Germany
Feb. Apr. Jun. Aug. Oct.Nov.
2014
0
1
3
5
7
9
11
13
15
0
1
3
5
0
1
3
5
7
9
0
1
3
5
7
9
0
1
3
5
0
1
3
5
7
9
11
13
15
1717
1919
2121
France
Australia
Italy
Feb. Apr. Jun. Aug. Oct.
China
2015 2015
Figure 24. Web Blocks by Country or Region, Month to Month, November 2014-October 2015
29
Cisco 2016 Annual Security Report Threat Intelligence
Industry Insights
3030
Industry InsightsCisco 2016 Annual Security Report
Encryption makes sense. Companies need to protect their
intellectual property and other sensitive data, advertisers
want to preserve the integrity of their ad content and back-
end analytics, and businesses are placing more focus on
protecting their customers’ privacy.
But encryption also creates security issues for organizations—
including a false sense of security. Organizations have
become better at encrypting data when it is transmitted
between entities, but data at rest is often left unsecured.
Many of the most notable breaches in the last few years
have taken advantage of unencrypted data stored in the data
center and other internal systems. For attackers, this is like
following a secured supply truck to an unlocked warehouse.
It is also important for organizations to understand that
end-to-end encryption can lessen the effectiveness of
some security products. Encryption conceals the indicators
of compromise used to identify and track malicious activity.
But there is no excuse to leave sensitive data unencrypted.
Security tools and their operators need to adapt to this brave
new world by gathering headers and other non-encrypted
parts of the data stream along with other sources of
contextual information to analyze encrypted traffic. Tools
that rely on payload visibility, such as full packet capture,
are becoming less effective. Running Cisco NetFlow and
other metadata-based analyses is now essential.
Observing the trends of 2015, our researchers suggest that
encrypted traffic, particularly HTTPS, has reached a tipping
point. While not yet the majority of transactions, it will soon
become the dominant form of traffic on the Internet. In fact,
our research shows that it already consistently represents
over 50 percent of bytes transferred (Figure 25) due to the
HTTPS overhead and larger content that is sent via HTTPS,
such as transfers to file storage sites.
For any web transaction, a number of bytes is sent out
(outbound) and received (inbound). HTTPS transactions
have larger outbound requests than HTTP outbound
requests—about an extra 2000 bytes. HTTPS inbound
requests, meanwhile, also have overhead, but this becomes
less significant with larger responses.
Industry Insights
Cisco provides research and analysis on security trends and practices.
Paradoxically, some may make defenders’ ability to track threats more
challenging and place organizations and individual users at greater risk
for compromise or attack.
46%
57%
Figure X.SSL Percentages
% HTTPS Requests
2015
% Total Bytes
Jan. Oct.
60
Percentage of Traffic
20
40
24%
33.56%
Source: Cisco Security Research
Figure 25. SSL Percentages
Encryption: A Growing Trend—and a Challenge for Defenders
SHARE
3131
Industry InsightsCisco 2016 Annual Security Report
By combining the incoming and outgoing bytes per web
transaction, we can determine the overall percentage of all
bytes involved per web transaction that are encrypted using
HTTPS. Due to the increase in HTTPS traffic and the extra
overhead, we determined that HTTPS bytes represented
57 percent of all web traffic in October 2015 (Figure 25),
up from 46 percent in January.
We also determined through web traffic analysis that
HTTPS requests have been increasing gradually, but
significantly, since January 2015. As Figure 25 shows,
24 percent of the requests in January used the HTTPS
protocol; the rest of them used HTTP.
By October, 33.56 percent of the requests observed were
HTTPS. Additionally, we found that the percentage of
inbound HTTPS bytes had increased. This was true
throughout the year. As the amount of traffic using HTTPS
increases, more bandwidth is required. An additional 5 Kbps
is required per transaction.
We attribute the overall increase in encrypted web traffic
primarily to these factors:
•• More mobile traffic from applications, which
inherently encrypt
•• More requests from users to download encrypted video
•• More requests to storage and backup servers that
hold sensitive “data at rest,” which adversaries are
eager to tap
In fact, Figure 26 shows that HTTPS requests to online
storage and backup resources had increased by 50 percent
since the start of 2015. File transfer services are also up
significantly during the same period—36 percent.
Ultimately, there is increasing encrypted activity occurring in
both the number of encrypted transactions and the number
of encrypted bytes in each transaction. Each one poses its
own benefit and its own potential risk, ushering in the need
for an integrated threat defense that helps increase visibility.
% Delta2015
Online Storage and Backup 50%
File Transfer Services 36%
Webpage Translation 32%
Photo Search/Images 27%
Gambling 26%
Pornography 25%
Internet Telephony 19%
Streaming Video 17%
Search Engines and Portals 14%
Personal Sites 14%
Reference 13%
Illegal Downloads 13%
Online Communities 12%
Illegal Drugs 11%
Government and Law 10%
Lingerie and Swimsuits 10%
Web-Based Email 10%
Adult 8%
Advertisements 8%
Mobile Phones 8%
Figure X. HTTPS Request- Biggest Changes
from January to September 2015
Source: Cisco Security Research
Figure 26. HTTPS Requests: Biggest Changes
from January to September 2015
SHARE
3232
Industry InsightsCisco 2016 Annual Security Report
Looking at the top domains by requests (Figure 27), we
see that many of the main content pages of Google and
Facebook are encrypted. Typically, only 10 percent of their
advertising traffic is encrypted.
Regardless of the challenges, data encryption is a requirement
in the current threat landscape. Attackers are too adept
at circumventing access control for users to leave critical
information unprotected at any stage of storage or transfer.
This is why it is essential for security teams to monitor
web traffic patterns to make sure that HTTPS requests
are not coming from or going to suspicious locations.
A word of caution: Don’t look for encrypted traffic over a
predefined set of ports. As discussed in the next section, our
research shows that malware is likely to initiate encrypted
communications over a diverse set of ports.
THE ENTROPY FACTOR
High entropy is a good indication of encrypted or compressed
file transfers or communication.⁶ The good news for
security teams is that entropy is relatively easy to monitor
because it does not require knowledge of the underlying
cryptographic protocols.
During a 3-month period beginning June 1, 2015, Cisco
security researchers observed 7,480,178 flows from
598,138 “threat score: 100” malware samples submitted.
There were 958,851 high-entropy flows during this period,
or 12.82 percent.
We also identified 917,052 flows over the Transport
Layer Security (TLS) protocol (12.26 percent). In addition,
8419 TLS flows were over a port other than 443—the
default port for secured HTTP. Some of the ports that the
observed malware used for communication were ports 21,
53, 80, and 500.
As the level of encrypted Internet traffic continues to rise,
it will become increasingly important for organizations to
embrace an integrated threat defense architecture (see
“The Six Tenets of Integrated Threat Defense,” page 62).
Point solutions are not effective at identifying potential
threats in encrypted traffic. Integrated security platforms
provide security teams with more visibility into what’s
happening on devices or networks, so they can more easily
identify suspicious patterns of activity.
⁶ Entropy: In computing, entropy (lack of order or predictability) is the randomness collected by an operating system or application for use in
cryptography or other uses that require random data.
Figure 27. Top Hosts Encrypting HTTPS Traffic
0-25% 26-50% 51-75% 76-100%% Encrypted
Figure X. Top 100 Hosts
Source: Cisco Security Research
www.google-analytics.com
crl.microsoft.com
pagead2.googlesyndication.com
ad4.liverail.com
b.scorecardresearch.com
ads.adaptv.advertising.com
ping.chartbeat.net
v4.moatads.com
au.download.windowsupdate.com
ib.adnxs.com
c2s-openrtb.liverail.com
http.00.s.sophosxl.net
platform.twitter.com
pixel.adsafeprotected.com
ads.yahoo.com
Sample Hosts 76-100%
Sample Hosts 51-75%
Sample Hosts 26-50% Sample Hosts 0-25%
maps.googleapis.com
www.google.com
googleads.g.doubleclick.net
ad.doubleclick.net
0.2mdn.net
outlook.office365.com
hangouts.google.com
www.facebook.com
mail.google.com
44
Hosts
0–25%
Encrypted
51–75%
Encrypted
12 Hosts
26–50%
Encrypted
12 Hosts
76–100%
Encrypted
32
Hosts
3333
Industry InsightsCisco 2016 Annual Security Report
As discussed in the introduction to this report, online criminals
are continually on the lookout for methods to add efficiency
and cost savings to their operations—along with new ways to
evade detection. Increasingly, cybercriminals are finding
this efficiency within websites created using WordPress,
the popular website and blog development platform. In
WordPress sites, attackers can take control of a steady
stream of compromised servers to create an infrastructure
that supports ransomware, bank fraud, or phishing attacks.
The Internet is filled with abandoned sites created
with WordPress that are not maintained from a security
perspective; as new security issues surface, these sites are
often compromised and incorporated into attack campaigns.
Analyzing the systems used to support ransomware and
other malware, Cisco security researchers found that many
online criminals are shifting online activity to compromised
WordPress servers. The number of WordPress domains
used by criminals grew 221 percent between February and
October 2015 (see Figure 28).
This shift in venue, Cisco researchers believe, has
happened for a couple of reasons. When ransomware
uses other tools to communicate encryption keys or other
command-and-control information, those communications
can be detected or blocked, which prevents the encryption
process from completing. However, communications that
relay encryption keys through compromised WordPress
servers may appear normal, thus increasing the chances
that file encryption will be completed. In other words, the
WordPress sites act as relay agents.
Figure 28. Number of WordPress Domains Used by
Malware Creators
Figure X. WordPress Domains Used
by Malware Creators
Source: Cisco Security Research
Feb.
73
Apr.
82
Jun.
114
Aug.
171
Sep.
212
Mar.
83
May
123
Jul.
181
Jan.
128
235
Oct.
Lancope, a Cisco company, examined encryption
rates for both internal and Internet traffic across three
business sectors (two universities, a hospital, and an
ISP provider, all based in the United States).
At one of the universities, Lancope found that almost all
internal traffic was encrypted (82 percent). In addition,
53 percent of the university’s Internet traffic was
encrypted. These findings are on par with trends that
Lancope has observed in other industries.
Only 36 percent of the hospital’s internal data was
encrypted. However, more than half (52 percent) of the
Internet traffic was encrypted.
At the leading ISP provider, 70 percent of the internal
traffic was encrypted, and 50 percent of Internet traffic
was encrypted.
The study by Lancope tells a story of broad-based
adoption of encryption for data in motion across various
sectors. Cisco suggests a similar focus should now
be applied to the encryption of data at rest to limit the
impacts of organizational compromises.
The Move Toward Encryption: Case Data
Online Criminals Increase Server Activity on WordPress
Figure X. The Move Toward
Encryption Case Data
Internet DataInternal Data
Source: Lancope Threat Research Labs
Hospital
36%
52%
University 2
82%
53%
University 1
14%
37%
70%
50%
ISP
3434
Industry InsightsCisco 2016 Annual Security Report
To sidestep the drawbacks of other technologies, criminals
have turned to WordPress, which they use to host malware
payloads and command-and-control servers. WordPress
sites offer several advantages. For example, the many
abandoned sites give criminals more opportunities for
compromising sites with weak security protections.
The risk of using compromised systems to run a malware
operation is that one of the hacked servers may be taken
down when the compromise is discovered. If this happens
in the middle of a campaign, the malware downloader may
fail to retrieve its payload or the malware may be unable
to communicate with its command-and-control servers.
Cisco security researchers noticed that malware overcame
this by using more than one WordPress server; Cisco even
discovered lists of compromised WordPress servers stored
on data-sharing sites such as Pastebin.
The malware used these lists to find working command-
and-control servers, allowing the malware to operate even
if a compromised server failed. Researchers also identified
malware downloaders that contained a list of WordPress
sites storing payloads. If one download site was not working,
the malware went to the next one and downloaded malicious
payloads from the working WordPress server.
The compromised WordPress sites were often not running
the latest version of WordPress, had weak admin passwords,
and used plugins that were missing security patches.
These vulnerabilities allowed attackers to co-opt WordPress
servers and use them as malware infrastructure (see Figure 29).
Cisco researchers have identified some of the software and
file types commonly hosted on compromised WordPress sites:
•• Executable files that are payloads for exploit kit attacks
•• Configuration files for malware such as Dridex and Dyre
•• Proxy code that relays command-and-control commu-
nication to hide command-and-control infrastructure
•• Phishing webpages for collecting usernames
and passwords
•• HTML scripts that redirect traffic to exploit kit servers
In addition, Cisco researchers have identified many
malware families that are using compromised WordPress
sites for infrastructure:
•• Dridex infostealer
•• Pony password stealer
•• TeslaCrypt ransomware
•• Cryptowall 3.0 ransomware
•• TorrentLocker ransomware
•• Andromeda spam botnet
•• Bartallex Trojan dropper
•• Necurs infostealer
•• Fake login pages
Figure 29. How WordPress Sites Are CompromisedFigure X. How Cryptowall Ransomware uses hacked WordPress servers for Command and Control
Cryptowall C&C Server
User Views Webpage
with Banner Ads
Cryptowall Binary Downloaded
from WordPress Server
Cryptowall Retrieves Ransom
Note and Provides Link to Payment Site
Cryptowall Connects to C&C
Server to Get Encryption Key
Cryptowall Encrypts
Documents
!
!
!
Source: Cisco Security Research
3
4
5
6
1 Flash Exploit2
SHARE
3535
Industry InsightsCisco 2016 Annual Security Report
Security professionals concerned about the threats posed
by WordPress hosting by criminals should seek web security
technology that examines content coming from WordPress-
created sites. Such traffic could be considered unusual if
the network is downloading programs from WordPress sites
instead of just webpages and images (although WordPress
sites can host legitimate programs as well).
Aging Infrastructure: A Problem
10 Years in the Making
All companies today are IT companies to some degree,
because they are dependent on their IT and OT (operational
technology) infrastructure to be connected, digitized, and
successful. That means they need to make IT security a
priority. Yet many organizations rely on network infrastructures
built of components that are old, outdated, and running
vulnerable operating systems—and are not cyber-resilient.
We recently analyzed 115,000 Cisco devices on the Internet
and across customer environments as a way to bring
attention to the security risks that aging infrastructure—
and lack of attention to patching vulnerabilities—present.
We identified the 115,000 devices in our one-day sample
by scanning the Internet and then looking at the devices
from the “outside in” (from the Internet view and into
the enterprise). Through our scanning and analysis, we
found that 106,000 of the 115,000 devices had known
vulnerabilities in the software they were running. That
means 92 percent of the Cisco devices on the Internet in
our sample are susceptible to known vulnerabilities.
Cisco also discovered that the version of the software
that those devices were running had 26 vulnerabilities, on
average. In addition, we learned that many organizations
were running outdated software in their network infrastructure
(Figure 30). We found some customers in the financial,
healthcare, and retail verticals using versions of our software
that are more than 6 years old.
We also discovered that many of the infrastructure devices
we analyzed had reached their last day of support (LDoS)—
meaning they cannot be updated and made more secure
(Figure 31). These devices are not even receiving patches
for known vulnerabilities, so they are not being provided
information about new threats. Customers have been made
aware of this issue.
0
1
2
3
4
5
6
Years
Figure X. Average Software Age in Years
AirportC
om
m
s.Drug
M
fg.EnterpriseFinancialHealthcareInsurance
Service
Provider
Retail
Telecom
.
Source: Cisco Security Research
Figure 30. Average Software Age in Years
2
Insurance
1
Enterprise
0.6
Retail
10
Service Provider
16.3
Healthcare
15.7
Telecom.
15
Financial
19.9
Figure X. Percentage of LDoS for
Infrastructure Devices
Source: Cisco Security Research
Drug Mfg.
4.8
Airport
5
Comms.
Figure 31. Percentage of LDoS for Infrastructure Devices
For more on this topic, read the
Cisco Security blog posts:
“IT Security: When Maturity Is Overrated”
“Evolution of Attacks on Cisco IOS Devices”
“SYNful Knock: Detecting and Mitigating
Cisco IOS Software Attacks”
3636
Industry InsightsCisco 2016 Annual Security Report
Reliance on aging infrastructure opens the door to
attackers. However, the rise in cumulative alerts—
which include product vulnerabilities in open-source
and proprietary solutions—is a positive sign that
the technology industry is paying close attention to
eliminating opportunities for attackers.
Cumulative alert totals have increased 21 percent from
2014 to 2015. From July through September 2015,
the increase was notably high. This increase can be
attributed in large part to major software updates from
vendors such as Microsoft and Apple, because product
updates lead to more reporting of software vulnerabilities.
Major software vendors now release patches and
upgrades in greater volume, and they are more
transparent about this activity. The increasing volume
is a main driver for organizations automating their
vulnerability management through the use of security
intelligence and management platforms that help
manage the volume of system and software inventory,
vulnerability, and threat information. Using these systems
and application programming interfaces (APIs) allows for
more efficient, timely, and effective security management
across large and small organizations.
Cumulative Alert Totals Show Growing Commitment to Managing Vulnerabilities
Figure 32. Cumulative Annual Alert Totals
In addition, 8 percent of the 115,000 devices in our sample
that we analyzed have reached their end-of-life stage, and
another 31 percent will reach end of support within one to
four years.
Aging, outdated IT infrastructure is a vulnerability for
organizations. As we move closer to the Internet of Things
(IoT)—and the Internet of Everything (IoE)—it becomes more
important for businesses to make sure they are relying on
a network infrastructure that is secure, thus ensuring the
integrity of the data and communications traversing the
network. This is critical to the success of the emerging IoE.
Many Cisco customers built their network infrastructure a
decade ago. Back then, many businesses simply did not
account for the fact that they would be 100 percent reliant
on that infrastructure. Nor did they anticipate that their
infrastructure would become a prime target for adversaries.
Organizations tend to avoid making infrastructure updates
because it’s expensive and requires network downtime.
In some cases, a simple update won’t be enough. Some
products are so old they cannot be upgraded to incorporate
the latest security solutions needed to protect the business.
These facts alone speak to the criticality of maintaining
infrastructure. Organizations need to plan for regular
upgrades and recognize the value of taking control of their
critical infrastructure proactively—before an adversary does.
SHARE
Jan. Dec.
Source: Cisco Security Research
2K
6K
0
4K
8K
Total Alerts
Figure X. Cumulative Annual Alert Totals
21% from 2014 to 2015
2014
2013
3737
Industry InsightsCisco 2016 Annual Security Report
Figure 33. Number of Vulnerabilities in Common Categories
In examining common vulnerability categories, cross-site
scripting (XSS) vulnerabilities dropped 47 percent from
2014 to 2015 (Figure 33). The decrease may be a result
of the greater attention paid to vulnerability testing.
Vendors have become more skilled at identifying these
particular vulnerabilities and fixing them before their
products go to market.
Information leak or information disclosure vulnerabilities
dropped 15 percent in 2015. These vulnerabilities
involve unintentional disclosures to parties that don’t
have explicit access. Vendors have become attentive to
controls that allow or disallow access to data, making
this common vulnerability a less-frequent occurrence.
Threat Categories: Decline in Buffer Errors, Information Leaks, and Disclosures
SMBs play a critical role in national economies. When
entrusted with data by their customers, SMBs also carry
the responsibility of protecting this information from online
attackers. However, as detailed in the Cisco 2015 Security
Capabilities Benchmark Study (see page 41), SMBs show
signs that their defenses against attackers are weaker than
their challenges demand. In turn, these weaknesses can
place SMBs’ enterprise customers at risk. Attackers that
can breach an SMB network could also find a path into an
enterprise network.
Judging from the results of the Cisco 2014 Security Capa-
bilities Benchmark Study, SMBs are using fewer processes
to analyze compromises and fewer threat defense tools
than they used last year. For example, 48 percent of SMBs
said in 2015 that they used web security; 59 percent said they
did in 2014. Only 29 percent said they used patching and con-
figuration tools in 2015, compared with 39 percent in 2014.
In addition, of the SMB respondents that do not have an
executive responsible for security, nearly one-quarter do
not believe their businesses are high-value targets for online
criminals. This belief hints at overconfidence in their business’s
ability to thwart today’s sophisticated online attacks—or, more
likely, that attacks will never happen to their business.
Are Small and Midsize Businesses a Weak Link to Enterprise Security?
SHARE
Source: Cisco Security Research
Figure X. Common Vulnerabliity Categories
2014 2015
CWE-119: Buffer Errors
861 681
CWE-22: Path Traversal
42 22
CWE-94: Code Injection
76 37
CWE-264: Permissions,
Privileges, and Access Control
270 220
CWE-89: SQL Injection
35 20
CWE-287: Authentication Issues
50 27
CWE-200: Information
Leak/Disclosure
269 191
CWE-352: Cross-Site
Request Forgery (CSRF)
36 45
CWE-59: Link Following
12 4
(Increase)
CWE-79: Cross-Site
Scripting (XSS)
201 120
CWE-16: Configuration
4 10
CWE-78: OS Command
Injections
42 26
(Increase)
3838
Industry InsightsCisco 2016 Annual Security Report
SMBS LESS LIKELY TO USE INCIDENT RESPONSE TEAMS
In many cases, SMBs are less likely than large enterprises
to have incident response and threat intelligence teams.
This may be due to budget constraints: Respondents
pointed to budget issues as one of the biggest obstacles
to adopting advanced security processes and technology.
Seventy-two percent of large enterprises (those with more
than 1000 employees) have both teams, compared with
67 percent of businesses with fewer than 500 employees.
SMBs also use fewer processes to analyze compromises,
eliminate the causes of an incident, and restore systems
to pre-incident levels (Figure 35). For example, 53 percent
of enterprises with more than 10,000 employees use
network flow analysis to analyze compromised systems,
compared with 43 percent of businesses with fewer than
500 employees. Sixty percent of businesses with more than
10,000 employees patch and update applications deemed
vulnerable, compared with 51 percent of businesses with
fewer than 500 employees.
SMBs’ use of certain threat defenses appears to be on the
decline. For example, in 2014, 52 percent of SMBs used
mobility security, but only 42 percent did so in 2015. Also,
in 2014, 48 percent of SMBs used vulnerability scanning,
compared to 40 percent in 2015 (see Figure 36).
Figure 35. SMBs Use Fewer Security Processes than Large Enterprises
Source: Cisco 2015 Security Capabilities Benchmark Study
Figure X. SMBs Use Fewer Security Processes than Large Enterprises
Which of These Processes—If Any—Does Your Organization Use to Analyze Compromised Systems?
Memory Forensics
Network Flow Analysis
Systems Log Analysis
External (Third-Party) Incident Response/Analysis Teams
Correlated Event/Log Analysis
Registry Analysis
IOC Detection
Implement Additional or New Detections and Controls
Company Size
What Processes Does Your Organization Use to Restore Affected Systems to Pre-Incident Operational Levels?
Patch and Update Applications Deemed Vulnerable
36%
43%
47%
40%
34%
43%
31%
49%
250-499
51%
36%
47%
51%
32%
34%
47%
34%
55%
500-999
53%
35%
52%
55%
34%
40%
52%
37%
57%
1000-9999
57%
34%
53%
59%
39%
42%
53%
36%
61%
10,000+
60%
Source: Cisco 2015 Security Capabilities Benchmark Study
Figure X. SMB Biggest Obstacles
Which of the Following do You Consider the Biggest Obstacles
to Adopting Advanced Security Processes and Technology?
Company Size 250-499 500-999 1000-9999
Budget Constraints 40% 39% 39% 41%
Compatibility Issues
with Legacy Systems
34% 30% 32% 34%
Competing Priorities 25% 25% 24% 24%
10,000+
Figure 34. SMB Biggest Obstacles
Figure 36. SMB Defenses Decrease in 2015
Source: Cisco 2015 Security Capabilities Benchmark Study
Figure X. SMB Defenses Decrease in 2015
Which—If Any—of These Types of Security Threat Defenses
Does Your Organization Currently Use? 2014 2015
Mobile Security 52% 42%
51%Secured Wireless 41%
Vulnerability Scanning 48% 40%
VPN 46% 36%
Security Information and Event Management (SIEM) 42% 35%
Network Forensics 41% 29%
Patching and Configuration 39% 29%
Endpoint Forensics 31% 23%
Penetration Testing 38% 32%
3939
Industry InsightsCisco 2016 Annual Security Report
Why is it significant that SMBs tend to use fewer defenses
than their larger counterparts? In a security environment
where attackers are developing more sophisticated
tactics for entering networks and remaining undetected, no
business can afford to leave its networks unprotected, or to
put off using processes that might offer insights on how a
compromise occurred so it can be avoided in the future.
In addition, SMBs may not realize that their own vulnerability
translates to risks for larger enterprise customers and
their networks. Today’s criminals often gain entry into one
network as a means to find an entry point into another,
more lucrative network—and the SMB may be the starting
point for such an attack.
LESS LIKELY TO HAVE EXPERIENCED
PUBLIC DATA BREACHES
SMBs are less likely than large enterprises to have dealt with
a public security breach, probably a result of their smaller
footprint from a network standpoint. While 52 percent of
enterprises with more than 10,000 employees have managed
the aftermath of a public security breach, only 39 percent of
businesses with fewer than 500 employees have done so.
Public security breaches are obviously disruptive and
damaging to a business, but they do offer one benefit:
They often encourage businesses to take a closer look at
their security protections and consider strengthening them.
Cisco survey data (see page 74) shows that when large
enterprises suffer a public data breach, they significantly
upgrade their security technology and implement
stronger processes.
SMBs’ view of their businesses as targets of cybercriminals
may demonstrate a gap in their perception of the threat
landscape. As illustrated above in Figure 38, 22 percent of
businesses with fewer than 500 employees said they do not
have an executive with direct responsibility and accountability
for security because they do not view themselves as
high-value targets.
Organiza
(Explana
with Dire
Source: Cisco 2015 Security Capabilities Benchmark Study
Figure X.SMBs Do Not Perceive Themselves as High-Value T
Is There an Executive at Your Organization Who
Has Direct Responsibility and Accountability for Security?
250-499
Company Size
89%
500-999
93%
1000-9999
92%
10,000+
92% 78%
NoYes
Yes
250-4
11% 7% 8% 8%
Figure 38. SMBs Do Not Perceive Themselves as
High-Value Targets
Enterprise 10,000+
Had to Manage a Public Security Breach
39%
52%
SMB 250-499
Figure X. SMBs Report Fewer Public Breaches;
Less Likely than Enterprises to Initiate
Changes in Response
Source: Cisco 2015 Security Capabilities Benchmark Study
Figure 37. SMBs Report Fewer Public Breaches
Organiza
(Explana
with Dire
Source: Cisco 2015 Security Capabilities Benchmark Study
Figure X.SMBs Do Not Perceive Themselves as High-Value T
Is There an Executive at Your Organization Who
Has Direct Responsibility and Accountability for Security?
250-499
Company Size
89%
500-999
93%
1000-9999
92%
10,000+
92% 78%
NoYes
Yes
250-4
11% 7% 8% 8%
Organization is Not a High-Value Target for Attackers.
(Explanation for Why an Organization Does Not Have an Executive
with Direct Responsibility and Accountability for Security).
Source: Cisco 2015 Security Capabilities Benchmark Study
Figure X.SMBs Do Not Perceive Themselves as High-Value Targets
Is There an Executive at Your Organization Who
Has Direct Responsibility and Accountability for Security?
250-499
Company Size Company Size
89%
500-999
93%
1000-9999
92%
10,000+
92%
22% 17%13%26%
74%78% 87% 83%
NoYes
NoYes
250-499 500-999 1000-9999 10,000+
11% 7% 8% 8%
SHARE
4040
Industry InsightsCisco 2016 Annual Security Report
Although the survey shows that more SMBs overall are
outsourcing some of their security functions, SMBs are
generally less likely than large enterprises to outsource
certain services, such as advice and consulting. For
example, 55 percent of large enterprises outsource advice
and consulting services, compared with 46 percent of
businesses with fewer than 500 employees. Fifty-six percent
of large enterprises outsource security auditing tasks,
compared with 42 percent of businesses with fewer than
500 employees (see Figure 39).
However, in 2015, more SMBs are outsourcing at least
some security services. In 2014, 24 percent of SMBs with
less than 499 employees said they did not outsource any
services. In 2015, only 18 percent of SMBs said the same.
The fact that more SMBs are adopting outsourcing as a
way to manage security is good news. It says that SMBs
are seeking flexible tools for securing networks that
do not place a burden on their smaller staffs or more
conservative budgets. However, SMBs may mistakenly
believe that outsourcing security processes will greatly
reduce the likelihood of a network breach. Or they may
place the onus for security on a third party. Such a
viewpoint would be wishful thinking, since only a truly
integrated threat defense system—one that examines and
mitigates attacks as well as prevents them—can provide
enterprise-level security protection.
SMBs MORE LIKELY TO OUTSOURCE SECURITY FUNCTIONS IN 2015
Source: Cisco 2015 Security Capabilities Benchmark Study
Figure X. More SMBs Outsource in 2015
Company Size
Advice and Consulting
Monitoring
Threat Intelligence
Incident Response
Auditing
Remediation
250-499
46%
45%
42%
39%
35%
33%
51%
46%
46%
44%
37%
38%
54%
42%
46%
44%
42%
36%
55%
44%
56%
40%
41%
36%
None 18% 12% 11% 10%
Why Does Your Organization (SMB 250-499) Choose to Outsource This/These Service(s)?
Lack of Internal
Experience
30%
More Cost-Efficient
55%
Lack of Internal Resources
(Software, Manpower)
31%
Desire for
Unbiased Insight
45%
More Timely Response
to Incidents
45%
1000-9999500-999 10,000+
When it Comes to Security, Which of the Following Types of Services, if Any, Are Outsourced Fully or in Part to Third Parties?
Figure 39. More SMBs Outsource Security Services in 2015
SHARE
4141
Industry InsightsCisco 2016 Annual Security Report
Cisco Security Capabilities
Benchmark Study
42
Security Capabilities Benchmark StudyCisco 2016 Annual Security Report
In the face of more sophisticated threats, the Cisco study
suggests that the confidence of security professionals
appears to be flagging. On the other hand, deepening
concerns about security are changing how these
professionals protect networks. For example, we are
seeing more security training, an increase in formal written
policies, and more outsourcing of tasks such as security
audits, consulting, and incident response. In short, security
professionals show signs that they are taking action to
combat the threats that loom over their networks.
The moves toward training and outsourcing are positive
developments, but the security industry can’t stop there.
It must continue to increase its use of tools and processes
to improve the detection, containment, and remediation of
threats. Given the barriers of budget limitations and solution
compatibility, the industry must also explore effective
solutions that provide an integrated threat defense. The
industry must also do a better job of collaborating with
other organizations when public breaches occur (such
as with the SSHPsychos botnet; see page 14), since
knowledge-sharing can help prevent future attacks.
To gauge the perceptions of security professionals on the state of
security in their organizations, Cisco asked chief security officers
(CSOs) and security operations (SecOps) managers in several
countries and at organizations of various sizes about their perceptions
of their security resources and procedures. The Cisco 2015 Security
Capabilities Benchmark Study offers insights on the maturity level of
security operations and security practices currently in use, and also
compares these results with those of the inaugural 2014 study.
Cisco Security Capabilities
Benchmark Study
Decline in Confidence Amid Signs of Preparedness
43
Security Capabilities Benchmark StudyCisco 2016 Annual Security Report
As security professionals become aware of threats,
they may be seeking ways to improve their defenses—
for example, by outsourcing security tasks that can be
managed more efficiently by consultants or vendors. In
2015, 47 percent of our surveyed companies outsourced
security audits, an increase from 41 percent in 2014.
Also in 2015, 42 percent outsourced incident response
processes, compared with 35 percent in 2014 (Figure 40).
In addition, more security professionals are outsourcing
at least some security functions. In 2014, 21 percent
of the survey respondents said they did not outsource
any security services. In 2015, that number dropped
significantly, to 12 percent. Fifty-three percent said they
outsource services because doing so was more cost-
efficient, while 49 percent said they outsource services
to obtain unbiased insights.
To add protection to their networks and data, security
professionals indicated that they are receptive to the
concept of hosting networks off-premises. While on-
premises hosting is still the favored option, the number of
professionals using off-premises solutions has increased.
In 2015, 20 percent used off-premises private cloud
solutions compared with 18 percent in 2014 (Figure 41).
Figure 41. Off-Premises Hosting on the Rise
Figure 40. Outsourced Services Overview
RESOURCES: ORGANIZATIONS MORE LIKELY TO OUTSOURCE
Advice and Consult.
Audit
Monitoring
Incident Response
Threat Intel.
Remediation
None/Internal
51%
41%
42%
35%
34%
21%
N/A
52%
47%
44%
42%
36%
12%
39%
More Cost–Efficient
Desire for Unbiased Insight
More Timely Response to Incidents
Lack of Internal Expertise
Lack of Internal Resources
53%
49%
46%
31%
31%
Why Are These Services Outsourced? † 2015 (n=1129)
Which Security Services Are Outsourced?
2014 (n=1738) 2015 (n=2432)
Figure X.
Outsourced Services Seen as Cost Effective
Source: Cisco 2015 Security Capabilities Benchmark Study
† Security respondents that outsource security services (2015; n=2129)
On-Premises Hosting of the Organization’s Networks is Still
the Most Common; However, Off-Premises Hosting Has
Increased Since Last Year
Figure X. Off-Premise Hosting on the Rise
2014 (n=1727) 2015 (n=2417)
On-Premises as Part of
a Private Cloud 50% 51%
Off-Premises Public Cloud 8% 10%
Off-Premises Private Cloud 18% 20%
On-Premises but Managed
by an External Third Party 23% 24%
On-Premises 54% 48%
Source: Cisco 2015 Security Capabilities Benchmark Study
44
Security Capabilities Benchmark StudyCisco 2016 Annual Security Report
The security teams surveyed by Cisco are more intent on
protecting their networks more effectively, but they may
be limited in their ability to carry out their plans. Security
professionals said that budget constraints (39 percent) top
the list of likely reasons to choose or reject security services
and tools, followed by technology compatibility issues
(32 percent; see Figure 42). Budget constraints become
more of a problem for enterprises that rank in the low and
lower-mid maturity levels (see Figure 43). In the responses
from all security professionals, 39 percent cite budget
constraints as an obstacle to adopting advanced security
processes. That figure is 43 percent of enterprises in
the low-maturity range, and 48 percent in the lower-mid
maturity range.
One sign that some organizations are giving more thought to
their security resources is how they structure their security
budget. The survey shows a slight increase in the number of
organizations that separate the security budget from overall
IT budget. In 2014, 6 percent of professionals said they had
completely separated security and IT budgets; in 2015, that
number rose to 9 percent (see Figure 44).
Figure X. Budget Constraints Are the Major Barrier to Security Upgrades
2015 (n=2432)Biggest Barriers to Adopting Advanced Security Processes and Technology
Upper Management Buy-In 20%
Reluctance to Purchase Until Proven 22%
Lack of Trained Personnel 22%
Organizational Culture/Attitude 23%
Lack of Knowledge 23%
Current Workload Too Heavy 24%
Competing Priorities 24%
Certification Requirements 25%
Compatibility Issues 32%
Budget Constraints 39%$
Source: Cisco 2015 Security Capabilities Benchmark Study
Figure 42. Budget Constraints Are the Major Barrier to Security Upgrades
FIgure X.
Budget Constraints as Biggest Obstacles to
Adopting Advanced Security Processes
and Technology
HighUpper-MidMiddleLower-Mid
38%38%39%
48%
43%
Low
Percentage of Respondents Seeing Budget Constraints
as the Biggest Obstacles (n=2432)
Source: Cisco 2015 Security Capabilities Benchmark Study
Figure 43. Budget Constraints Are Greater
Obstacle for Low-Maturity Companies
Completely Separate All Within ITPartially Within IT
6% 9% 33% 33% 61% 58%
$
$
A Minority of Organizations Still Have Security Budgets that Are
Completely Separate From it, but Incidence Has Increased.
Is the Security Budget Part of the IT Budget?
Figure X. Slight Increases in Organizations with
Separate Security Budgets
2014 (n=1720) 2015 (n=2417)
Source: Cisco 2015 Security Capabilities Benchmark Study
Figure 44. Slight Increase in Organizations with
Separate Security Budgets
SHARE
45
Security Capabilities Benchmark StudyCisco 2016 Annual Security Report
When organizations standardize on security policies or
seek certification, they show a commitment to improving
security. Nearly two-thirds of security professionals said
their organizations are certified on standardized security
policies or practices, or are in the process of becoming
certified (Figure 45). This is another positive sign that
enterprises see value in improving their security knowledge
and responding to threats.
Figure X. Majority of Organizations Are Certified or Seeking Certification
Preparing for the Certification Process
Currently in the Process
of Becoming Certified
Organization Follows Standardized Information Security Policy Practice (2015 n=1265)
63% Chemical Eng. or Mfg.
58% Non-Computer Mfg.
57% Transportation
46% Agriculture/Forestry/Fishing
44% Pharmaceuticals
36% Mining
70% Financial Services
70% Telecommunications
67% Healthcare
65% Government
64% Utilities/Energy
63% Other Industry
Already Certified
63%31%
7%
Source: Cisco 2015 Security Capabilities Benchmark Study
Figure 45. Most Organizations Are Certified or Seeking Certification
Figure 46. Firewalls and Data Loss Prevention Are Most Commonly Used Security Tools
In examining the use of security defenses, we found that
firewalls are the most commonly used security tools by
enterprises (65 percent), followed by data loss prevention
(56 percent) and authentication tools (53 percent; see
Figure 46). In 2015, enterprises were somewhat less likely to
rely on cloud-based tools. Although security professionals
have shown a willingness to outsource security services
(see page 43), they may be trending toward an in-house
deployment of tools. (See page 71 for full list.)
Security Threat Defenses Used by Organization
Defenses Administered Through Cloud-
Based Services (Security Respondents
Who Use Security Threat Defenses)
2014 (n=1738) 2014 (n=1646) 2015 (n=2268)2015 (n=2432)
Network, Security, Firewalls, and Intrusion Prevention* 60% N/A 35%
Email/Messaging Security 56% 52% 37% 34%
Encryption/Privacy/Data Protection 53% 53%
Data Loss Prevention 55% 56%
Authentication 52% 53%
Firewall* N/A 65% 31%
Web Security 59% 51% 37% 31%
*Firewall and intrusion prevention were one code in 2014: “Network security, firewalls, and intrusion prevention.”
Figure X. Firewalls and Data Loss Prevention Are Most Commonly Used Security Tools
Source: Cisco 2015 Security Capabilities Benchmark Study
46
Security Capabilities Benchmark StudyCisco 2016 Annual Security Report
CAPABILITIES: CONFIDENCE IS DOWN
In 2015, security professionals were less confident that
their security infrastructure is up to date than they were
in 2014. This decline in confidence is due, no doubt, to
the steady drumbeat of high-profile attacks on major
enterprises, the corresponding theft of private data, and
the public apologies from companies whose networks
have been breached.
However, this decline in confidence is accompanied by a
growing interest in developing stronger policies. As seen
in Figure 47, more companies (66 percent) have a written,
formal security strategy in 2015 than was the case in
2014 (59 percent).
Figure 48. Confidence Is Lower in 2015
As a sign that confidence is on the decline, security profes-
sionals show slightly less confidence in their technologies. In
2014, 64 percent said their security infrastructure was up to
date and constantly upgraded. In 2015, that number dropped
to 59 percent (Figure 48). Also, in 2014, 33 percent said their
organizations were not equipped with the latest security tools;
that number rose to 37 percent in 2015.
Confidence is somewhat higher among CSOs, who are more
optimistic than security operations managers: 65 percent
of CSOs believe their security infrastructure is up to date,
compared with 54 percent of SecOps managers. The
confidence of SecOps managers is likely to suffer because
they respond to day-to-day security incidents, giving them
a less positive view of their security readiness.
SHARE
Figure 47. More Organizations Create Formal
Security Policies
Source: Cisco 2015 Security Capabilities Benchmark Study
Figure X. Off-Premise Hosting on the Rise
2014 (n=1738)Security Standards 2015 (n=2432)
Written, Formal, Organization-
Wide Security Strategy that
is Reviewed Regularly
66%
Nearly Two-Thirds are Already Certified on a Standardized
Security Policy or Practice.
None of the Above 1% 1%
Follow a Standardized Information
Security Policy Practice Such
as ISO 27001
59%
52% 52%
54% 38%
Formally Define Critical Business
Assets that Require Special
Consideration for Risk
Management that Are Either
Business-Critical or Regulated to
Have Increased Protection
Figure X. Confidence is Lower in 2015
2014 (n=1738) 2015 (n=2432)
In 2015, Companies are Less Confident that Their Security Infrastructure is Up-to-Date; Budget is the Top Barrier to Upgrades.
Our Security Infrastructure is Very Up to Date, and is Constantly Upgraded
With the Best Technologies Available
We Replace or Upgrade Our Security Technologies on a Regular Cadence, but
Aren’t Equipped with the Latest-and-Greatest Tools
We Replace or Upgrade Our Security Technologies Only When Old Ones No
Longer Work or Are Obsolete, or When We Identify Completely New Needs
64% 59%
33% 37%
3% 5%
How Would You Describe Your Security Infrastructure?
Source: Cisco 2015 Security Capabilities Benchmark Study
47
Security Capabilities Benchmark StudyCisco 2016 Annual Security Report
Security professionals also show mixed levels of confidence
in terms of their ability to thwart attackers. Fifty-one percent
strongly believe they can detect security weaknesses before
they become full-blown incidents; only 45 percent are
confident in their ability to determine the scope of a network
compromise, and to remediate the damage (see Figure 49).
Security professionals also show weaker confidence levels in
their capability to defend their networks against attacks. For
example, in 2015, fewer professionals strongly believe that
they do a good job of building security into procedures for
acquiring, developing, and maintaining systems (54 percent
in 2015, compared with 58 percent in 2014; see Figure 50).
(See page 76 for full list.)
Figure 49. Mixed Confidence in Ability to Detect Compromises
SHARE
Figure X. Mixed Confidence in Ability to Detect Compromises
Our Security Infrastructure is Very Up
to Date, and is Constantly Upgraded
with the Best Technologies Available.
Source: Cisco 2015 Security Capabilities Benchmark Study
Percentage of Organizations Confident in Determining the Scope
of a Compromise and Remediating It
451 8 46
(2015 n=2432)
Percentage of Organizations Able to Detect Security Weaknesses
Before They Become Full-Blown Incidents
511 4 45
Strongly Disagree Strongly AgreeDisagree Agree
How Would You Describe Your Security Infrastructure?
59%
Figure 50. Lower Confidence in Ability to Build Security into Systems
Figure X. Lower Confidence in Ability to Build Security into Systems
Source: Cisco 2015 Security Capabilities Benchmark Study
We Do a Good Job of Building Security Into
Systems and Applications (%)
93
582 5 35
96
541 4 42
2015
n=2432
2014
n=1738
Strongly Disagree Strongly AgreeDisagree AgreeSecurity Policies
48
Security Capabilities Benchmark StudyCisco 2016 Annual Security Report
In some areas, confidence levels in security capabilities
are not very high. For example, in 2015, only 54 percent of
respondents said they believe they have a good system for
verifying that security incidents have actually occurred (see
Figure 51). (See page 77 for full list.)
Respondents are also not entirely confident that their systems
can scope and contain such compromises. Fifty-six percent
said they review and improve security practices regularly,
formally, and strategically; 52 percent believe their security
technologies are well integrated and work effectively
together (see Figure 52). (See page 79 for full list.)
Figure 51. Enterprises Believe They Have
Good Security Controls
Security Controls
We Have Good Systems for Verifying that Security Incidents
Actually Occurred
Source: Cisco 2015 Security Capabilities Benchmark Study
Security Controls
92
541 6 38
95
541 5 41
2015
n=2432
2014
n=1738
Strongly Disagree Strongly AgreeDisagree Agree
We Review and Improve Our Security Practices
Regularly, Formally, and Strategically Over Time
Strongly Disagree Strongly AgreeDisagree Agree
94
561 4 38
96
561 4 40
2015
n=2432
2014
n=1738
Our Security Technologies are Well Integrated to
Work Effectively Together
94
562 5 38
95
521 4 43
2015
n=2432
2014
n=1738
It is Easy to Determine the Scope of a Compromise,
Contain it, and Remediate From Exploits
89
362 9 43
91
451 8 46
2015
n=2432
2014
n=1738
Security Operationalization
Figure X. Enterprises Lack Confidence in Ability to Contain Compromises
Source: Cisco 2015 Security Capabilities Benchmark Study
Figure 52. Enterprises Express Mixed Confidence in
Ability to Contain Compromise
SHARE
49
Security Capabilities Benchmark StudyCisco 2016 Annual Security Report
Similar to the respondents in 2014, more than one-fourth of the security professionals in 2015 said they perceive their security
tools to be only somewhat effective (Figure 53).
Figure X. One-Fourth of Enterprises Believe Security Tools Are Only Somewhat Effective
Not at All ExtremelyNot Very Somewhat Effective VeryEffectiveness of Security Tools
Similar to Last Year, Over a Quarter Perceive Their Security Tools to be Only “Somewhat” Rather Than “Very” or “Extremely” Effective
Blocking Against Known Security Threats 73
230 3 24 50
75
240 2 5123
2015
n=2432
2014
n=1738
Detecting Network Anomalies and Dynamically
Defending Against Shifts in Adaptive Threats
70
210 4 27 49
70
210 2 4928
2015
n=2432
2014
n=1738
Enabling Us to Enforce Security Policies 71
201 3 27 51
70
200 2 5028
2015
n=2432
2014
n=1738
Enabling Us to Assess Potential Security Risks
70
221 4 26 48
69
190 2 5029
2015
n=2432
2014
n=1738
Determining the Scope of a Compromise,
Containing It, and Remediating Further Exploits
67
190 3 30 48
68
190 2 4930
2015
n=2432
2014
n=1738
Source: Cisco 2015 Security Capabilities Benchmark Study
Figure 53. One-Fourth of Enterprises Believe Security Tools Are Only Somewhat Effective
50
Security Capabilities Benchmark StudyCisco 2016 Annual Security Report
Public security breaches tend to be a defining moment
for organizations. Once they occur, organizations seem
to become more aware of the need to prevent future
breaches. However, in 2015, fewer security professionals
said their organizations had to deal with public security
breaches: they made up 53 percent of the professionals
in 2014, and 48 percent in 2015 (Figure 54).
Professionals acknowledge the value that breaches have in
terms of delivering a wake-up call about the importance of
strengthening security processes: 47 percent of the security
professionals affected by public breaches said the breaches
resulted in better policies and procedures. For example,
43 percent of the respondents said they increased security
training after a public breach, and 42 percent said they
increased investments in security defense technologies.
The good news is that organizations that have suffered
a public breach are increasingly likely to strengthen
their security processes. In 2015, 97 percent of security
professionals said they conduct security training at least
once a year, a solid increase from 82 percent in 2014
(see Figure 90 on page 82).
Figure 54. Public Breaches Can Improve Security
Has Your Organization Ever Had to Manage Public Scrutiny
of a Security Breach?
Figure X. Public Breaches Can Improve Security
(n=1701) (n=1347)
48%Yes
53%Yes
VS
20152014
How Much Did the Breach Drive Improvements in Your Security
Threat Defense Policies, Procedures, or Technologies? (n=1134)
Not at All A LotSomewhatNot Very
10%1% 42% 47%
Source: Cisco 2015 Security Capabilities Benchmark Study
SHARE
Figure 55. More Organizations Conduct Security Training
Figure X.
More Organizations Conduct Security Training
43%
Source: Cisco 2015 Security Capabilities Benchmark Study
In 2015, 43 percent of respondents said they increased security
training after a public breach.
51
Security Capabilities Benchmark StudyCisco 2016 Annual Security Report
MATURITY: BUDGET CONSTRAINTS RANK
HIGH AT EVERY LEVEL
As organizations deploy more sophisticated security practices
and policies, their perceptions of their security readiness
may shift. The Cisco 2015 Security Capabilities Benchmark
Study places survey respondents and their organizations
into five maturity categories, based on responses about
their security processes (Figure 56). The study examines
how different characteristics such as capabilities, industries,
and countries may affect maturity levels.
Interestingly, organizations at different maturity levels
seem to share some of the obstacles to implementing
more sophisticated security processes and tools. Although
the exact percentages may vary, the challenge of budget
constraints ranks at the top of the list at every level of
maturity (Figure 57).
Figure 57. Obstacles to Adopting Better Security Not Affected by Maturity Level
Figure 56. Maturity Model Ranks Organizations
Based on Security Processes
Figure X. Maturity Model Ranks Organizations
Based on Secuirty Processes
Cisco explored several options for sample segmentation before
selecting a five-segment solution based on a series of questions
targeting security processes. The five-segment solution maps
fairly closely to the Capability Maturity Model Integration (CMMI).
Low
Upper–
Middle
Lower–
Middle
High
Middle
5–Segment–Based Solution
Optimizing
Quantitatively
Managed
Defined
Repeatable
Initial
Focus Is on Process Improvement
Processes Quantitatively Measured
and Controlled
Processes Characterized for the
Organization; Often Proactive
Processes Characterized for
Projects; Often Reactive
Processes Are Ad Hoc,
Unpredictable
1
2
3
4
5
Level
Source: Cisco 2015 Security Capabilities Benchmark Study
Figure X. Obstacles to Adopting Better Secuirty not Affected by Maturity Level
Which of the Following Do You Consider the Biggest Obstcles to Adopting Advanced Security Processes and Technology?
Sophistication Level Low Upper–Middle HighLower–Middle Middle
Budget Constraints
Competing Priorities
39%41% 48% 38%38%
Upper Management
Buy-In
20%14% 20% 19%22%
Lack of Trained
Personnel
26%19% 27% 22%26%
Competing Priorities 26%14% 17% 25%27%
22%21% 27% 23%19%
Lack of Knowledge
About Adv. Security
Processes and Tech
25%31% 20% 22%23%
Reluctant to Purchase
Until They Are Proven
in the Market
Current Workload Too
Heavy to Take on New
Responsibilities
24%12% 25% 19%25%
Organizational Culture
Attitude About Security
22%31% 23% 22%25%
36% 23% 22%25%25%
Compatibility Issues
with Legacy Systems
29%21% 28% 33%34%
52
Security Capabilities Benchmark StudyCisco 2016 Annual Security Report
The chart to the right maps the quality of the security
infrastructure and maturity levels of various industries. It is
based on survey respondents’ perceptions of their security
processes. The industries that appear in the upper-right
quadrant show the highest levels of maturity as well as
infrastructure quality.
The chart below shows placement in Cisco’s maturity
levels by industry. In 2015, nearly half of transportation
and pharmaceutical organizations surveyed are in the
high-maturity segment. Telecommunications and utilities
are less likely to be in the high-maturity segment in 2015,
compared to 2014. The results are based on survey
respondents’ perceptions of their security processes.
Figure 58. Gauging Security Maturity by
Infrastructure and Industry
SHARE
Figure 59. Maturity Levels by Industry
Source: Cisco 2015 Security Capabilities Benchmark Study
Figure X. Maturity Levels by Industry
Segment Distribution by Industry
Sophistication Level Low Upper–Middle HighLower–Middle Middle
Chemical Engineering 1% 6% 39%21% 33%
Financial Services 1% 10% 38%26% 26%
Government 3% 10% 34%28% 25%
Healthcare 1% 10% 37%30% 22%
Non-Computer-
Related Manufacturing
1% 10% 32%34% 22%
Pharmaceutical 2% 3% 44%30% 21%
Transportation 1% 5% 46%28% 20%
Utilities/Energy 1% 15% 23%28% 32%
Telecommunications 2% 11% 33%26% 28%
Figure X. Gauging Security Maturity by
Infrastructure and Industry
Utilities/Energy
Non-Computer–Related
Manufacturing
Telecommunications
Pharmaceuticals
Other
Mining
Transportation
Healthcare
Chemical
Engineering
Manufacturing
Government
Financial Services:
Banking, Insurance
Source: Cisco 2015 Security Capabilities Benchmark Study
Middle Upper Middle High
ConstantUpdate,
LatestTech
RegularUpgrade
Cadence
53
Security Capabilities Benchmark StudyCisco 2016 Annual Security Report
Source: Cisco 2015 Security Capabilities Benchmark Study
Figure X. Maturity Levels by Country
Segment Distribution by Country 2014 (n=1637) 2015 (n=2401)
Sophistication Level Low2014 Upper–Middle HighLower–Middle Middle
United States 22%2% 4% 45%27%
Brazil
1% 9% 40%26%
Germany
1% 12% 39%24%
Italy
4% 3% 34%23%
United Kingdom
0% 14% 32%22%
Australia
1% 5% 29%36%
China
0% 6% 32%25%
India
24%
36%
32%
29%
37%
21%
34%
1% 4% 40%34%
Japan
2% 16% 32%16%
27%3% 10% 44%16%
2% 5% 34%35%
1% 4% 43%25%
1% 23% 38%25%
8% 8% 41%18%
9% 7% 30%35%
0% 3% 36%29%
27%
24%
24%
13%
25%
19%
32%
20%
14%
7% 3% 16%
7% 15% 32%40%
20%Mexico 6% 8% 50%16%
27%Russia 1% 14% 32%26%
35%France 1% 15% 29%20%
54%
The chart below shows placement in Cisco’s maturity levels
by country. The results are based on survey respondents’
perceptions of their security processes.
The chart to the right maps the quality of the security
infrastructure, and maturity levels, of various countries. The
countries that appear in the upper-right quadrant show the
highest levels of maturity as well as infrastructure quality. It’s
important to note that these findings are based on security
professionals’ perceptions of their security readiness.
Figure X. Gauging Security Maturity by
Infrastructure and Country
Japan
France
Russia
Germany
Mexico
Italy
China
Brazil
India
U.S.
U.K.
Australia
Source: Cisco 2015 Security Capabilities Benchmark Study
Middle Upper Middle HighConstantUpdate,
LatestTech
RegularUpgrade
Cadence
Figure 60. Gauging Security Maturity by
Infrastructure and Country
Figure 61. Maturity Levels by Country
SHARE
54
Security Capabilities Benchmark StudyCisco 2016 Annual Security Report
RECOMMENDATIONS: RESPONDING TO
THE REALITY CHECK
As our Security Benchmark Capabilities Study shows,
reality has set in for security professionals. Security
professionals’ confidence in their readiness to block
attackers is wavering. However, the reality checks provided
by high-profile exploits have had a positive effect on the
industry, judging from the uptick in security training and
formal policy development. In addition, the more frequent
outsourcing of audits and incident response services
indicates that defenders are searching for expert help.
Enterprises should continue to raise their awareness of
their security preparedness, and security professionals
must champion the growth of budgetary outlays to support
technology and personnel. In addition, confidence will rise
when security practitioners deploy tools that can not only
detect threats, but also contain their impact and boost
understanding of ways to prevent future attacks.
55
Security Capabilities Benchmark StudyCisco 2016 Annual Security Report
A Look Forward
56
A Look ForwardCisco 2016 Annual Security Report
In the post–Edward Snowden era, the geopolitical landscape
for Internet governance has changed dramatically. There
is now pervasive uncertainty surrounding the free flow of
information across borders. The landmark case brought
by the Austrian privacy activist Max Schrems against the
social networking giant Facebook had perhaps the biggest
impact, leading the Court of Justice of the European Union
(CJEU) to overturn the U.S. Safe Harbor agreement on
October 6, 2015.⁷
Consequently, companies are now forced to rely on
mechanisms and legal safeguards other than Safe Harbor
when transferring data out of the EU to the United States—
which are, in turn, subject to investigation. Data companies
are still trying to assess the fallout from this move. And
while EU and U.S. authorities have been working on a
replacement for Safe Harbor for the last two years, there
are concerns about the anticipated new mechanism. It
could either fail to materialize by the January 2016 deadline
or, perhaps more likely, fail to restore market confidence
if it does not fully address the concerns of the CJEU and
proves once more to be at risk of invalidation.⁸
Data protection experts expect Safe Harbor 2.0 to be no
less controversial than its predecessor. It may even follow
the same path by being challenged in court and also
declared invalid.⁹
End-to-end encryption—how it benefits consumers and
organizations, and the challenges it creates for law
enforcement in their investigations of criminal and terrorist
activity—will also be a topic of much debate between
governments and industry in the year ahead. The terrorist
attacks in Paris in November 2015 have some policymakers
pushing even harder to give investigators the ability to
access the content of encrypted communications.¹⁰ This
could give additional momentum to the development of
Safe Harbor 2.0, as civil liberties concerns take a back seat
to security concerns.
Geopolitical Perspective: Uncertainty in the Internet Governance Landscape
A Look Forward
Cisco geopolitical experts offer insight on the changing landscape for
Internet governance, including changes in data transfer legislation and
the debate over the use of encryption. Also featured in this section
are select findings from two Cisco studies. One examines executives’
concerns about cybersecurity. The other focuses on IT decision-
makers’ perceptions about security risk and trustworthiness. We
also give an overview of the value of an integrated threat defense
architecture and provide an update on Cisco’s progress in reducing
time to detection (TTD).
⁷ “The Court of Justice declares that the Commission’s U.S. Safe Harbour Decision is invalid,” CJEU, October 6, 2015:
http://curia.europa.eu/jcms/upload/docs/application/pdf/2015-10/cp150117en.pdf.
⁸ “Safe Harbor 2.0 framework begins to capsize as January deadline nears,” by Glyn Moody, Ars Technica, November 16, 2015:
http://arstechnica.com/tech-policy/2015/11/safe-harbour-2-0-framework-begins-to-capsize-as-january-deadline-nears/.
⁹ “Safe Harbor 2.0 framework begins to capsize as January deadline nears,” by Glyn Moody, Ars Technica, November 16, 2015:
http://arstechnica.com/tech-policy/2015/11/safe-harbour-2-0-framework-begins-to-capsize-as-january-deadline-nears/.
¹⁰ “Paris Attacks Fan Encryption Debate,” by Danny Yadron, Alistair Barr, and Daisuke Wakabayashi, The Wall Street Journal, November 19, 2015:
http://www.wsj.com/articles/paris-attacks-fan-encryption-debate-1447987407.
57
A Look ForwardCisco 2016 Annual Security Report
Amid such uncertainty, what should organizations ask
data providers in order to make sure that their business
is in compliance with data transfer regulations? In the
short term, they should certainly seek assurances from
vendors that they are using EU Model Contract Clauses or
Binding Corporate Rules—and not just Safe Harbor—when
transferring data out of the EU.
Another major geopolitical issue that organizations should
monitor relates to vulnerabilities and exploits. Some
governments are expressing great concern about the
rise of a market for unpatched vulnerabilities—so-called
weaponized software. Such tools are vital to the security
research community as it looks for ways to protect
networks around the globe. But in the wrong hands,
particularly those of repressive regimes, this technology,
intended for good, could be used for financial crime, to
steal national and commercial secrets, suppress political
dissent, or disrupt critical infrastructure.
How to restrict access to unpatched vulnerabilities without
tying the hands of those conducting vital research is an issue
that governments will clearly wrestle with in the coming
months and years. As governments attempt to tackle
this thorny problem, they need to carefully assess how
their policymaking decisions affect security. For example,
the uncertainty about laws that govern the transmission
of information about unpublished vulnerabilities could chill
the advancement of security threat research, or encourage
the publication of vulnerabilities before vendors have an
opportunity to patch them. Any approach to resolving this
uncertainty should be compatible across the globe.
Cybersecurity Concerns Weigh on
Minds of Executives
Obviously, in-depth security can help enterprises avoid
calamitous breaches and attacks. But can it help improve the
chances of a company’s success? According to an October
2015 Cisco study of finance and line-of-business executives
regarding cybersecurity’s role in business and digital strategy,
enterprise executives understand that protecting their
businesses from threats may dictate whether they succeed
or fail. As organizations become more digitized, growth will
depend on their ability to protect the digital platform.
As the survey shows, cybersecurity is a growing concern
for executives: 48 percent said they were very concerned,
and 39 percent said they were moderately concerned, about
cybersecurity breaches. This concern is on the rise; 41 percent
said they were much more concerned about security breach-
es than they were three years ago, and 42 percent said they
were a little more concerned than before.
Business leaders are also anticipating that investors
and regulators will ask tougher questions about security
processes, just as they ask questions about other business
functions. Ninety-two percent of the respondents agreed that
regulators and investors will expect companies to provide
more information on cybersecurity risk exposure in the future.
Enterprises also appear to have a keen sense of the cyber-
security challenges they face. The inability of cybersecurity
policies to keep pace with business change was the most
common challenge cited, followed by the lack of metrics to
determine security effectiveness (Figure 62).
Figure 62. Enterprises Face Tough Cybersecurity Challenges
Source: Cisco Security Research
Figure X. Enterprises Face Tough Cybersecurity Challenges
32%
24%
21%
Do Not Know Our
Major Cybersecurity
Vulnerabilities
Ineffective Enforcement
of Cybersecurity Policies
26%
Insufficient Investment
in Cybersecurity
27%
Lack of the Right Metrics to
Determine Cybersecurity
Effectiveness
Inability of Cybersecurity
Policy to Keep Up with the
Pace of Business Change
58
A Look ForwardCisco 2016 Annual Security Report
About a third of executives are also worried about their ability
to safeguard critical data. When asked to name the types
of information that are most difficult to protect, 32 percent
selected “confidential financial information.” Respondents
named “customer information” and “confidential business
information” as the next two most difficult types of data to
protect (see Figure 63).
Trustworthiness Study: Shining a
Light on the Risks and Challenges
for Enterprises
The relentless rise in information security breaches
underscores the deep need for enterprises to trust
that their systems, data, business partners, customers,
and citizens are safe. We are seeing trust become a
major factor for businesses selecting IT and networking
infrastructure. In fact, many are now requiring that security
and trustworthiness be integrated throughout the product
lifecycle of the solutions that comprise their infrastructure.
In October 2015, Cisco conducted a study to assess
IT decision-makers’ perceptions of their security risks
and challenges and to determine the role that IT vendor
trustworthiness plays in their IT investments. We surveyed
both information security and non-information-security
decision-makers at organizations in several countries.
(See the Appendix for more details on the Security Risk
and Trustworthiness Study, including our methodology.)
FOLLOWING ARE SELECT FINDINGS
FROM OUR RESEARCH:
We found that 65 percent of the respondents think that
their organization faces a significant level of security risk—
namely, from the use of mobility, IT security, and cloud-
based solutions in the enterprise (Figure 64).
Figure 63. Executives Concerned About
Securing Critical Data
Source: Cisco Security Research
Customer
Information
(Transactional Data)
Confidential Financial
Information
Confidential
Business
Information
(Operational Data)
32% 31%
30%
Figure X. Executives Concerned About
Securing Critical Data
Figure 64. Perceptions of Security Risk
Enterprises believe the following areas of their organization’s
infrastructure are at a high risk for a security breach:
50%
Mobility Cloud-Based
42%
of respondents think their
organizations are threatened
65%
IT Security
43%
Source: Security Risk and Trustworthiness Study, Cisco
Figure X. Perceptions of Security Risk
SHARE
59
A Look ForwardCisco 2016 Annual Security Report
Sixty-eight percent of the respondents to our study
identified malware as the top external security challenge
that their organization faces. Phishing and advanced
persistent threats rounded out the top three responses—
at 54 percent and 43 percent, respectively (see Figure 65).
As for internal security challenges (see Figure 66), more
than half (54 percent) of our respondents cited malicious
software downloads as the top threat, followed by internal
security breaches by employees (47 percent), and hardware
and software vulnerabilities (46 percent).
We also found that most enterprises (92 percent) employ
a dedicated security team within their organization.
Eighty-eight percent of respondents reported that they
have a formal, organization-wide security strategy that
is renewed regularly. However, only 59 percent have
standardized policies and procedures in place to validate
IT vendor trustworthiness (see Figure 67).
In addition, about half (49 percent) of large enterprise
organizations keep their security infrastructure up to date
with the most current technologies, and most others
upgrade their infrastructure regularly. Very few wait
to upgrade until the technology they use is obsolete,
according to our study.
Figure 65. External Challenges Faced
(Total Respondents)
Source: Security Risk and Trustworthiness Study, Cisco
Figure X.
External Challenges Faced (Total Respondents)
I Do Not Consider
Any of These to Be Challenges
for My Organization
Advanced Persistent Threats 43%
Denial of Service Attacks 38%
Brute-Force Attacks 35%
Zero-Day Attacks 35%
3%
Phishing 54%
Malware 68%
Figure 66. Internal Security Challenges Faced
(Total Respondents)
Source: Security Risk and Trustworthiness Study, Cisco
Figure X.
Internal Challenges Faced (Total Respondents)
54%Malicious Software Downloads
Internal Security Breaches
by Employees 47%
46%
Hardware or Software
Vulnerabilities
Employees Using Their Own Devices/
Software/Cloud Apps to Do Business
43%
Lack of Employee Awareness 39%
IT Security Staff Is Not
Adequately Trained
26%
I Do Not Consider Any of These to Be
Challenges for My Organization
5%
Figure 67. Most Large Enterprises Have a Dedicated
Security Team In-House
92%
Dedicated
Security Team
Standardized
Validation Policies
and Procedures
59%
Organization-Wide
Security Strategy
88%
Source: Security Risk and Trustworthiness Study, Cisco
Figure X. Most Large Enterprises Have a
Dedicated Security Team In-House
SHARE
60
A Look ForwardCisco 2016 Annual Security Report
In today’s threat-centric landscape, confidence
in a vendor’s processes, policies, technologies,
and people—and the ability to verify them—are
foundational to building a lasting, trusted relationship
between vendors and enterprises.
Technology vendors demonstrate trustworthiness by:
•• Building security into their solutions and the value
chain from inception
•• Having and following policies and processes in
place that reduce risk
•• Creating a security-aware culture
•• Responding to breaches quickly and transparently
•• Providing rapid remediation and constant
vigilance after an incident
How Vendors Can Demonstrate Trustworthiness
Upgrading infrastructure is good practice, of course.
Organizations of all sizes need to deploy a secure, trustworthy
infrastructure in which security is designed into all facets
of the network. However, they can also help to shrink the
attack surface by fostering an open, security-aware culture.
Building this culture requires that organizations implement
consistent, enterprise-wide policies and processes
that ensure security is embedded into every aspect
of the business. They must then work to extend this
security-centric mindset to their ecosystem of partners
and suppliers, and continually work to demonstrate
transparency and accountability with customers,
partners, and other stakeholders.
Time to Detection: The Race to Keep
Narrowing the Window
We define “time to detection,” or TTD, as the window of
time between the first observation of an unknown file and
the detection of a threat. We determine this time window
using opt-in security telemetry gathered from Cisco
security products deployed around the globe.
The “retrospectives” category in Figure 68 shows the
number of files that Cisco initially categorized as
“unknown” and later converted to “known bad.”
As reported in the Cisco 2015 Midyear Security Report,
the median TTD was about two days (50 hours).
Figure 68. Time to Detection, December 2014–October 2015
Source: Cisco Security Research
Dec. 2014 Oct. 2015
Figure X. Time to Detection, December 2014 – November 2015
112766 112664
96106
197158
286457
379366
205601 192975
150480 154353
20.4
17.5
50.3
46.4 44.5 44.4
49.3
41.4
34.3 32.8
27.0
Median TTD
20
40
60
Hours
Retrospectives
185539
61
A Look ForwardCisco 2016 Annual Security Report
From January to March, the median TTD was roughly the
same—between 44 and 46 hours, but with a slight trend
downward. In April, it had edged up slightly to 49 hours.
However, by the end of May, TTD for Cisco had decreased
to about 41 hours.
The industrialization of hacking and the greater use of
commodity malware have played an important role in our
ability to narrow the window on TTD. As soon as a threat
becomes industrialized, it becomes more widespread and
thus easier to detect.
However, we also suggest that the combination of sophisti-
cated threat defenses and close collaboration among skilled
security researchers has been perhaps even more critical to
our ability to consistently and significantly reduce the median
TTD over the course of 2015.
The TTD comparison in Figure 69 shows that many
threats in June were being caught within around 35.3
hours. By September, more threats were being stopped
within around 17.5 hours. Again, we attribute the reduction
in median TTD partly to a faster identification of commodity
malware, such as Cryptowall 3.0, Upatre, and Dyre. The
integration of new technologies, such as those from
ThreatGRID, a Cisco company, is another factor.
However, even with the narrowed time window for
TTD, some threats remain harder to detect than others.
Downloaders that target Microsoft Word users are
typically the easiest to detect (<20 hours). Adware and
browser injections are among the most difficult threats to
detect (<200 hours).
One reason the latter threats are so challenging to detect
is that they are typically designated as a lower priority by
security teams, and are therefore often overlooked in the
race to deflect adversaries’ onslaught of zero-day attacks
(see “Browser Infections: Widespread—and a Major Source
of Data Leakage” on page 16).
Figure 70 provides an overview of the types of threats that
usually come to light within 100 days.
Figure X. Tag Cloud for 100 Days
Source:Cisco Security Research
CrossRider
PennyBee
ConvertAd
Wajam
NetFilterElex
OptimizerPro
StartPage
Systweak
Yotoon
MyPCBackup
BitCocktail
AddLyrics
SupTab
Compete Downloader
Esprot
Generik
GigaClicks
Kranet
MultiPlug
Linkury
MyWebSearch
OpenCandy
InstallCore
Visicom
Spigot
SpeedingUpMyPC
RuKometa
Sharik
Dagava
Browse Fox
Figure 69. Time to Detection Comparison,
December 2014 to October 2015
Figure 70. Tag Cloud for 100 Days
SHARE
Since that time, the median TTD has been on a
rapid decline. By October, Cisco had reduced
the median TTD to about 17 hours—less than
one day. This far outpaces the current industry
estimate for TTD (100 to 200 days). The speed
is due to the inclusion of more detail about how
short-lived infections are mitigated.
Figure X.
Time to Detection Comparison,
June vs September 2015
Source: Cisco Security Research
VS 17.5Hours
Oct. (Median)
35.3Hours
June (Median)
62
A Look ForwardCisco 2016 Annual Security Report
The Six Tenets of Integrated
Threat Defense
In the Cisco 2015 Midyear Security Report, Cisco security
experts asserted that the need for adaptive, integrated
solutions will lead to major changes in the security
industry within the next five years. The outcomes will be
industry consolidation and a unified movement toward a
scalable, integrated threat defense architecture. Such an
architecture will provide visibility, control, intelligence, and
context across many solutions.
This “detection and response” framework will make
possible a faster response to both known and emerging
threats. At the core of this new architecture will be a
visibility platform that delivers full contextual awareness and
is continuously updated to assess threats, correlate local
and global intelligence, and optimize defenses. The intent
of this platform is to build a foundation that all vendors can
operate on and contribute to. With visibility, there is more
control, which leads to better protection across more threat
vectors and the ability to thwart more attacks.
Below, we present six tenets of integrated threat defense
to help organizations, and their security vendors, better
understand the intent and potential benefits of this architecture:
1.	 A richer network and security architecture is needed
to address the growing volume and sophistication of
threat actors.
For the past 25 years, the traditional model for security
has been “See a problem, buy a box.” But these
solutions, often a collection of technologies from many
different security vendors, don’t talk to each other in any
meaningful way. They produce information and intelligence
about security events, which are integrated into an event
platform and then analyzed by security personnel.
An integrated threat defense architecture is a detection
and response framework that offers more capabilities
and supports faster threat responses by collecting
more information from deployed infrastructure in an
automated, efficient manner. The framework observes
the security environment more intelligently. Instead
of just alerting security teams to suspicious events
and policy violations, it can paint a clear picture of the
network and what’s happening on it to help inform
better decision-making around security.
2.	 Best-in-class technology alone cannot deal with the
current—or future—threat landscape; it just adds to
the complexity of the networked environment.
Organizations invest in “best in class” security
technologies, but how do they know if those solutions
are really working? The headlines about major security
breaches over the past year are evidence that many
security technologies aren’t working well. And when
they fail, they fail badly.
A proliferation of security vendors offering best-in-
class solutions doesn’t help to improve the security
environment unless those vendors offer radically
different—not just slightly different—solutions from
those of their competitors. But today, there are no stark
differences in many offerings from leading vendors in
most core areas of security.
3.	 More encrypted traffic will require an integrated
threat defense that can converge on encrypted
malicious activity that renders particular point
products ineffective.
As discussed in this report, encrypted web traffic is on
the rise. There are good reasons for using encryption,
of course, but encryption also makes it challenging for
security teams to track threats.
The answer to the encryption “problem” is to have more
visibility into what’s happening on devices or networks.
Integrated security platforms can help to provide this.
4.	 Open APIs are crucial to an integrated threat
defense architecture.
Multivendor environments need a common platform that
provides greater visibility, context, and control. Building
a front-end integration platform can support better
automation and bring better awareness into the security
products themselves.
5.	 An integrated threat defense architecture requires
less gear and software to install and manage.
Security vendors should strive to offer platforms that
are as feature-rich as possible and that offer extensive
functionality on one platform. This will help to reduce
the complexity and fragmentation in the security
environment that create too many opportunities for
easy access and concealment for adversaries.
63
A Look ForwardCisco 2016 Annual Security Report
6.	 The automation and coordination aspects of an
integrated threat defense help to reduce time to
detection, containment, and remediation.
Reducing false positives helps security teams focus on
what matters most. Contextualization supports a front-
line analysis of events underway, helps teams assess
whether those events require immediate attention,
and can ultimately produce automated responses
and deeper analytics.
Power in Numbers: The Value of
Industry Collaboration
Industry collaboration is essential not only to developing
a future architecture for integrated threat defense that
will enable faster threat response, but also for keeping
pace today with a global community of increasingly bold,
innovative, and persistent threat actors. Adversaries are
becoming only more adept at deploying hard-to-detect and
highly profitable campaigns. Many now employ legitimate
assets in the infrastructure to support their campaigns—and
with great success.
Given this landscape, it is not surprising that the defenders
surveyed for our Cisco 2015 Security Capabilities Benchmark
Study are less confident in their ability to help secure their
organization. We suggest that defenders consider the
powerful impact that proactive and continuous industry
collaboration can have in bringing cybercriminal activity to
light, undermining adversaries’ ability to generate revenue,
and reducing the opportunity to launch future attacks.
As discussed in depth earlier in this report (see “Featured
Stories,” starting on page 10), collaboration between a Cisco
Partner Contributor and within our Cisco Collective Security
Intelligence (CSI) ecosystem, and cooperation with service
providers, were significant factors in Cisco’s ability to
uncover, verify, and sideline global operations involving the
Angler exploit kit, and to weaken one of the largest DDoS
botnets our researchers have ever observed, SSHPsychos.
64
A Look ForwardCisco 2016 Annual Security Report
About Cisco
65
Cisco 2016 Annual Security Report About Cisco
Threat researchers from the Cisco Collective Security
Intelligence (CSI) ecosystem bring together, under a single
umbrella, the industry’s leading threat intelligence, using
telemetry obtained from the vast footprint of devices and
sensors, public and private feeds, and the open-source
community at Cisco. This amounts to a daily ingest of
billions of web requests and millions of emails, malware
samples, and network intrusions.
Our sophisticated infrastructure and systems consume
this telemetry, helping machine-learning systems and
researchers to track threats across networks, data centers,
endpoints, mobile devices, virtual systems, web, email, and
from the cloud to identify root causes and scope outbreaks.
The resulting intelligence is translated into real-time
protections for our products and services offerings that
are immediately delivered globally to Cisco customers.
To learn more about Cisco’s threat-centric approach to
security, visit www.cisco.com/go/security.
Contributors to the Cisco
2016 Annual Security Report
TALOS SECURITY INTELLIGENCE AND
RESEARCH GROUP
Talos is Cisco’s threat intelligence organization, an elite
group of security experts devoted to providing superior
protection
for Cisco customers, products, and services.
Talos is comprised of leading threat researchers supported
by sophisticated systems to create threat intelligence for
Cisco products that detect, analyze, and protect against
known and emerging threats. Talos maintains the official
rule sets of Snort.org, ClamAV, SenderBase.org, and
SpamCop, and is the primary team that contributes threat
information to the Cisco CSI ecosystem.
ADVANCED SERVICES CLOUD AND IT
TRANSFORMATION, OPTIMIZATION TEAM
The team provides recommendations and optimizes
networks, data center, and cloud solutions for the largest
service providers and enterprises around the world. This
consulting offer focuses on maximizing the availability,
performance, and security of clients’ critical solutions. The
optimization service is delivered to more than 75 percent
of Fortune 500 companies.
About Cisco
Cisco delivers intelligent cybersecurity for the real world, providing
one of the industry’s most comprehensive advanced-threat protection
portfolios of solutions across the broadest set of attack vectors.
Cisco’s threat-centric and operationalized approach to security
reduces complexity and fragmentation while providing superior
visibility, consistent control, and advanced threat protection before,
during, and after an attack.
66
About CiscoCisco 2016 Annual Security Report
ACTIVE THREAT ANALYTICS TEAM
The Cisco Active Threat Analytics (ATA) team helps
organizations defend against known intrusions, zero-day
attacks, and advanced persistent threats by taking advantage
of advanced big data technologies. This fully managed
service is delivered by our security experts and our global
network of security operations centers. It provides constant
vigilance and on-demand analysis 24 hours a day, seven
days a week.
CISCO THOUGHT LEADERSHIP ORGANIZATION
The Cisco Thought Leadership Organization illuminates the
global opportunities, market transitions, and key solutions
that transform organizations, industries, and experiences.
The organization provides an incisive and predictive lens
into what firms can expect in a rapidly changing world—and
how they can best compete. Much of the team’s thought
leadership focuses on helping organizations become digital
by bridging physical and virtual environments—seamlessly
and securely—to innovate faster and achieve their desired
business outcomes.
COGNITIVE THREAT ANALYTICS
Cisco’s Cognitive Threat Analytics is a cloud-based service
that discovers breaches, malware operating inside protected
networks, and other security threats by means of statistical
analysis of network traffic data. It addresses gaps in
perimeter-based defenses by identifying the symptoms of a
malware infection or data breach using behavioral analysis
and anomaly detection. Cognitive Threat Analytics relies
on advanced statistical modeling and machine learning to
independently identify new threats, learn from what it sees,
and adapt over time.
GLOBAL GOVERNMENT AFFAIRS
Cisco engages with governments at many different levels
to help shape public policy and regulations that support
the technology sector and help governments meet their
goals. The Global Government Affairs team develops and
influences pro-technology public policies and regulations.
Working collaboratively with industry stakeholders and
association partners, the team builds relationships with
government leaders to influence policies that affect Cisco’s
business and overall ICT adoption, looking to help shape
policy decisions at a global, national, and local level.
The Government Affairs team is comprised of former
elected officials, parliamentarians, regulators, senior U.S.
government officials, and government affairs professionals
who help Cisco promote and protect the use of technology
around the world.
INTELLISHIELD TEAM
The IntelliShield team performs vulnerability and threat
research, analysis, integration, and correlation of data
and information from across Cisco Security Research &
Operations and external sources to produce the IntelliShield
Security Intelligence Service, which supports multiple Cisco
products and services.
LANCOPE
Lancope, a Cisco company, is a leading provider of network
visibility and security intelligence to protect enterprises
against today’s top threats. By analyzing NetFlow,
IPFIX, and other types of network telemetry, Lancope’s
StealthWatch® System delivers Context-Aware Security
Analytics to quickly detect a wide range of attacks from
APTs and DDoS to zero-day malware and insider threats.
Combining continuous lateral monitoring across enterprise
networks with user, device, and application awareness,
Lancope accelerates incident response, improves forensic
investigations, and reduces enterprise risk.
OPENDNS
OpenDNS, a Cisco company, is the world’s largest cloud-
delivered security platform, serving more than 65 million
daily users spread across more than 160 countries.
OpenDNS Labs is the security research team at OpenDNS
that supports the security platform. For more information
visit www.opendns.com or https://labs.opendns.com.
67
About CiscoCisco 2016 Annual Security Report
SECURITY AND TRUST ORGANIZATION
Cisco’s Security and Trust Organization underscores
Cisco’s commitment to address two of the most critical
issues that are top of mind for boardrooms and world
leaders alike. The organization’s core missions include
protecting Cisco’s public and private customers, enabling
and ensuring Cisco Secure Development Lifecycle and
Trustworthy Systems efforts across Cisco’s product and
service portfolio, and protecting the Cisco enterprise from
ever-evolving cyber threats. Cisco takes a holistic approach
to pervasive security and trust, which includes people,
policies, processes, and technology. The Security and Trust
organization drives operational excellence focusing across
InfoSec, Trustworthy Engineering, Data Protection and
Privacy, Cloud Security, Transparency and Validation, and
Advanced Security Research and Government. For more
information, visit http://trust.cisco.com.
SECURITY RESEARCH AND OPERATIONS (SR&O)
Security Research & Operations (SR&O) is responsible for
threat and vulnerability management of all Cisco products
and services, including the industry-leading Product
Security Incident Response Team (PSIRT). SR&O helps
customers understand the evolving threat landscape at
events such as Cisco Live and Black Hat, as well as through
collaboration with its peers across Cisco and the industry.
Additionally, SR&O innovates to deliver new services
such as Cisco’s Custom Threat Intelligence (CTI), which
can identify indicators of compromise that have not been
detected or mitigated by existing security infrastructures.
Cisco Partner Contributor
LEVEL 3 THREAT RESEARCH LABS
Level 3 Communications is a premier global communications
provider headquartered in Broomfield, Colorado, that provides
communications services to enterprise, government, and
carrier customers. Anchored by extensive fiber networks
on three continents and connected by undersea facilities,
our global services platform features deep metro assets
reaching more than 500 markets in more than 60 countries.
Level 3’s network provides an expansive view of the global
threat landscape.
Level 3 Threat Research Labs is the security group that
proactively analyzes the global threat landscape and
correlates information across internal and external sources
to help protect Level 3 customers, its network, and the
public Internet. The group regularly partners with industry
leaders, such as Cisco Talos, to help research and
mitigate threats.
68
About CiscoCisco 2016 Annual Security Report
Appendix
69
AppendixCisco 2016 Annual Security Report
Appendix
Figure X. Respondent Profiles
Respondent Profiles
Source: Cisco 2015 Security Capabilities Benchmark Study
Setting Overall Vision and Strategy 75%
67%Making Final Brand Recommendations Regarding Solutions
Researching and Evaluating Solutions 75%
Implementing and Managing Solutions 73%
Defining Requirements 71%
Approving Budgets 57%
83%
81%
78%
79%
76%
66%
Areas of Security Involvement 2014 2015
20152014 (n=1738) (n=2432)
4%
Healthcare
6%
15%
Non-Computer-
Related
Manufacturing
14%
Utilities/Energy
7%
14%
Financial Services:
Banking, Insurance
15%
3%3%
Mining
1%
12%
Government
9%
3%
Pharmaceuticals
3%
8%
Telecommunications
6%
1%
Agriculture/Forestry/
Fishing
2%
5%
Chemical Engineering
or Manufacturing
7%
27%
Other Industry
21%
5%
Transportation
8%
54%
Midmarket
0%
Enterprise
Large
46%
Enterprise
49%13% 38%
CSOs vs SecOps Organization Size
46%56%
2014
55%45%
2015
CSOs SecOps 20152014
Figure 71. Respondent Profiles
Cisco’s 2015 Security Capabilities Benchmark Study:
Respondent Profile and Resources
70
AppendixCisco 2016 Annual Security Report
Source: Cisco 2015 Security Capabilities Benchmark Study
Figure X.
Although only 9% have a security budget that’s separate from the IT budget, this has
increased significantly since 2014
Is the Security Budget Part of the IT Budget? (IT Department Members)
2014 (n=1720) 2015 (n=2412)
All Within ITPartially Within IT
Completely Separate
All Within ITPartially Within IT
Completely Separate
61%33%
6%
58%33%
9%
Figure 72. Although Only 9% Have a Security Budget That’s Separate From the IT Budget, This Has Increased
Significantly Since 2014
Figure 73. Job Titles: Respondents and Their Managers
Figure X. Job Titles: Respondents and Their Managers
Members of the IT Department
98%97% VS
20152014
Chief Security Officer 22% Chief Executive Officer 34%
Chief Technology Officer 18% President/Owner 18%
Director or Manager of IT 16% Chief Security Officer 6%
Chief Information Officer 13% Chief Information Officer 6%
Director of
Security Operations
7% Chief Technology Officer 6%
VP of IT Security 5% Director or Manager of IT 4%
Risk and Compliance Officer 4% VP of IT Security 4%
Security Operations
Manager
4% VP of IT 2%
Security Architect 4% Executive Board 2%
VP of IT 3% Chief Operations Officer 1%
Chief Operations Officer 3% Chief Financial Officer 1%
Another Title 2% Another Title 0%
Job Title Manager’s Job Title
Department or Team Dedicated to Security
Members of a Security Team
2014 2015(n=1738) (n=2432)
2014 2015(n=1706) (n=2382)
98% 98%
97% 94%
Source: Cisco 2015 Security Capabilities Benchmark Study
71
AppendixCisco 2016 Annual Security Report
Source: Cisco 2015 Security Capabilities Benchmark Study
Security Threat Defenses Used by Organization
Defenses Administered Through Cloud-
Based Services (Security Respondents
Who Use Security Threat Defenses)
2014 (n=1738) 2014 (n=1646) 2015 (n=2268)2015 (n=2432)
Network, Security, Firewalls, and Intrusion Prevention* 60% N/A 35%
None of the Above 1% 1% 11%13%
Email/Messaging Security 56% 52% 37% 34%
Encryption/Privacy/Data Protection 53% 53%
Data Loss Prevention 55% 56%
Authentication 52% 53%
Firewall* N/A 65% 31%
Intrusion Prevention* N/A 44% 20%
Identity Administration/User Provisioning 45% 45%
Access Control/Authorization 53% 48%
Endpoint Protection/Anti-Malware 49% 49% 25% 25%
Web Security 59% 51% 37% 31%
Security Information and Event Management 43% 38%
VPN 48% 40% 26% 21%
Vulnerability Scanning 48% 41% 25% 21%
Secured Wireless 50% 41% 26% 19%
Mobility Security 51% 44% 28% 24%
Endpoint Forensics 31% 26%
Network Forensics 42% 31%
Patching and Configuration 39% 32%
Penetration Testing 38% 34% 20% 17%
DDoS Defense 36% 37%
“Network security, firewalls, and intrusion prevention.”*Firewall and intrusion prevention were one code in 2014:
Figure X. Firewalls and Data Loss Prevention Are Most Commonly Used Security Tools
Figure 74. Firewall Is the Most Common Security Threat Defense Tool Used; Fewer Security Threat Defenses Are
Being Administered Through Cloud-Based Services in 2015 Compared to 2014
72
AppendixCisco 2016 Annual Security Report
Outsourcing
Figure X. Advice and consulting still top most security services outsourced
Preparing for the Certification Process
Currently in the Process
of Becoming Certified
63% Chemical Eng. or Mfg.
58% Non-Computer-Related Mfg.
57% Transportation
46% Agriculture/Forestry/Fishing
44% Pharmaceuticals
36% Mining
70% Financial Services
70% Telecommunications
67% Healthcare
65% Government
64% Utilities/Energy
63% Other Industry
Already Certified
63%31%
7%
Significant Increases Seen in Audit and Incident Response Outsourcing. Outsourcing Is Seen as Being More Cost-Efficient.
Half (52%) follow a standardized security policy practice such as ISO 27001—the same as last year. Of these, the vast majority are either
already certified or in the process of becoming certified.
Standardized Security Policy Practice
Organization follows standardized information security policy practice (2015: n=1265)
Source: Cisco 2015 Security Capabilities Benchmark Study
Figure 75. Advice and Consulting Still Topmost Security Services Outsourced
Figure X.
Company view of outsourcing: Large Enterprises are significantly more likely to outsource
audits and advice and consulting
10%40%44%56%55%
11%42%46%54%
14%46%45%49%
Source: Cisco 2015 Security Capabilities Benchmark Study
Advice and
Consulting Audit Monitoring
Incident
Response
Threat
Intelligence Remediation
None/
All Internal
44%
42%
41%
42%
36%
36%
37%
36%
Which Security Services Are Outsourced?
Midmarket
Enterprise
Large
Enterprise
(n=924)
(n=319)
(n=1189)
Figure 76. Company View of Outsourcing: Large Enterprises Are Significantly More Likely to Outsource Audits,
Advice and Consulting
73
AppendixCisco 2016 Annual Security Report
Figure 77. Country View of Outsourcing: Japan Is Significantly More Likely to Outsource Advice and Consulting
Figure X.
Country view of outsourcing: Japan is significantly more likely to outsource advice and consulting
Which Security Services Are Outsourced?
52% 52%
50%
48%
46%
42%
34%
18%
47%
44%
42%
39%
36%
12%
TOTAL U.S.
51%
55%
49%
39%
40%
32%
9%
Brazil
19%
38%
32%
32%
37%
38%
18%
Germany
51%
48%
39%
38%
46%
34%
13%
Italy
44%
50%
41%
43%
36%
31%
19%
U.K.
54%
36%
52%
53%
16%
47%
4%
Australia
52%
33%
31%
34%
36%
37%
19%
China
54%
51%
51%
49%
48%
41%
12%
India
58%
63%
49%
45%
44%
21%
3%
Mexico
41%
40%
37%
27%
42%
41%
16%
Russia
55%
59%
50%
54%
39%
41%
4%
France
64%
41%
51%
53%
47%
40%
10%
Japan
Source: Cisco 2015 Security Capabilities Benchmark Study
Advice and Consulting
Audit
Monitoring
Incident Response
Threat Intelligence
Remediation
None/All Internal
Figure 78. On-Premises Hosting of Networks Is Still the Most Common; However, Off-Premises Hosting has
Increased Since Last Year
Source: Cisco 2015 Security Capabilities Benchmark Study
Figure X.
On-premise hosting of the organization’s networks is still the most common; however,
off-premise hosting has increased since last year
Where Networks Are Hosted
On–Premises Off–Premises
20152014 (n=1727) (n=2417)
50%
With Private Cloud
51%
54%
All On–Premises
48%
23%
Third–Party Managed
24%
18%
Private Cloud
20%
8%
Public Cloud
10%
74
AppendixCisco 2016 Annual Security Report
Public Security Breach
Source: Cisco 2015 Security Capabilities Benchmark Study
Fewer Organizations in 2015 Report Having Had to Manage
Public Scrutiny of Security Breaches Compared to 2014.
How Much Did the Breach Drive Improvements in Your Security
Threat Defense Policies, Procedures, or Technologies? (n=1134)
Security Breaches Are Strong Drivers of Security Improvements:
Figure X.
Fewer organizations in 2015 report having had to manage public scrutiny of security breaches,
compared to 2014
10%1% 42% 47%
Increased Security Awareness Training Among Employees
43%
Increased Investment in Security Defense Technologies or Solutions
42%
Established a Formal Set of Security Policies and Procedures
41%
Increased Enforcement of Data Protection Laws and Regulations
40%
Increased Investment in the Training of Security Staff
40%
(Top 5 Mentions) Respondents Affected by a Security Breach (2015 n=1109)
In 2015, 41 percent of respondents said they established a
formal set of security policies and procedures.
41%
43%
In 2015, 43 percent of respondents said they increased security
training after a public breach.
48%53% VS
20152014
Not at all Not very Somewhat A lot
Source: Cisco 2015 Security Capabilities Benchmark Study
10%1% 42% 47%
Increased Security Awareness Training Among Employees
43%
Increased Investment in Security Defense Technologies or Solutions
42%
Established a Formal Set of Security Policies and Procedures
41%
Increased Enforcement of Data Protection Laws and Regulations
40%
Increased Investment in the Training of Security Staff
40%
(Top 5 Mentions) Respondents Affected by a Security Breach (2015 n=1109)
In 2015, 41 percent of respondents said they established a
formal set of security policies and procedures.
41%
43%
In 2015, 43 percent of respondents said they increased security
training after a public breach.
48%53% VS
20152014
Not at all Not very Somewhat A lot
Figure 79. Fewer Organizations in 2015 Report Having Had to Manage Public Scrutiny of Security Breaches
CSOs Mention More Improvements After Security Breach Than SecOps Managers Do.
Source: Cisco 2015 Security Capabilities Benchmark Study
Respondents Dedicated to Security.2014 (n=1701) 2015 (n=1347)
48%Yes
53%Yes
VS
20152014
How Much Did the Breach Drive Improvements in Your Security
Threat Defense Policies, Procedures, or Technologies? (n=1134)
Security Breaches are Strong Drivers of Security Improvements:
Not at all Not very Somewhat A lot
10%1% 42% 47%
Has Your Organization Ever Had to Manage Public Scrutiny of a Security Breach?Figure 80. Public Breaches Can Improve Security
75
AppendixCisco 2016 Annual Security Report
Leadership and Maturity
Figure X. 5-segment model tracks closely to Security Capability Maturity Model (CMM)
Segments Reflect a Similar Pattern to Last Year’s Study in
Terms of Maturity Around the Priority of Security and How that
Translates Into Processes and Procedures. This is True for the Most Part Across Countries and Industry.
or More Fit More Security-Mature Profiles.60%
2014 (n=1637)
2015 (n=2401)
Low Upper–Middle HighLower–Middle Middle
Segment Sizing
28%2% 9% 36%25%
26%4% 8% 39%23%
Source: Cisco 2015 Security Capabilities Benchmark Study
Figure 81. 5-Segment Model Tracks Closely to Security Capability Maturity Model (CMM)
Figure X.
As in 2014, nearly all agree or strongly agree that executive leadership considers security a high priority
Significantly more pharmaceutical respondents strongly agree with
the statement “my organization’s executive team has established
clear metrics for assessing the effectiveness of our security
program” than do professionals from most other industries.
Significantly more CSOs agree with all statements around
executive engagement compared with SecOps.
Security Roles and Responsibilities are Clarified
Within My Organization’s Executive Team
Cyber Risk Assessments are Routinely Incorporated
Into Our Overall Risk Assessment Process
My Organization’s Executive Team has Established
Clear Metrics for Assessing Effectiveness of Our
Security Program
Executive Leadership at My Organization Considers
Security a High Priority
93
532 6 40
2014
n=1738
94
531 5 41
2015
n=2432
93
572 4 36
2014
n=1738
95
551 4 40
2015
n=2432
94
582 5 35
2014
n=1738
95
581 4 36
2015
n=2432
94
632 4 32
2014
n=1738
94
611 4 35
2015
n=2432
Security Policies Strongly Disagree Strongly AgreeDisagree Agree
Source: Cisco 2015 Security Capabilities Benchmark Study
Figure 82. As in 2014, Nearly All Agree or Strongly Agree that Executive Leadership Considers Security a High Priority
76
AppendixCisco 2016 Annual Security Report
Processes
Source: Cisco 2015 Security Capabilities Benchmark Study
Information Assets are Inventoried and
Clearly Classified
93
542 6 39
95
531 5 42
2015
n=2432
2014
n=1738
We Do an Excellent Job of Managing HR Security
93
532 5 40
95
511 5 44
2015
n=2432
2014
n=1738
We Do a Good Job of Building Security Into Our
Procedures for Acquiring, Developing, and
Maintaining Systems
94
562 4 38
97
561 2 41
2015
n=2432
2014
n=1738
We Do a Good Job of Building Security Into
Systems and Applications
93
582 5 35
96
541 4 42
2015
n=2432
2014
n=1738
Technical Security Controls in Systems and
Networks are Well Managed
95
602 3 35
95
570 4 38
2015
n=2432
2014
n=1738
Computer Facilities Within My Organization
are Well Protected
93
572 4 36
96
561 4 40
2015
n=2432
2014
n=1738
We Regularly Review Our Security Practices and
Tools to Ensure that They are Up to Date and Effective
94
592 5 35
97
601 3 37
2015
n=2432
2014
n=1738
Access Rights to Networks, Systems, Applications,
Functions, and Data are Appropriately Controlled
94
612 4 33
97
591 3 38
2015
n=2432
2014
n=1738
Strongly Disagree Strongly AgreeDisagree AgreeSecurity Policies
Fewer in 2015 Strongly Agree that They Do a Good Job Building Security Into Systems and Applications
Figure X. Lower Confidence in Ability to Build Security into Systems
Source: Cisco 2015 Security Capabilities Benchmark Study
Information Assets are Inventoried and
Clearly Classified
93
542 6 39
95
531 5 42
2015
n=2432
2014
n=1738
We Do an Excellent Job of Managing HR Security
93
532 5 40
95
511 5 44
2015
n=2432
2014
n=1738
We Do a Good Job of Building Security Into Our
Procedures for Acquiring, Developing, and
Maintaining Systems
94
562 4 38
97
561 2 41
2015
n=2432
2014
n=1738
We Do a Good Job of Building Security Into
Systems and Applications
93
582 5 35
96
541 4 42
2015
n=2432
2014
n=1738
Technical Security Controls in Systems and
Networks are Well Managed
95
602 3 35
95
570 4 38
2015
n=2432
2014
n=1738
Computer Facilities Within My Organization
are Well Protected
93
572 4 36
96
561 4 40
2015
n=2432
2014
n=1738
We Regularly Review Our Security Practices and
Tools to Ensure that They are Up to Date and Effective
94
592 5 35
97
601 3 37
2015
n=2432
2014
n=1738
Access Rights to Networks, Systems, Applications,
Functions, and Data are Appropriately Controlled
94
612 4 33
97
591 3 38
2015
n=2432
2014
n=1738
Strongly Disagree Strongly AgreeDisagree AgreeSecurity Policies
Fewer in 2015 Strongly Agree that They Do a Good Job Building Security Into Systems and Applications
Figure 83. Mixed Confidence in Ability to Build Security into Systems
77
AppendixCisco 2016 Annual Security Report
Figure 83. Mixed Confidence in Ability to Build Security into Systems (continued)
Source: Cisco 2015 Security Capabilities Benchmark Study
Information Assets are Inventoried and
Clearly Classified
93
542 6 39
95
531 5 42
2015
n=2432
2014
n=1738
We Do an Excellent Job of Managing HR Security
93
532 5 40
95
511 5 44
2015
n=2432
2014
n=1738
We Do a Good Job of Building Security Into Our
Procedures for Acquiring, Developing, and
Maintaining Systems
94
562 4 38
97
561 2 41
2015
n=2432
2014
n=1738
We Do a Good Job of Building Security Into
Systems and Applications
93
582 5 35
96
541 4 42
2015
n=2432
2014
n=1738
Figure X. Lower Confidence in Ability to Build Security into Systems
Source: Cisco 2015 Security Capabilities Benchmark Study
Information Assets are Inventoried and
Clearly Classified
93
542 6 39
95
531 5 42
2015
n=2432
2014
n=1738
We Do an Excellent Job of Managing HR Security
93
532 5 40
95
511 5 44
2015
n=2432
2014
n=1738
We Do a Good Job of Building Security Into Our
Procedures for Acquiring, Developing, and
Maintaining Systems
94
562 4 38
97
561 2 41
2015
n=2432
2014
n=1738
We Do a Good Job of Building Security Into
Systems and Applications
93
582 5 35
96
541 4 42
2015
n=2432
2014
n=1738
Technical Security Controls in Systems and
Networks are Well Managed
95
602 3 35
95
570 4 38
2015
n=2432
2014
n=1738
Computer Facilities Within My Organization
are Well Protected
93
572 4 36
96
561 4 40
2015
n=2432
2014
n=1738
We Regularly Review Our Security Practices and
Tools to Ensure that They are Up to Date and Effective
94
592 5 35
97
601 3 37
2015
n=2432
2014
n=1738
Access Rights to Networks, Systems, Applications,
Functions, and Data are Appropriately Controlled
94
612 4 33
97
591 3 38
2015
n=2432
2014
n=1738
Strongly Disagree Strongly AgreeDisagree AgreeSecurity Policies
Fewer in 2015 Strongly Agree that They Do a Good Job Building Security Into Systems and Applications
Figure X. Enterprises Believe They Have Good Security Controls
We Have Well–Documented Processes
and Procedures for Incident Response
and Tracking
Strongly Disagree Strongly AgreeDisagree Agree
93
562 5 37
95
541 5 41
2015
n=2432
2014
n=1738
We Have Good Systems for Verifying that
Security Incidents Actually Occurred
92
541 6 38
95
541 5 41
2015
n=2432
2014
n=1738
We Do a Good Job of Notifying and
Collaborating with Stakeholders About
Security Incidents
94
512 5 43
95
531 4 42
2015
n=2432
2014
n=1738
We Have a Good System for Categorizing
Incident-Related Information
94
542 5 40
96
531 4 43
2015
n=2432
2014
n=1738
We Have Effective Processes for Interpreting
and Prioritizing Incoming Incident Reports and
Understanding Them
93
512 5 42
95
521 5 43
2015
n=2432
2014
n=1738
492 8 41
Security Controls
Most Say They are Comfortable With Their Security Controls
Except for the statement “We do a good job of notifying and
collaborating with stakeholders about security incidents,” CSOs
are more positive about attributes surrounding security controls
than SecOps managers.
Financial services respondents are more likely to
strongly agree with the statement “We have a good
system for categorizing incident-related information”
than professionals from most other industries.
Source: Cisco 2015 Security Capabilities Benchmark Study
Figure X. Enterprises Believe They Have Good Security Controls
We Have Well–Documented Processes
and Procedures for Incident Response
and Tracking
Strongly Disagree Strongly AgreeDisagree Agree
93
562 5 37
95
541 5 41
2015
n=2432
2014
n=1738
We Have Good Systems for Verifying that
Security Incidents Actually Occurred
92
541 6 38
95
541 5 41
2015
n=2432
2014
n=1738
We Do a Good Job of Notifying and
Collaborating with Stakeholders About
Security Incidents
94
512 5 43
95
531 4 42
2015
n=2432
2014
n=1738
We Have a Good System for Categorizing
Incident-Related Information
94
542 5 40
96
531 4 43
2015
n=2432
2014
n=1738
We Have Effective Processes for Interpreting
and Prioritizing Incoming Incident Reports and
Understanding Them
93
512 5 42
95
521 5 43
2015
n=2432
2014
n=1738
We Follow a Standardized Incident Response
Practice Such Aas Rfc2350, ISO/IEC
27035:2011, or U.S. Cert
90
492 8 41
93
491 6 44
2015
n=2432
2014
n=1738
Security Controls
Most Say They are Comfortable With Their Security Controls
Figure 84. Enterprises Believe They Have Good Security Controls
78
AppendixCisco 2016 Annual Security Report
Except for the statement “We do a good job of notifying and
collaborating with stakeholders about security incidents,” CSOs
are more positive about attributes surrounding security controls
than SecOps managers.
Financial services respondents are more likely to
strongly agree with the statement “We have a good
system for categorizing incident-related information”
than professionals from most other industries.
Source: Cisco 2015 Security Capabilities Benchmark Study
We Do a Good Job of Notifying and
Collaborating with Stakeholders About
Security Incidents
94
95
531 4 42
2015
n=2432
n=1738
We Have a Good System for Categorizing
Incident-Related Information
94
542 5 40
96
531 4 43
2015
n=2432
2014
n=1738
We Have Effective Processes for Interpreting
and Prioritizing Incoming Incident Reports and
Understanding Them
93
512 5 42
95
521 5 43
2015
n=2432
2014
n=1738
We Follow a Standardized Incident Response
Practice Such Aas Rfc2350, ISO/IEC
27035:2011, or U.S. Cert
90
492 8 41
93
491 6 44
2015
n=2432
2014
n=1738
Except for the statement “We do a good job of notifying and
collaborating with stakeholders about security incidents,” CSOs
are more positive about attributes surrounding security controls
than SecOps managers.
Financial services respondents are more likely to
strongly agree with the statement “We have a good
system for categorizing incident-related information”
than professionals from most other industries.
Source: Cisco 2015 Security Capabilities Benchmark Study
Figure X. Enterprises Believe They Have Good Security Controls
We Have Well–Documented Processes
and Procedures for Incident Response
and Tracking
Strongly Disagree Strongly AgreeDisagree Agree
93
562 5 37
95
541 5 41
2015
n=2432
2014
n=1738
We Have Good Systems for Verifying that
Security Incidents Actually Occurred
92
541 6 38
95
541 5 41
2015
n=2432
2014
n=1738
We Do a Good Job of Notifying and
Collaborating with Stakeholders About
Security Incidents
94
512 5 43
95
531 4 42
2015
n=2432
2014
n=1738
We Have a Good System for Categorizing
Incident-Related Information
94
542 5 40
96
531 4 43
2015
n=2432
2014
n=1738
We Have Effective Processes for Interpreting
and Prioritizing Incoming Incident Reports and
Understanding Them
93
512 5 42
95
521 5 43
2015
n=2432
2014
n=1738
We Follow a Standardized Incident Response
Practice Such Aas Rfc2350, ISO/IEC
27035:2011, or U.S. Cert
90
492 8 41
93
491 6 44
2015
n=2432
2014
n=1738
Security Controls
Most Say They are Comfortable With Their Security Controls
Figure 84. Enterprises Believe They Have Good Security Controls (continued)
Figure 85. Quarantine/Removal of Malicious Applications and Root Cause Analysis Continue to Be the Top Processes Used
Figure X.
Quarantine/removal of malicious applications and root cause analysis continue to
be the top processes used
Processes to Eliminate Cause of Security Incidents
97% 94%
Source: Cisco 2015 Security Capabilities Benchmark Study
Significantly more U.S. respondents
mention “none of the above” when asked
about processes to eliminate the cause of
a security incident compared with
respondents in most other countries.
52% 48%Additional Monitoring
56% 55%Quarantine or Removal of Malicious
Application
53% 53%
Stopping Communication of
Malicious Software
55% 55%Root Cause Analysis
45% 41%Reimage System to Previous State
48% 47%
Stopping Communication of Compromised
Application
47% 40%Long-Term Fix Development
2% 1%None of the Above
20152014 (n=1738) (n=2432)
51% 47%Policy Updates
United States
Security Incidents
79
AppendixCisco 2016 Annual Security Report
Source: Cisco 2015 Security Capabilities Benchmark Study
We Have Tools in Place that Enable Us to Review
and Provide Feedback Regarding the Capabilities
of Our Security Practices
93
531 5 40
96
521 4 44
2015
n=2432
2014
n=1738
Our Security Technologies are Well Integrated to
Work Effectively Together
94
562 5 38
95
521 4 43
2015
n=2432
2014
n=1738
It is Easy to Determine the Scope of a Compromise,
Contain it, and Remediate from Exploits
89
462 9 43
91
451 8 46
2015
n=2432
2014
n=1738
Our Threat Detection and Blocking Capabilities
are Kept Up to Date
94
571 5 37
96
561 3 40
2015
n=2432
2014
n=1738
Security is Well Integrated into Our Organization’s
Goals and Business Capabilities
94
582 5 36
96
561 4 40
2015
n=2432
2014
n=1738
We Routinely and Systematically Investigate
Security Incidents
93
552 5 38
96
561 4 40
2015
n=2432
2014
n=1738
We Can Increase Security Controls on High-Value
Assets Should Circumstances Require
94
541 5 40
97
561 3 41
2015
n=2432
2014
n=1738
We Regularly Review Connection Activity on the
Network to Ensure that Security Measures are
Working as Intended
94
582 4 36
96
571 3 39
2015
n=2432
2014
n=1738
We Review and Improve Our Security Practices
Regularly, Formally, and Strategically Over Time
94
561 4 38
96
561 4 40
2015
n=2432
2014
n=1738
Figure X. Enterprises Lack Confidence in Ability to Contain Compromises
We Have Tools in Place that Enable Us to Review
and Provide Feedback Regarding the Capabilities
of Our Security Practices
93
531 5 40
96
521 4 44
2015
n=2432
2014
n=1738
Our Security Technologies are Well Integrated to
Work Effectively Together
94
562 5 38
95
521 4 43
2015
n=2432
2014
n=1738
It is Easy to Determine the Scope of a Compromise,
Contain it, and Remediate from Exploits
89
462 9 43
91
451 8 46
2015
n=2432
2014
n=1738
Our Threat Detection and Blocking Capabilities
are Kept Up to Date
94
571 5 37
96
561 3 40
2015
n=2432
2014
n=1738
Security is Well Integrated into Our Organization’s
Goals and Business Capabilities
94
582 5 36
96
561 4 40
2015
n=2432
2014
n=1738
We Routinely and Systematically Investigate
Security Incidents
93
552 5 38
96
561 4 40
2015
n=2432
2014
n=1738
We Can Increase Security Controls on High-Value
Assets Should Circumstances Require
94
541 5 40
97
561 3 41
2015
n=2432
2014
n=1738
We Regularly Review Connection Activity on the
Network to Ensure that Security Measures are
Working as Intended
94
582 4 36
96
571 3 39
2015
n=2432
2014
n=1738
We Review and Improve Our Security Practices
Regularly, Formally, and Strategically Over Time
94
561 4 38
96
561 4 40
2015
n=2432
2014
n=1738
Strongly Disagree Strongly AgreeDisagree AgreeSecurity Operationalization
However, Companies Continue to Lack Confidence in Their Abilities to Scope and Contain Compromises
Figure 86. Enterprises Exhibit Mixed Confidence in Ability to Contain Compromises
80
AppendixCisco 2016 Annual Security Report
Figure 86. Enterprises Exhibit Mixed Confidence in Ability to Contain Compromises (continued)
Source: Cisco 2015 Security Capabilities Benchmark Study
We Have Tools in Place that Enable Us to Review
and Provide Feedback Regarding the Capabilities
of Our Security Practices
93
531 5 40
96
521 4 44
2015
n=2432
2014
n=1738
Our Security Technologies are Well Integrated to
Work Effectively Together
94
562 5 38
95
521 4 43
2015
n=2432
2014
n=1738
It is Easy to Determine the Scope of a Compromise,
Contain it, and Remediate from Exploits
89
462 9 43
91
451 8 46
2015
n=2432
2014
n=1738
Security is Well Integrated into Our Organization’s
Goals and Business Capabilities
94
582 5 36
96
561 4 40
2015
n=2432
2014
n=1738
Figure X. Enterprises Lack Confidence in Ability to Contain Compromises
We Have Tools in Place that Enable Us to Review
and Provide Feedback Regarding the Capabilities
of Our Security Practices
93
531 5 40
96
521 4 44
2015
n=2432
2014
n=1738
Our Security Technologies are Well Integrated to
Work Effectively Together
94
562 5 38
95
521 4 43
2015
n=2432
2014
n=1738
It is Easy to Determine the Scope of a Compromise,
Contain it, and Remediate from Exploits
89
462 9 43
91
451 8 46
2015
n=2432
2014
n=1738
Our Threat Detection and Blocking Capabilities
are Kept Up to Date
94
571 5 37
96
561 3 40
2015
n=2432
2014
n=1738
Security is Well Integrated into Our Organization’s
Goals and Business Capabilities
94
582 5 36
96
561 4 40
2015
n=2432
2014
n=1738
We Routinely and Systematically Investigate
Security Incidents
93
552 5 38
96
561 4 40
2015
n=2432
2014
n=1738
We Can Increase Security Controls on High-Value
Assets Should Circumstances Require
94
541 5 40
97
561 3 41
2015
n=2432
2014
n=1738
We Regularly Review Connection Activity on the
Network to Ensure that Security Measures are
Working as Intended
94
582 4 36
96
571 3 39
2015
n=2432
2014
n=1738
We Review and Improve Our Security Practices
Regularly, Formally, and Strategically Over Time
94
561 4 38
96
561 4 40
2015
n=2432
2014
n=1738
Strongly Disagree Strongly AgreeDisagree AgreeSecurity Operationalization
However, Companies Continue to Lack Confidence in Their Abilities to Scope and Contain Compromises
Figure 87. Firewall Logs and System Log Analysis Continue to Be the Most Commonly Used Processes to Analyze
Compromised Systems
Midmarket
Figure X.
Firewall logs and system log analysis continue to be the most commonly
used processes to analyze compromised systems
System Log Analysis 40%
45%Firewall Log
Network Flow Analysis 40%
Malware or File Regression Analysis 34%
Registry Analysis 33%
Full Packet Capture Analysis 32%
Correlated Event/Log Analysis 28%
Disk Forensics 27%
Memory Forensics 24%
IOC Detection 26%
External Incident Response/Analysis 21%
None of the Above 1%
59%
61%
53%
55%
50%
47%
42%
40%
41%
38%
37%
2%
Processes to Analyze Compromised Systems
Source: Cisco 2015 Security Capabilities Benchmark Study
Enterprise and Large Enterprise companies
report using more processes for analyzing
compromised systems than do Midmarket
companies.
2014 2015(n=1738) (n=2432)
Enterprise and
Large Enterprise
81
AppendixCisco 2016 Annual Security Report
Figure 88. Restoring From a Pre-Incident Backup Is the Most Common Process to Restore Affected Systems in 2015
Figure X.
Restoring from a pre-incident backup is the most common process to
restore affected systems in 2015
57% 59%
60% 56%
60% 55%
56% 51%
35% 35%
2% 1%
Processes to Restore Affected Systems
97% 94%
Source: Cisco 2015 Security Capabilities Benchmark Study
Respondents in China say they patch and
update applications deemed vulnerable
more frequently than do respondents in
other countries surveyed.
Implementing Additional or New
Detections and Controls Based on
Identified Weaknesses Post-Incident
Patching and Updating Applications
Deemed Vulnerable
Differential Restoration (Removing Changes
Caused by an Incident)
Restoring From a Pre-Incident Backup
Gold Image Restoration
None of the Above
2014 2015(n=1738) (n=2432)
China
Patch
Management
Figure X.
The CEO or president is most likely to be notified of security incidents,
followed by operations and the finance department
Operations 46% 40%
45%Chief Executive Officer N/A
N/A
N/A
Finance Department 40%
Technology Partners 45% 34%
Engineering 38% 33%
Human Resources 36% 32%
Legal 36% 28%
Manufacturing 33% 27%
Public Relations 28% 24%
All Employees 35% 26%
Business Partners 32% 21%
External Authorities 22% 18%
15%Insurance Companies
Groups Notified in the Event of an Incident
97% 94%
Source: Cisco 2015 Security Capabilities Benchmark Study
Significantly more large enterprise respondents
mention notifying external authorities in the
event of an incident than those from Midmarket
and Enterprise companies.
2014 2015(n=1738) (n=2432)
Large Enterprise
!
Figure 89. The CEO or President Is Most Likely to Be Notified of Security Incidents, Followed by
Operations and the Finance Department
82
AppendixCisco 2016 Annual Security Report
Training
Figure X. Nearly all companies (97%) deliver security training at least once a year
83%96% VS
Have NotHave
Source: Cisco 2015 Security Capabilities Benchmark Study
Are Security Awareness and/or Training Programs
Delivered to Security Staff on a Regular Basis?
(Respondents Dedicated to Security)
How Often is Security Training Delivered?
(Respondents Whose Security Teams Receive Training)
More companies that have experienced a breach
regularly conduct security awareness and/or
training programs (96%) than those companies that
have not experienced a breach (83%).
89%
Enterprise
93%
Enterprise
Large
88%
Midmarket
More Large Enterprises say they have security
awareness and/or training programs regularly
(93%) compared with Midmarket (88%) and
Enterprise (89%) companies.
2014 (n=1726)
2015 (n=2402)
89% Yes
11% No
90% Yes
10% No
2015
(n=2147)
2+ Times/Year≥1 Times/Year≤1 Times/ 2–Year<1 Time/2–Year
N/A
N/A
3% 39% 58%
97%
2014
(n=1560)
1% 17% 82%
(no 2014 data)
Figure 90. Nearly All Companies (97%) Deliver Security Training at Least Once a Year
Source: Cisco 2015 Security Capabilities Benchmark Study
Fewer Organizations in 2015 Report Having Had to Manage
Public Scrutiny of Security Breaches Compared to 2014.
How Much Did the Breach Drive Improvements in Your Security
Threat Defense Policies, Procedures, or Technologies? (n=1134)
Security Breaches Are Strong Drivers of Security Improvements:
Figure X.
Fewer organizations in 2015 report having had to manage public scrutiny of security breaches,
compared to 2014
10%1% 42% 47%
Increased Security Awareness Training Among Employees
43%
Increased Investment in Security Defense Technologies or Solutions
42%
Established a Formal Set of Security Policies and Procedures
41%
Increased Enforcement of Data Protection Laws and Regulations
40%
Increased Investment in the Training of Security Staff
40%
(Top 5 Mentions) Respondents Affected by a Security Breach (2015 n=1109)
In 2015, 41 percent of respondents said they established a
formal set of security policies and procedures.
41%
43%
In 2015, 43 percent of respondents said they increased security
training after a public breach.
48%53% VS
20152014
Not at all Not very Somewhat A lot
Figure 91. Frequency of Security Awareness Training and Incidence of Formal Security Policies Are Both Up Since
2014—Evidence of Action
83
AppendixCisco 2016 Annual Security Report
Figure 92. As in 2014, Nearly 9 in 10 Say Their Security Staff Attend Security-Focused Conferences or Training
Figure X.
As in 2014, nearly 9 in 10 say their security staff attend security-focused conferences or training
Do Security Staff Members Attend Conferences and/or
External Training to Improve and Maintain Their Skills?
(Respondents Dedicated to Security)
Do Employees Serve on Security Industry Boards or Committees?
(Respondents Dedicated to Security)
2014 2015(n=1738) (n=2432)
89%
Yes
89%
Yes
64%
Yes
36%
11% 11%
35% 65%
Yes
2014 2015(n=1738) (n=2432)
Source: Cisco 2015 Security Capabilities Benchmark Study
84
AppendixCisco 2016 Annual Security Report
Security Risk and Trustworthiness Study
Figure X. Background & Methodology
Methodology: Quantitative and Qualitative Approach
Research Background and Objectives
Source: Security Risk and Trustworthiness Study, Cisco
Cisco is interested in obtaining a deeper understanding of Enterprise and Service Provider IT decision makers’ perceptions of their
organization’s security risks and challenges and the role that IT vendor trustworthiness plays in IT solution purchases.
Specific objectives include:
Two methodologies were utilized to provide insight into each of these research objectives:
(All respondents involved in IT purchase decision=making)
Research was conducted in the U.S., U.K., France,
Germany, and Canada (IDIs only)
Qualitative in-depth interviews among
(7 US., 3 Canada, 3 U.K., 4 Germany, 3 France)
20 service providers
Quantitative web-based survey among
(402 US, 282 UK, 197 Germany, 169 France)
1050 enterprise ITDMs
Data collection took place from
August – September 2015
In-depth interviews
45Minute
Web-based survey
20Minute
Gauge the level of risk
from external and
internal threats and
vulnerabilities
Understand the
strategies, policies,
and solutions being
implemented to
mitigate security risks
Identify the purchase
process for IT
solutions and the role
of IT vendor trustwor-
thiness in that process
Gauge interest in
receiving communica-
tions about how to
validate IT vendor
trustworthiness
Determine if there are
differences in security
risk perspectives or
approaches to
mitigating risks across
industries and
audiences
Figure 93. Background and Methodology
85
AppendixCisco 2016 Annual Security Report
Figure X. Enterprise Respondent Profile Quantitive
Source: Security Risk and Trustworthiness Study, Cisco
Industry (more than 5% reported)
11%
Finance
11%
Healthcare
10%
Non-Computer
Manufacturing
10%
Retail
8%
Government
7%
Insurance
6%
Energy, Oil,
and Gas
5%
Engineering
5%
Telecom.
29%
Other
Job Title
Country Company Size
InfoSec Classification
6%Sr. Engineer/Architect
25%
26%
C-Level (CIO, CSO, CTO, etc.)
U.S.
30%Director
9%Vice President
2%Legal
Manager
3%Engineer
Purchase Involvement
Research/Evaluate Solutions
69%
69%
Set Vision/Strategy
Approve Major Purchases
71%
77%
77%
80%
Ensure Compliance
53%Authorize Funding/Approve Budget
Implement/Manage Solutions
Provide Input or Make Final
Brand Decisions
38%
U.K.
27%
France
16%
Germany
19%
1000-2499
Non-InfoSec
2500-4999
10,000
or more 22%
32%
53%47%
30%
16%
5000-9999
InfoSec
Figure 94. Enterprise Respondent Profile Quantitative
86
AppendixCisco 2016 Annual Security Report
Source: Security Risk and Trustworthiness Study, Cisco
Service Provider Type
Country Company Size
InfoSec Classification
4%
6%
Media Services
11%
11%
Application Services
U.S./Canada
Mobile Telecom.
Tech Services
3%Wired Telecom.
Job Title
Senior Manager
7%CIO/CTO/CSO
8%Director of IT
1%
1%
1%
VP of IT
Manager
2%Sr. Engineer/Architect
Purchase Involvement
Research/Evaluate Solutions
Set Vision/Strategy
Approve Major Purchases
Ensure Compliance
Authorize Funding/Approve
Implement/Manage Solutions
Make Final Brand Decisions
10
U.K. 3
France 3
4Germany
6
14
7 7
6
100-999 5000 or more1000-4900
Non-InfoSecInfoSec
80%
70%
95%
100%
75%
85%
60%
Figure 95. Service Provider Respondent Profile: Qualitative
Americas Headquarters
Cisco Systems, Inc.
San Jose, CA
Asia Pacific Headquarters
Cisco Systems (USA) Pte. Ltd.
Singapore
Europe Headquarters
Cisco Systems International BV Amsterdam,
The Netherlands
Cisco has more than 200 offices worldwide. Addresses, phone numbers, and fax numbers are listed on the Cisco Website at www.cisco.com/go/offices.
Cisco and the Cisco logo are trademarks or registered trademarks of Cisco and/or its affiliates in the U.S. and other countries. To view a list of Cisco
trademarks, go to this URL: www.cisco.com/go/trademarks. Third party trademarks mentioned are the property of their respective owners. The use of the word
partner does not imply a partnership relationship between Cisco and any other company. (1110R)
Americas Headquarters
Cisco Systems, Inc.
San Jose, CA
Asia Pacific Headquarters
Cisco Systems (USA) Pte. Ltd.
Singapore
Europe Headquarters
Cisco Systems International BV Amsterdam,
The Netherlands
Cisco has more than 200 offices worldwide. Addresses, phone numbers, and fax numbers are listed on the Cisco Website at www.cisco.com/go/offices.
Cisco and the Cisco logo are trademarks or registered trademarks of Cisco and/or its affiliates in the U.S. and other countries. To view a list of Cisco
trademarks, go to this URL: www.cisco.com/go/trademarks. Third party trademarks mentioned are the property of their respective owners. The use of the
word partner does not imply a partnership relationship between Cisco and any other company. (1110R)
Americas Headquarters
Cisco Systems, Inc.
San Jose, CA
Asia Pacific Headquarters
Cisco Systems (USA) Pte. Ltd.
Singapore
Europe Headquarters
Cisco Systems International BV Amsterdam,
The Netherlands
Cisco has more than 200 offices worldwide. Addresses, phone numbers, and fax numbers are listed on the Cisco Website at www.cisco.com/go/offices.
Cisco and the Cisco logo are trademarks or registered trademarks of Cisco and/or its affiliates in the U.S. and other countries. To view a list of Cisco
trademarks, go to this URL: www.cisco.com/go/trademarks. Third party trademarks mentioned are the property of their respective owners. The use of the word
partner does not imply a partnership relationship between Cisco and any other company. (1110R)
Americas Headquarters
Cisco Systems, Inc.
San Jose, CA
Asia Pacific Headquarters
Cisco Systems (USA) Pte. Ltd.
Singapore
Europe Headquarters
Cisco Systems International BV Amsterdam,
The Netherlands
Cisco has more than 200 offices worldwide. Addresses, phone numbers, and fax numbers are listed on the Cisco Website at www.cisco.com/go/offices.
Cisco and the Cisco logo are trademarks or registered trademarks of Cisco and/or its affiliates in the U.S. and other countries. To view a list of Cisco
trademarks, go to this URL: www.cisco.com/go/trademarks. Third party trademarks mentioned are the property of their respective owners. The use of the
word partner does not imply a partnership relationship between Cisco and any other company. (1110R)
Adobe, Acrobat, and Flash are either registered trademarks or trademarks of Adobe Systems Incorporated in the United States and/or other countries.
© 2016 Cisco and/or its affiliates. All rights reserved.
Published January 2016

Cisco Annual Security Report

  • 1.
  • 2.
    2 Executive Summary Adversaries anddefenders are both developing technologies and tactics that are growing in sophistication. For their part, bad actors are building strong back-end infrastructures with which to launch and support their campaigns. Online criminals are refining their techniques for extracting money from victims and for evading detection even as they continue to steal data and intellectual property. The Cisco 2016 Annual Security Report—which presents research, insights, and perspectives from Cisco Security Research—highlights the challenges that defenders face in detecting and blocking attackers who employ a rich and ever-changing arsenal of tools. The report also includes research from external experts, such as Level 3 Threat Research Labs, to help shed more light on current threat trends. We take a close look at data compiled by Cisco researchers to show changes over time, provide insights on what this data means, and explain how security professionals should respond to threats. In this report, we present and discuss: THREAT INTELLIGENCE This section examines some of the most compelling trends in cybersecurity as identified by our researchers as well as updates on web attack vectors, web attack methods, and vulnerabilities. It also includes a more extensive look into growing threats such as ransomware. To produce its analysis of observed trends in 2015, Cisco Security Research used a global set of telemetry data. INDUSTRY INSIGHTS This section examines security trends affecting enterprises, including the growing use of encryption and the potential security risks it presents. We look at the weaknesses in how small and midsize businesses (SMBs) are protecting their networks. And we present research on enterprises relying on outdated, unsupported, or end-of-life software to support their IT infrastructure. SECURITY CAPABILITIES BENCHMARK STUDY This section covers the results of Cisco’s second Security Capabilities Benchmark study, which focused on security professionals’ perceptions of the state of security in their organizations. In comparing 2015 survey results with those of 2014, Cisco found that chief security officers (CSOs) and security operations (SecOps) managers are less confident that their security infrastructure is up to date, or that they are able to thwart attacks. However, the survey also indicates that enterprises are stepping up training and other security processes in a bid to strengthen their networks. The study’s findings are exclusive to the Cisco 2016 Annual Security Report. A LOOK FORWARD This section offers a view of the geopolitical landscape affecting security. We discuss findings from two Cisco studies—one examining executives’ concerns about cybersecurity, and the other focusing on IT decision-makers’ perceptions about security risk and trustworthiness. We also give an update on our progress in reducing time to detection (TTD), and underscore the value of moving to an integrated threat defense architecture as a way to combat threats. Executive Summary Security professionals must rethink their defense strategies. Cisco 2016 Annual Security Report
  • 3.
    3 Table of Contents EXECUTIVESUMMARY........................................... 2 MAJOR DEVELOPMENTS AND DISCOVERIES................................................. 4 EYE ON THE PRIZE: FOR MODERN CYBERCRIMINALS, MAKING MONEY IS PARAMOUNT...................................................... 7 THREAT INTELLIGENCE.......................................... 9 Featured Stories..........................................................................10 Industry Collaboration Helps Cisco Sideline Far-Reaching and Highly Profitable Exploit Kit and Ransomware Campaign..............10 Coordinated Industry Effort Helps Cripple One of the Internet’s Largest DDoS Botnets..................................................14 Browser Infections: Widespread— and a Major Source of Data Leakage...........................................16 Botnet Command and Control: A Global Overview.......................17 The DNS Blind Spot: Attacks Using DNS for Command and Control.................................................................19 Threat Intelligence Analysis.......................................................20 Web Attack Vectors.....................................................................20 Web Attack Methods....................................................................21 Threat Updates ...........................................................................23 Vertical Risk of Malware Encounters.............................................25 Web Block Activity: Geographic Overview....................................27 INDUSTRY INSIGHTS...........................................29 Encryption: A Growing Trend—and a Challenge for Defenders............................................................30 Online Criminals Increase Server Activity on WordPress............33 Aging Infrastructure: A Problem 10 Years in the Making............35 Are Small and Midsize Businesses a Weak Link to Enterprise Security?...................................................................37 CISCO SECURITY CAPABILITIES BENCHMARK STUDY...........................................41 Decline in Confidence Amid Signs of Preparedness..................42 A LOOK FORWARD..............................................55 Geopolitical Perspective: Uncertainty in the Internet Governance Landscape................................................56 Cybersecurity Concerns Weigh on Minds of Executives.............57 Trustworthiness Study: Shining a Light on the Risks and Challenges for Enterprises.........................................58 Time to Detection: The Race to Keep Narrowing the Window...............................................................60 The Six Tenets of Integrated Threat Defense.............................62 Power in Numbers: The Value of Industry Collaboration.............63 ABOUT CISCO.....................................................64 Contributors to the Cisco 2016 Annual Security Report.............65 Cisco Partner Contributor..........................................................67 APPENDIX................................................................... 68 Table of Contents Cisco 2016 Annual Security Report
  • 4.
    4 Cisco 2016 AnnualSecurity Report Threat Intelligence Major Developments and Discoveries
  • 5.
    5 Major Developments andDiscoveries •• Cisco, with help from Level 3 Threat Research Labs and cooperation from the hosting provider Limestone Networks, identified and sidelined the largest Angler exploit kit operation in the United States, which was targeting 90,000 victims per day and generating tens of millions of dollars annually for the threat actors behind the campaign. •• SSHPsychos (Group 93), one of the largest distributed denial of service (DDoS) botnets ever observed by Cisco researchers, was significantly weakened by the combined efforts of Cisco and Level 3 Threat Research Labs. Like the Angler case study mentioned above, this success points to the value of industry collaboration to combat attackers. •• Malicious browser extensions can be a major source of data leakage for businesses and are a widespread problem. We estimate that more than 85 percent of organizations studied are affected by malicious browser extensions. •• Well-known botnets like Bedep, Gamarue, and Miuref represented the majority of botnet command-and- control activity affecting one group of organizations we analyzed in July 2015. •• Cisco’s analysis of malware validated as “known bad” found that the majority of that malware—91.3 percent— uses the Domain Name Service (DNS) to carry out campaigns. Through retrospective investigation into DNS queries, Cisco uncovered “rogue” DNS resolvers in use on customer networks. The customers were not aware that the resolvers were being used by their employees as part of their DNS infrastructure. •• Adobe Flash vulnerabilities continue to be popular with cybercriminals. However, software vendors are reducing the risk that users will be exposed to malware through Flash technology. •• Observing the trends in 2015, our researchers suggest that HTTPS encrypted traffic has reached a tipping point: it will soon become the dominant form of Internet traffic. Although encryption can help protect consumers, it also can undermine the effectiveness of security products, making it more difficult for the security community to track threats. Adding to the challenge, some malware may initiate encrypted communications across a diverse set of ports. •• Bad actors are making use of compromised websites created by the popular web development platform WordPress for their criminal activities. There they can marshal server resources and evade detection. Major Developments and Discoveries Cybercriminals have refined their back-end infrastructures to carry out attacks in ways that increase efficiency and profits. Cisco 2016 Annual Security Report
  • 6.
    6 •• Aging infrastructureis growing and leaves organizations increasingly vulnerable to compromise. We analyzed 115,000 Cisco® devices on the Internet and discovered that 92 percent of the devices in our sample were running software with known vulnerabilities. In addition, 31 percent of the Cisco devices in the field that were included in our analysis are “end of sale” and 8 percent are “end of life.” •• In 2015, security executives showed lower confidence in their security tools and processes than they did in 2014, according to Cisco’s 2015 Security Capabilities Benchmark Study. For example, in 2015, 59 percent of organizations said their security infrastructure was “very up to date.” In 2014, 64 percent said the same. However, their growing concerns about security are motivating them to improve their defenses. •• The benchmark study shows that small and midsize businesses (SMBs) use fewer defenses than larger enterprises. For example, 48 percent of SMBs said in 2015 that they used web security, compared to 59 percent in 2014. And 29 percent said they used patching and configuration tools in 2015, compared with 39 percent in 2014. Such weaknesses can place SMBs’ enterprise customers at risk, since attackers may more easily breach SMB networks. •• Since May 2015, Cisco has reduced the median time to detection (TTD) of known threats in our networks to about 17 hours—less than one day. This far outpaces the current industry estimate for TTD, which is 100 to 200 days. Major Developments and DiscoveriesCisco 2016 Annual Security Report
  • 7.
    7 Cisco 2016 AnnualSecurity Report Threat Intelligence Eye on the Prize: For Modern Cybercriminals, Making Money Is Paramount
  • 8.
    8 Eye on thePrize In the past, many online criminals lurked in the shadows of the Internet. They tried to avoid detection by making only brief incursions into enterprise networks to launch their exploits. Today, some emboldened cybercriminals are tapping into legitimate online resources. They leach server capacity, steal data, and demand ransoms from online victims whose information they hold hostage. These campaigns are a sobering escalation in the war between defenders and attackers. If adversaries find more places online from which to operate, then their impact can grow exponentially. In this report, Cisco security researchers highlight the tactics that threat actors use to build a solid infrastructure to make their campaigns stronger and more effective. Adversaries continue to adopt more efficient methods for boosting their profits—and many are paying special attention to harnessing server resources. The explosion in ransomware (see page 10) is a prime example. Ransomware provides criminals with an easy way to extract more money directly from users. When adversaries establish campaigns that compromise tens of thousands of users per day with little or no interruption, the “paycheck” for their efforts can be staggering. In addition to developing better ways to monetize their campaigns, attackers are encroaching on legitimate resources as staging grounds. Creators of some ransomware variants as well as developers of other exploits are now shifting traffic to hacked WordPress websites as a way to avoid detection and use server space (see page 33). And the perpetrators of SSHPsychos, one of the largest botnets ever seen by Cisco researchers, operated on standard networks with little interference until a combined takedown effort by Cisco and Level 3 Threat Research Labs persuaded service providers to block the botnet creator’s traffic. Eye on the Prize: For Modern Cybercriminals, Making Money Is Paramount Cisco 2016 Annual Security Report
  • 9.
  • 10.
    10 Cisco 2016 AnnualSecurity Report Threat Intelligence The Angler exploit kit is one of the largest and most effective exploit kits on the market. It has been linked to several high-profile malvertising (malicious advertising) and ransomware campaigns. And it has been a major factor in the overall explosion of ransomware activity that our threat researchers have been monitoring closely for the past several years. Miscreants use ransomware to encrypt users’ files, providing the keys for decryption only after users pay a “ransom”—usually in the $300 to $500 range. As reported in the Cisco 2015 Midyear Security Report, cryptocurrencies like bitcoin and anonymization networks such as Tor make it easy for adversaries to enter the malware market and quickly begin generating revenue. Ransomware’s rise in popularity can be tied to two main advantages: It is a low-maintenance operation for threat actors, and it offers a quick path to monetization because the users pay adversaries directly in cryptocurrencies. Through research of Angler and related ransomware trends, Cisco determined that some operators of the exploit kit were using an inordinate percentage of worldwide proxy servers for Angler that were on servers operated by Limestone Networks. This server use is a prime example of another trend that our researchers have been observing in the shadow economy of late: threat actors commingling legitimate and malicious resources to carry out their campaigns. In this case, the IP infrastructure supporting Angler was not large. The daily number of active systems generally hovered between 8 and 12. Most were active for only one day. Figure 1 shows the number of unique IP addresses that Cisco observed throughout July 2015. Cisco found that Angler operators were essentially rolling through IP addresses in a linear fashion to conceal the threat activity and to prevent any interruption to their moneymaking. Featured Stories Industry Collaboration Helps Cisco Sideline Far-Reaching and Highly Profitable Exploit Kit and Ransomware Campaign Threat Intelligence Cisco has assembled and analyzed a global set of telemetry data for this report. Our ongoing research and analysis of discovered threats, such as malware traffic, can provide insights on possible future criminal behavior and aid in the detection of threats. Source: Cisco Security Research Figure X. Angler IP Addresses by Date, July 2015 July 2015 16 # of IP Addresses Hovered between 8-12 12 8 4 311 15 2010 Figure 1. Number of Angler IP Addresses by Date, July 2015 SHARE
  • 11.
    11 Cisco 2016 AnnualSecurity Report Threat Intelligence As Figure 2 illustrates, Angler starts with an IP address (here, 74.63.217.218). As the system compromises users and generates “noise” that defenders begin to detect, the adversaries shift to an adjacent IP address (74.63.217.219). This activity continues through near-contiguous blocks of IP space from a single hosting provider. Cisco examined the IP information to identify the autonomous system numbers (ASNs) and the providers associated with the IP addresses. We determined that most of the Angler-related traffic was coming from servers operated by two legitimate hosting providers: Limestone Networks and Hetzner (Figure 3). They accounted for almost 75 percent of the overall volume of traffic for the month of July. Cisco reached out first to Limestone Networks, which appeared to be hosting the largest global portion of Angler. Limestone embraced the opportunity to collaborate. The company had been dealing with excessive credit card chargebacks every month because adversaries were using fraudulent names and credit cards to buy random batches of their servers worth thousands of dollars. 74.63.217.218 Limestone Network IP Addresses July 2015 Figure X. Low IP Infrastructure Supporting Angler 74.63.217.219 74.63.217.220 74.63.217.221 74.63.217.222 74.63.237.178 74.63.237.181 74.63.237.179 74.63.237.180 74.63.237.182 2 8 Source: Cisco Security Research 3 4 5 6 7 Figure 2. Low IP Infrastructure Supporting Angler Figure 3. Angler HTTP Requests by Provider, July 2015 Source: Cisco Security Research Figure X. Angler HTTP Requests by Provider, July 2015 Provider A Provider B Provider C Provider D Provider E Provider F Provider G Provider H Provider I Provider J Provider K Provider L 10,0006000Number of Requests (Limestone Networks) (Hetzner) 75% of all measured traffic SHARE
  • 12.
    12 Cisco 2016 AnnualSecurity Report Threat Intelligence The adversaries’ approach to purchasing the servers made it difficult to associate the fraudulent activity with a single actor. For example, a miscreant might buy three or four servers on one day, and then use a different name and credit card to purchase three or four servers the next day. In this way, they could essentially “roll” from one IP address to the next when compromised servers were identified and taken offline by defenders. To investigate this activity, Cisco enlisted help from Level 3 Threat Research Labs as well as from OpenDNS, a Cisco company. Level 3 Threat Research Labs was able to provide greater global insight into the threat, giving Cisco the ability to see a little deeper into the scope of the threat and how far-reaching it was at its peak. OpenDNS, meanwhile, provided a unique look at the domain activity associated with the threat, giving Cisco a more complete understanding of how techniques like domain shadowing were being incorporated by the adversaries. Cisco threat researchers then looked into how, specifically, users were encountering Angler and subsequently being served malicious payloads. The researchers observed popular websites redirecting users to the Angler exploit kit through malvertising. The false ads were placed on hundreds of major news, real estate, and popular culture sites. These types of sites are commonly referred to in the security community as “known good” sites. Additionally, Cisco threat researchers found countless examples of small, seemingly random websites doing the same type of redirection, including a single person’s obituary from a small, rural newspaper in the United States. More than likely, the latter strategy was designed to target elderly people. This population is generally more likely to use default web browsers such as Microsoft Internet Explorer and are less likely to be aware of the need to regularly patch Adobe Flash vulnerabilities. Another notable aspect of this Angler operation was the volume of unique referers and the low frequency with which they were used (Figure 4). We found more than 15,000 unique sites pushing people to the Angler exploit kit, 99.8 percent of which were used fewer than 10 times. Most of the referers were therefore active only for a short period and were removed after a handful of users were targeted. In our July 2015 analysis, we noted that the peaks in activity coincided with the various Hacking Team zero-day exploits (CVE-2015-5119, CVE-2015-5122).1 Cisco determined that about 60 percent of the Angler payloads delivered through this particular operation were delivering some type of ransomware variant, the majority being Cryptowall 3.0. Other types of payloads included Bedep, a malware downloader that is commonly used to install click-fraud campaign malware. (See “Browser Infections: Widespread—and a Major Source of Data Leakage,” page16.) Both types of malware are designed to help adversaries make a lot of money from compromised users very quickly, and with little or no effort. Figure 4. Unique Referers by Day, July 2015 July 2015 311 15 Source: Cisco Security Research Figure X. Unique Referers by Day, July 2015 Numberofuniquesitesdrivingtraffictoexploitserver Peak activities coincided with zero-day exploits 2K 0 ¹ “Adobe Patches Hacking Team’s Flash Player Zero-Day,” by Eduard Kovacs, SecurityWeek, July 8, 2015: http://www.securityweek.com/adobe-patches-hacking-teams-flash-player-zero-day.
  • 13.
    13 Cisco 2016 AnnualSecurity Report Threat Intelligence According to Cisco’s research, the primary actor responsible for about half of the Angler exploit kit activity in this particular campaign was targeting up to 90,000 victims per day. By our estimation, the campaign was netting the adversaries more than $30 million annually. Presumably, the network out of Hetzner had a similar success rate. That means the threat actor behind the operation involving the Limestone Networks and Hetzner servers was responsible for half of all global Angler activity at the time of Cisco’s analysis. Cisco researchers estimate that this operation was capable of generating gross income of $60 million per year. Angler Revenue X 90Ktargets per server per day 10% served exploits 62% delivered ransomware 2.9% of ransoms paid $ 300 9515 users are paying ransoms per month average ransom 147redirection servers per month $ 34Mgross yearly income for ransomware per campaign 40% compromised = SHARE Figure X. Angler Revenue Source: Cisco Security Research targets per day 90K of Angler infections delivered ransomware 62% unique IP addresses were served exploits in a single day 9K of users being served exploits were compromised 40% 147 average ransom $ 300 gross yearly income for ransomware per campaign $ 34Mof ransoms paid per day redirection servers 2.9% X X =
  • 14.
    14 Cisco 2016 AnnualSecurity Report Threat Intelligence Cisco also discovered that the servers that the users were connecting to did not actually host any of the malicious Angler activity. They were serving as a conduit. A user would get into the redirection chain and submit a GET request for a landing page, which would land on the proxy server. The proxy server would route the traffic to an exploit server in a different country, on a different provider. During our research, we found that a single exploit server was associated with multiple proxy servers. (See Figure 5.) Cisco identified a status server that was handling tasks such as health monitoring. Every single proxy server that the status server was monitoring had a pair of unique URLs. If the path was queried, the status server would return an HTTP status code “204” message. The adversaries could uniquely identify each proxy server and make sure it not only was operating, but also that defenders had not tampered with it. Using the other URL, the attackers could collect the logs from the proxy server and determine how efficiently their network was operating. Industry collaboration was a critical component in Cisco’s ability to investigate the Angler exploit kit activity. Ultimately, it helped stop redirects to the Angler proxy servers on a U.S. service provider and bring awareness to a highly sophisticated cybercrime operation that was affecting thousands of users every day. Cisco worked closely with Limestone Networks to identify new servers as they were brought online and monitored them closely to make sure they were taken down. After a while the adversaries moved away from Limestone Networks, and a global decrease in Angler activity followed. Coordinated Industry Effort Helps Cripple One of the Internet’s Largest DDoS Botnets Integrated threat defense technologies can often halt major attacks before they affect enterprise networks. However, in many cases, bringing down a potentially massive attack requires not only technological defenses, but also coordination among service providers, security vendors, and industry groups. As criminals become even more serious about monetizing their activities, the technology industry needs to do a better job of partnering to take down criminal campaigns. SSHPsychos (also called Group 93), one of the largest DDoS botnets ever observed by Cisco security researchers, was significantly weakened after Cisco collaborated with Level 3 Threat Research Labs. Figure 5. Angler Back-End Infrastructure User Status ServerProxy Server Exploit Server Requests page Referred to proxy server Proxy server gets data from exploit server (Port 81) Exploit server sends HTTP requests to status server Rollup of log data pushed to master server Status server tracks HTTP requests/status Figure X. Angler: Back–End Infrastructure Source: Cisco Security Research Master Server SHARE For more information on how Cisco disrupted a significant international revenue stream generated by the Angler exploit kit, read the Cisco Security blog post “Threat Spotlight: Cisco Talos Thwarts Access to Massive International Exploit Kit Generating $60M Annually from Ransomware Alone.”
  • 15.
    15 Cisco 2016 AnnualSecurity Report Threat Intelligence UNIQUE THREAT The SSHPsychos DDoS network is a unique threat for several reasons. Because it enlists tens of thousands of machines distributed across the Internet, it has the power to launch a distributed denial of service (DDoS) attack that cannot be addressed on a device-by-device basis. In this case, the botnet was being created using brute-force attacks involving secure shell (SSH) traffic (Figure 6). The SSH protocol is used to allow secure communications, and it is commonly used for the remote administration of systems. At times, SSHPsychos accounted for more than 35 percent of all global Internet SSH traffic (Figure 7), according to analysis by Cisco and Level 3. SSHPsychos is operational in two countries: China and the United States. The brute-force login attempts, using 300,000 unique passwords, originated from a hosting provider based in China. When adversaries were able to log in by guessing the correct root password, the brute-force attacks ceased. Twenty-four hours later, adversaries then logged in from a U.S. IP address and installed a DDoS rootkit to the affected machine. This was clearly a tactic to reduce suspicion from network administrators. The botnet’s targets varied, but in many cases appeared to be large Internet service providers (ISPs). Scanners completing successful logins Malware Host SSH brute-force attempts (300K unique passwords) Target Network Source: Cisco Security Research Figure 6. SSHPsychos Uses Brute-Force Attacks Figure 7. At Its Peak, SSHPsychos Accounted for 35 Percent of Global Internet Traffic 50K 100K 150K Brute-Force Attempts Feb. Mar. Apr. SSHPsychos 103.41.125.0/23 SSHPsychos 43.255.190.0/23SSHPsychos 103.41.124.0/23 Figure X. At Peak, SSHPsychos Accounted for 35% of Internet SSH Traffic Source: Cisco Security Research SHARE
  • 16.
    16 Cisco 2016 AnnualSecurity Report Threat Intelligence COLLABORATING WITH SECURITY EXPERTS Because of the scale of the DDoS network, our researchers believed that the damage would be difficult to contain. It was essential to work in tandem with an organization that could remove the brute-forcing group from the Internet effectively. However, backbone providers are hesitant to filter their customers’ content. Cisco reached out to Level 3 Threat Research Labs. Level 3 analyzed the traffic at the netblock, or range of IP addresses, where SSHPsychos was thought to reside (103.41.124.0/23). It confirmed that no legitimate traffic was originating from or destined for that address. It null- routed the network traffic within its own networks. Then it contacted service providers for the relevant domains to ask them to remove the network’s traffic. The results of this effort were seen immediately (Figure 8). The original network showed almost no new activity. However, a new network at netblock 43.255.190.0/23 showed large amounts of SSH brute-force attack traffic. It had the same behavior that was associated with SSHPsychos. Following this sudden re-emergence of SSHPsychos-like traffic, Cisco and Level 3 decided to take action against 103.41.124.0/23, as well as the new netblock 43.255.190.0/23. Taking down the netblocks used by SSHPsychos did not permanently disable the DDoS network. However, it certainly slowed down its creators’ ability to run their operations, and it prevented SSHPsychos from spreading to new machines, at least temporarily. As cybercriminals build large attack networks, the security industry must explore ways to collaborate when faced with a threat such as SSHPsychos. Top-level domain providers, ISPs, hosting providers, DNS resolvers, and security vendors can no longer sit on the sidelines when online criminals launch their exploits on networks that are intended to carry only legitimate traffic. In other words, when criminals deliver malicious traffic in what is more or less plain sight, the industry must remove the malicious pathways to these legitimate networks. Browser Infections: Widespread—and a Major Source of Data Leakage Security teams often view browser add-ons as a low- severity threat. However, they should make monitoring them a higher priority so that they can quickly identify and remediate these types of infections. The reason for urgency: Our research indicates that browser infections are much more prevalent than many organizations may realize. From January to October 2015, we examined 26 families of malicious browser add-ons (Figure 9). Looking at the pattern of browser infections during these months, the number of infections seemed to be on a general decline. 0 180K Brute-Force Attempts Cisco Collaborating with Level 3 120K 60K June July Figure X. SSHPsychos Traffic Drops Dramatically After Intervention Source: Cisco Security Research Figure 8. SSHPsychos Traffic Drops Dramatically After Intervention Figure 9. Browser Infections, January to October 2015 To learn more about Cisco and Level 3 Threat Research Labs’ response to the SSHPsychos threat, read the Cisco Security blog post “Threat Spotlight: SSHPsychos.” Jan. 0.5% Percentage 0.3% 0 Browser Infection Detection Jul.Apr. 2015 Oct. Source: Cisco Security Research Figure X. Increased Encryption Makes IOC Detection More Difficult 40%
  • 17.
    17 Cisco 2016 AnnualSecurity Report Threat Intelligence This pattern is deceptive, however. The increasing volume of HTTPS traffic over those months made it difficult to identify the indicators of compromise typically associated with the 26 families we tracked because URL information was not visible due to encryption. (For more on encryption, and the challenges it creates for defenders, see “Encryption: A Growing Trend—and a Challenge for Defenders,” page 30.) Malicious browser extensions can steal information, and they can be a major source of data leakage. Every time a user opens a new webpage with a compromised browser, malicious browser extensions collect data. They are exfiltrating more than the basic details about every internal or external webpage that the user visits. They are also gathering highly sensitive information embedded in the URL. This information can include user credentials, customer data, and details about an organization’s internal APIs and infrastructure. Multipurpose malicious browser extensions are delivered by software bundles or adware. They are designed to pull in revenue by exploiting users in a number of ways. In an infected browser, they can lead users to click on malvertising such as display ads or pop-ups. They can also distribute malware by enticing users to click a compromised link or to download an infected file encountered in malvertising. And they can hijack users’ browser requests and then inject malicious webpages into search engine results pages. Across the 45 companies in our sample, we determined that in every month we observed more than 85 percent of organizations were affected by malicious browser extensions—a finding that underscores the massive scale of these operations. Because infected browsers are often considered a relatively minor threat, they can go undetected or unresolved for days or even longer—giving adversaries more time and opportunity to carry out their campaigns (see “Time to Detection: The Race to Keep Narrowing the Window,” page 60). We therefore suggest that it is well worth security teams’ time to devote more resources to monitoring this risk, and to consider increased use of automation to help prioritize threats. Botnet Command and Control: A Global Overview Botnets are networks of malware-infected computers. Adversaries can control them as a group and command them to carry out a specific task, such as sending spam or launching a DDoS attack. They have been growing in both size and number for years. To better understand the current threat landscape on a global scale, we analyzed the networks of 121 companies from April to October 2015 for evidence of one or more of eight commonly seen botnets. The data was normalized to provide a general overview of botnet activity (Figure 10). We found that during this period, Gamarue—a modular, multipurpose information stealer that has been around for years—was the most common command-and-control threat. BotnetActivityVolume 400 0 Apr. May Jun. Jul. Aug. Sep. Oct. 2015 Miuref Other Gamarue Vawtrak Bedep Cryptowall Figure X. Growth of Individual Threats (Ratio of Infected Users) Source: Cisco Security Research Figure 10. Growth of Individual Threats (Ratio of Infected Users)
  • 18.
    18 Cisco 2016 AnnualSecurity Report Threat Intelligence A significant spike in the number of infections involving the ransomware Cryptowall 3.0 was identified in July. This activity is attributed largely to the Angler exploit kit, which is known to drop the Cryptowall payload. As reported in the Cisco 2015 Midyear Security Report, the authors of Angler and other exploit kits have been quick to exploit “patching gaps” with Adobe Flash—the time between Adobe’s release of an update and when users actually upgrade.² Cisco threat researchers attribute the July 2015 spike to the Flash zero-day exploit CVE-2015-5119 that was exposed as part of the Hacking Team leaks.³ The Angler exploit kit also delivers the Bedep Trojan, which is used to perform click-fraud campaigns. A slight spike in the prevalence of that threat was noted during July as well (Figure 11). Bedep, Gamarue, and Miuref (another Trojan and browser hijacker that can perform click fraud) together represented more than 65 percent of the botnet command-and-control activity in the user base we analyzed. The percentage of Bedep infections remained relatively stable during the period we analyzed. However, a perceived decrease in Miuref infections was observed. We attribute this to the increase in HTTPS traffic, which helped to conceal Miuref’s indicators of compromise. Figure 12 shows the types of botnets that were responsible for the most infections during the time frame we monitored. Multipurpose botnets like Gamarue and Sality led the pack, followed by click-fraud botnets. Banking Trojans were third, showing that this type of threat, while old, is still widespread. Comparison of Botnet Infections 200 0 100 Spike due to zero–day exploit Figure X. Monthly Threat Coverage, Based on Number of Infected Users Apr. May Jun. Jul. Aug. Sep. Oct. 2015 MiurefGamarue Vawtrak Bedep Cryptowall Source: Cisco Security Research Figure 11. Monthly Threat Coverage, Based on the Number of Infected Users Figure X. Monthly Threat Coverage, Based on Threat Categories Apr. May Jun. 0 100 Jul. Aug. Sep. Oct. 2015 Click-Fraud Botnets Ransomware Multipurpose Botnets Banking Trojans Source: Cisco Security Research %ofBotnetTypes Figure 12. Monthly Threat Coverage, Based on Threat Categories ² Cisco 2015 Midyear Security Report: http://www.cisco.com/web/offers/lp/2015-midyear-security-report/index.html. ³ “Adobe Patches Hacking Team’s Flash Player Zero-Day,” by Eduard Kovacs, SecurityWeek, July 8, 2015: http://www.securityweek.com/adobe-patches-hacking-teams-flash-player-zero-day. SHARE
  • 19.
    19 Cisco 2016 AnnualSecurity Report Threat Intelligence Cisco’s analysis of malware validated as “known bad” found that the majority of that malware—91.3 percent—use the Domain Name Service in one of these three ways: •• To gain command and control •• To exfiltrate data •• To redirect traffic To arrive at this percentage, we mined all sample behaviors from a variety of sandboxes that we own. Malware that was determined not to use DNS in any way, or that simply used DNS to conduct Internet “health checks,” was removed from the sample for analysis. The remaining malware was using DNS to connect to sites that were validated as bad or were considered suspicious. Despite adversaries’ reliance on DNS to help further malware campaigns, few companies are monitoring DNS for security purposes (or monitoring DNS at all). This lack of oversight makes DNS an ideal avenue for attackers. According to a recent survey we conducted (see Figure 13), 68 percent of security professionals report that their organizations do not monitor threats from recursive DNS. (Recursive DNS nameservers provide the IP addresses of intended domain names to the requesting hosts.) Why is DNS a security blind spot for so many organizations? A primary reason is that security teams and DNS experts typically work in different IT groups within a company and don’t interact frequently. But they should. Monitoring DNS is essential for identifying and containing malware infections that are already using DNS for one of the three activities listed earlier. It is also an important first step in mapping out other components that can be used for further investigating an attack, from determining the type of infrastructure supporting the attack to finding its source. Monitoring DNS takes more than collaboration between security and DNS teams, however. It requires the alignment of the right technology and expertise for correlation analysis. (For more insight, see “Industry Collaboration Helps Cisco Sideline Far-Reaching and Highly Profitable Exploit Kit and Ransomware Campaign” on page 10 to find out how OpenDNS helped Cisco gain more domain visibility into the IPs that the Angler exploit kit was using.) RETROSPECTIVE DNS ANALYSIS Cisco’s retrospective investigation into DNS queries and subsequent TCP and UDP traffic identifies a number of malware sources. These include command-and-control servers, websites, and distribution points. Retrospective investigation also detects high-threat content using intelligence from threat lists, community threat reports, observed trends in cyber compromises, and knowledge of the unique vulnerabilities facing a customer’s industry. Our retrospective reporting helps to identify “low and slow” data exfiltration attempts commonly associated with advanced persistent threat (APT) behavior and which, in many cases, is not captured by traditional threat detection technologies. The objective of the analysis is to identify anomalies within the vast quantity of outgoing communications traffic. This “inside out” approach can uncover possible data compromises and damaging network activity that might otherwise be overlooked. Figure X. Monitoring Threats via Recursive DNS Source: Cisco Security Research of organizations don’t monitor recursive DNS of malware uses DNS in attacks 68%91.3% Figure 13. Monitoring Threats from Recursive DNS The DNS Blind Spot: Attacks Using DNS for Command and Control
  • 20.
    20 Cisco 2016 AnnualSecurity Report Threat Intelligence This is how we have uncovered “rogue” DNS resolvers in use on customer networks. The customers were not aware that the resolvers were being used by their employees as part of their DNS infrastructure. Failing to actively manage and monitor the use of DNS resolvers can result in malicious behavior such as DNS cache poisoning and DNS redirection. Besides discovering and identifying rogue DNS resolvers, retrospective investigation has also uncovered the following issues in customer networks: •• Customer address space found on third-party spam and malware blocklists •• Customer address space beaconing for known Zeus and Palevo command-and-control servers •• Active malware campaigns, including CTB-Locker, Angler, and DarkHotel •• Suspicious activity, including the use of Tor, email auto-forwarding, and online document conversion •• Pervasive DNS tunneling to Chinese-registered domains •• DNS “typosquatting”⁴ •• Internal clients bypassing the customer’s trusted DNS infrastructure Looking at a select sample of Cisco Custom Threat Intelligence customers across multiple verticals, we also found the following types of malware in the respective percentage of total customers examined: Threat Intelligence Analysis Web Attack Vectors ADOBE FLASH: ON THE WAY OUT—EVENTUALLY Despite the fact that overall Flash volume has decreased over the past year (see next section, “Adobe Flash and PDF Content Trends”), it still remains a favored tool of exploit kit developers. In fact, there was no discernable trend in Flash malware either increasing or decreasing in 2015 (Figure 14). Flash-related malware is likely to remain a pri- mary exploitation vector for some time: Of note, the Angler exploit kit authors heavily target Flash vulnerabilities. Industry pressure to remove Adobe Flash from the browsing experience is leading to a decrease in the amount of Flash content on the web (see next section, “Adobe Flash and PDF Content Trends”). This is similar to what has been seen with Java content in recent years, and which has, in turn, led to a steady downward trend in the volume of Java malware (In fact, Angler’s authors don’t even bother to include Java exploits anymore). Meanwhile, the volume of PDF malware has remained fairly steady. Microsoft Silverlight also has diminished as an attack vector because many vendors have discontinued supporting the API that Silverlight uses to integrate into browsers. Many companies are moving away from Silverlight as they embrace HTML5-based technologies. Microsoft has indicated that there is no new version of Silverlight on the horizon and is currently only issuing security-related updates. Figure X. Types of Malware Number of Total Customers Source: Cisco Security Research 4/5 3/5 Angler Exploit Kit Cutwail Spam Botnet Dyre Exploit Kits (General) Bedep Trojan Ransomware Onion.city (Dark Search Engine) Onion Router Traffic Figure X. Types of Malware Number of Total Customers Source: Cisco Security Research 4/5 3/5 Angler Exploit Kit Cutwail Spam Botnet Dyre Exploit Kits (General) Bedep Trojan Ransomware Onion.city (Dark Search Engine) Onion Router Traffic 30 500 20,000 Log Volume Sep. 2013 Sep. 2015 Flash Java PDF Figure X. Share of Attack Vectors, Two–Year Comparison Source: Cisco Security Research Figure 14. Share of Attack Vectors, 2-Year Comparison ⁴ Typosquatting is the act of registering a domain name that is similar to an existing domain name; this is a strategy used by adversaries to target users who inadvertently mistype intended domain names.
  • 21.
    21 Cisco 2016 AnnualSecurity Report Threat Intelligence ADOBE FLASH AND PDF CONTENT TRENDS Cisco researchers have been watching a general decline in the amount of Adobe Flash content on the web (Figure 15). Recent actions by Amazon, Google, and other large players in the Internet space are a factor for the decrease in Flash content. These companies either no longer accept web advertising that uses Flash, or they block it. PDF content, meanwhile, has remained fairly stable over the past year and is likely to remain so. However, it has not been a major web attack vector for some time. The decline in Flash content is likely to continue—and perhaps, even accelerate—in the near term now that Adobe has announced that it will be phasing out Flash.⁵ But it will likely be some time before Flash content fades. Flash is embedded in browsers such as Google Chrome, Microsoft Internet Explorer, and Microsoft Edge and is still widely used in web content, including gaming and video content. However, in the years ahead, as new technologies are adopted (such as HTML5 and mobile platforms), the longer-term trend for web attack vectors like Java, Flash, and Silverlight is becoming increasingly clear. Over time, they will become less prevalent. Therefore, they are likely to become much less attractive vectors to profit-minded adversaries who focus on vectors that allow them to easily compromise large populations of users and generate revenue quickly. Web Attack Methods Figures 16 and 17 show the various types of malware that adversaries are using to gain access to organizational networks. Figure 16 illustrates the most commonly seen malware: adware, spyware, malicious redirectors, iFrame exploits, and phishing. Figure 15. Percentage of Overall Traffic for Flash and PDF Jan. % of Overall Internet Traffic 60% 14% Nov. Source: Cisco Security Research Figure X. Percentage of Total Traffic for Flash and PDF Flash PDF Figure 16. Most Commonly Observed Malware Source: Cisco Security Research Sum (sample_count) x1000 Figure X. Most Commonly Observed Malware Windows Binaries5070 Windows Trojan Downloader4911 JavaScript Trojan Downloader14,816 Facebook Scams36,681 JavaScript31,627 Phishing3798 iFrame3726 JavaScript Obfuscation3552 Redir3383 3261 Android Trojan Downloader ⁵ “Adobe News: Flash, HTML5 and Open Web Standards,” Adobe, November 30, 2015: http://blogs.adobe.com/conversations/2015/11/flash-html5-and-open-web-standards.html.
  • 22.
    22 Cisco 2016 AnnualSecurity Report Threat Intelligence Figure 16 can essentially be viewed as a collection of types of malware that criminals use to gain initial access. These are the tried-and-true and most cost-effective methods of compromising large populations of users with relative ease. JavaScript exploits and Facebook scams (social engineering) were the most frequently used attack methods, according to our research. Figure 17 shows lower-volume malware. Note that “lower volume” does not mean “less effective.” According to Cisco Security Research, lower-volume malware can represent emerging threats or highly targeted campaigns. Many of these more sophisticated techniques are designed to extract as much value as possible from compromised users. They steal high-value data, or hold users’ digital assets for ransom. Therefore, when monitoring web malware, it is not enough to simply focus on the types of threats most commonly seen. The full spectrum of attacks must be considered. Source: Cisco Security Research Figure X. Sample of Lower-Volume Malware Observed Sum (sample_count) <40 Windows Downloader “Upatre”2 Windows Backdoor2 Windows Hoax2 Trojan Downloader3 Suspicious PDFs7 Windows Backdoor “Ace”5 JavaScript “Blackhole”10 Windows Trojan9 Windows “Gampass” Malware15 Windows “Krap-K” Malware35 Windows “Sality” Malware44 Windows Worm1 Windows Trojan “Upatre”1 Windows Tojan Downloader1 iFrame2 JavaScript Trojan Downloader1 Figure 17. Sample of Observed Lower-Volume Malware
  • 23.
    Cisco 2016 AnnualSecurity Report Threat Intelligence Figure 18. Total Number of CVEs by Vendor Source: Cisco Security Research, National Vulnerability Database Figure X. Total Number of CVEs by Vendor O racle M icrosoft Cisco Adobe Apple IBM Google M ozillaW ordPress Ubuntu (Canonical) Debian HP EM C Linux Red Hat SAP Apache Siem ensFedora ProjectW ireshark Novell NumberofCVEs 200 0 400 600 Source: Cisco Security Research, Metasploit, Exploit DB 5 0 10 15 20 Adobe Microsoft Apple Cisco Novell Joomla VMware AvailablePublicExploits Figure X. Number of Public Exploits Available by Vendor Vulernability Figure 19. Number of Public Exploits Available by Vendor Vulnerability The chart above shows the total number of CVEs published in 2015 by vendor. Note that Adobe is not as prominent on this chart as it is in the chart on the right, which shows the vulnerabilities for which exploits are available. In addition, WordPress shows only 12 vulnerabilities for 2015 for its own product. The additional 240 vulnerabilities come from plugins and scripts created by third-party contributors. As noted in Figure 20, lists of vulnerabilities and related exploits can provide guidance for security professionals. They can use them to manage and prioritize the vulnerabilities that are high risk and most common, and patch them more quickly than low-risk vulnerabilities. See the CVE Details website (https://www.cvedetails.com/top-50-products.php) for more information about CVEs by vendor. 23 Threat Updates ADOBE FLASH TOPS VULNERABILITIES LIST The Adobe Flash platform has been a popular threat vector for criminals for several years. Flash vulnerabilities still turn up frequently on lists of high-urgency alerts. In 2015, the good news was that the vendors of products in which these exploits commonly occur, such as web browsers, recognized this weakness and are now taking steps to reduce opportunities for adversaries. In 2016, criminals are most likely to focus their exploits and attacks on Adobe Flash users. Some of these Flash vulnerabilities have exploits available online either publicly or for sale as part of exploit kits. (As noted on page 21, the volume of Flash-related content has declined, but Flash remains a primary exploitation vector.) Following up on tactics used to lessen the impact of Java— another common threat vector—many web browsers block or sandbox Flash as a way to protect users. Although this is a positive development, it’s important to remember that attackers will still succeed in launching exploits for some time to come. Users may fail to update their browsers as needed, and criminals will continue to launch exploits aimed at older versions of browser software. However, Cisco researchers believe that the protections now built into some commonly used web browsers and operating systems will lessen criminals’ reliance on Flash. Because online attackers focus on achieving the best possible results (such as high profitability) for the most efficiency, they will put little effort into attacks that are less likely to provide a return on investment. SHARE
  • 24.
    24 Flash EK Hanjuan NullHole Sweet Orange Fiesta Nuclear Rig Neutrino NuclearPack Magnitude Angler CVE-2015 - 7645556024191671 51225119311331043090035903360311 03130310 Figure X. Common Vulnerabilities Source: Cisco Security Research Public Exploits 3105 Flash Vulnerabilities Other Vulnerabilities Figure 20. Common Vulnerabilities Figure 20 displays high-risk vulnerabilities, and indicates whether the vulnerability is part of an exploit kit for hire (see “Flash EK” line) or has exploits publicly available (see “Public Exploits” line). Vulnerabilities for which functional exploits are available are a high priority for patching. This list can be used to help security professionals prioritize their patching and remediation activities. The existence of an exploit for a given product—publicly or within an exploit kit—does not necessarily indicate that attacks are occurring. Cisco 2016 Annual Security Report Threat Intelligence
  • 25.
    25 Cisco 2016 AnnualSecurity Report Threat Intelligence Vertical Risk of Malware Encounters To track high-risk verticals for web malware encounters, we examined the relative volumes of attack traffic (“block rates”) and “normal” or expected traffic. Figure 21 shows the top 28 industries and their relative block activity as a proportion of normal network traffic. A ratio of 1.0 means the number of blocks is proportional to the volume of observed traffic. Anything above 1.0 represents higher-than-expected block rates, and anything below 1.0 represents lower-than-expected block rates. Source: Cisco Security Research 1 6 8 4 2 1 6 8 4 2 1 6 8 4 2 1 6 8 4 2 Nov. 2014 Sept. 2015 Nov. 2014 Sept. 2015 Nov. 2014 Sept. 2015 Nov. 2014 Sept. 2015 Food and Beverage Transportation and Shipping Entertainment Heating, Plumbing, and A/C Engineering and Construction Industrial Healthcare Professional Services ElectronicsGovernment Utilities Insurance Education IT Telecom. Accounting Media and Publishing Aviation Travel and Leisure Charities and NGO Real Estate and Land Mgmt. Pharmaceutical and Chemical Automotive Legal Retail and Wholesale Banking and Finance Energy, Oil, and Gas Manufacturing Agriculture and Mining 1 4 2 1 4 2 1 4 2 1 4 2 1 4 2 1 4 2 1 2 1 4 2 1 4 2 1 4 2 1 4 2 1 4 2 1 4 2 1 4 2 1 4 2 1 4 2 1 2 1 2 1 2 1 2 1 2 1 2 1 2 1 2 4 Figure 21. Monthly Vertical Block Rates, November 2014–September 2015
  • 26.
    26 Cisco 2016 AnnualSecurity Report Threat Intelligence SHARE Figure 22 illustrates how adversaries’ focus on specific verticals can be fleeting. (Zero represents no net change.) From January to March 2015, government was the vertical with the highest block rate activity. From March to May, it was electronics. In midsummer, professional services saw the most blocks. And in the fall of 2015, healthcare was leading all verticals in the number of block rates. According to our research, the four verticals with the most block activity in 2015 were all targeted with Trojan-related attacks. The government vertical also faced a high number of PHP injection attacks, while the professional services vertical was hit with a high number of iFrame attacks. Figure 22. Relative Block Rates of Verticals, Month to Month Comparison Source: Cisco Security Research Nov. 2014 Sept. 2015 Nov. 2014 Sept. 2015 Nov. 2014 Sept. 2015 Nov. 2014 Sept. 2015 Food and Beverage Transportation and Shipping Entertainment Heating, Plumbing, and A/C Engineering and Construction Industrial Utilities Insurance Education IT Telecom. Accounting Media and Publishing Aviation Travel and Leisure Charities and NGO Real Estate andLand Mgmt. Pharmaceutical and Chemical Automotive Legal Retail and Wholesale Banking and Finance Energy, Oil, and Gas Manufacturing Agriculture and Mining -2 2 0 -2 2 0 -2 2 0 -2 2 0 -2 2 0 -2 2 0 -2 2 0 -2 2 0 -2 2 0 -2 2 0 -2 2 0 -2 2 0 -2 2 0 -2 2 0 -2 2 0 -2 2 0 -2 2 0 -2 2 0 -2 2 0 -2 2 0 -2 2 0 -2 2 0 -2 2 0 -2 2 0 -8 4 8 0 -2 -8 4 8 0 -2 -8 4 8 0 -2 -8 4 8 0 -2 Healthcare Professional Services ElectronicsGovernment
  • 27.
    27 Cisco 2016 AnnualSecurity Report Threat Intelligence Poland 1.5 Figure X. Web Blocks by Country or Region Russia 1Denmark 1 Japan 1 Canada 1.5 China 4France 2 Block activity = malicious traffic/expected traffic United States 1 Source: Cisco Security Research Hong Kong 9 Germany 1.5 Figure 23. Web Blocks by Country or Region Web Block Activity: Geographic Overview We also examined where malware-based block activity originates by country or region, as seen in Figure 23. The countries were selected for the study based on their volume of Internet traffic. A “block ratio” value of 1.0 indicates that the number of blocks we see is proportional to network size. Countries and regions with block activity that we consider higher than normal probably have many web servers and hosts with unpatched vulnerabilities on their networks. Malicious actors do not respect country boundaries and will host malware where it is most effective.
  • 28.
    28 Cisco 2016 AnnualSecurity Report Threat Intelligence A presence in large, commercially viable networks that handle high Internet volume is another factor for high block activity—which is one reason why Hong Kong tops our list. Figure 24, which shows a month-to-month comparison of web blocks by country or region from November 2014 to October 2015, provides some additional context for these rankings. Note that Hong Kong saw higher than normal web block activity beginning in the spring of 2015, as did France. Both have since experienced a significant drop in web block activity, but because the higher rates of activity earlier this year were so far above the baseline, the recent decline in activity still leaves Hong Kong quite higher by the end of the year than at the start. The spike in block activity in France returned to normal levels by midsummer. Figure X. Realative Web Block Activity by Country or Region, Month to Month, November 2014–October 2015 Source: Cisco Security Research Nov. 2014 Hong Kong Germany Feb. Apr. Jun. Aug. Oct.Nov. 2014 0 1 3 5 7 9 11 13 15 0 1 3 5 0 1 3 5 7 9 0 1 3 5 7 9 0 1 3 5 0 1 3 5 7 9 11 13 15 1717 1919 2121 France Australia Italy Feb. Apr. Jun. Aug. Oct. China 2015 2015 Figure 24. Web Blocks by Country or Region, Month to Month, November 2014-October 2015
  • 29.
    29 Cisco 2016 AnnualSecurity Report Threat Intelligence Industry Insights
  • 30.
    3030 Industry InsightsCisco 2016Annual Security Report Encryption makes sense. Companies need to protect their intellectual property and other sensitive data, advertisers want to preserve the integrity of their ad content and back- end analytics, and businesses are placing more focus on protecting their customers’ privacy. But encryption also creates security issues for organizations— including a false sense of security. Organizations have become better at encrypting data when it is transmitted between entities, but data at rest is often left unsecured. Many of the most notable breaches in the last few years have taken advantage of unencrypted data stored in the data center and other internal systems. For attackers, this is like following a secured supply truck to an unlocked warehouse. It is also important for organizations to understand that end-to-end encryption can lessen the effectiveness of some security products. Encryption conceals the indicators of compromise used to identify and track malicious activity. But there is no excuse to leave sensitive data unencrypted. Security tools and their operators need to adapt to this brave new world by gathering headers and other non-encrypted parts of the data stream along with other sources of contextual information to analyze encrypted traffic. Tools that rely on payload visibility, such as full packet capture, are becoming less effective. Running Cisco NetFlow and other metadata-based analyses is now essential. Observing the trends of 2015, our researchers suggest that encrypted traffic, particularly HTTPS, has reached a tipping point. While not yet the majority of transactions, it will soon become the dominant form of traffic on the Internet. In fact, our research shows that it already consistently represents over 50 percent of bytes transferred (Figure 25) due to the HTTPS overhead and larger content that is sent via HTTPS, such as transfers to file storage sites. For any web transaction, a number of bytes is sent out (outbound) and received (inbound). HTTPS transactions have larger outbound requests than HTTP outbound requests—about an extra 2000 bytes. HTTPS inbound requests, meanwhile, also have overhead, but this becomes less significant with larger responses. Industry Insights Cisco provides research and analysis on security trends and practices. Paradoxically, some may make defenders’ ability to track threats more challenging and place organizations and individual users at greater risk for compromise or attack. 46% 57% Figure X.SSL Percentages % HTTPS Requests 2015 % Total Bytes Jan. Oct. 60 Percentage of Traffic 20 40 24% 33.56% Source: Cisco Security Research Figure 25. SSL Percentages Encryption: A Growing Trend—and a Challenge for Defenders SHARE
  • 31.
    3131 Industry InsightsCisco 2016Annual Security Report By combining the incoming and outgoing bytes per web transaction, we can determine the overall percentage of all bytes involved per web transaction that are encrypted using HTTPS. Due to the increase in HTTPS traffic and the extra overhead, we determined that HTTPS bytes represented 57 percent of all web traffic in October 2015 (Figure 25), up from 46 percent in January. We also determined through web traffic analysis that HTTPS requests have been increasing gradually, but significantly, since January 2015. As Figure 25 shows, 24 percent of the requests in January used the HTTPS protocol; the rest of them used HTTP. By October, 33.56 percent of the requests observed were HTTPS. Additionally, we found that the percentage of inbound HTTPS bytes had increased. This was true throughout the year. As the amount of traffic using HTTPS increases, more bandwidth is required. An additional 5 Kbps is required per transaction. We attribute the overall increase in encrypted web traffic primarily to these factors: •• More mobile traffic from applications, which inherently encrypt •• More requests from users to download encrypted video •• More requests to storage and backup servers that hold sensitive “data at rest,” which adversaries are eager to tap In fact, Figure 26 shows that HTTPS requests to online storage and backup resources had increased by 50 percent since the start of 2015. File transfer services are also up significantly during the same period—36 percent. Ultimately, there is increasing encrypted activity occurring in both the number of encrypted transactions and the number of encrypted bytes in each transaction. Each one poses its own benefit and its own potential risk, ushering in the need for an integrated threat defense that helps increase visibility. % Delta2015 Online Storage and Backup 50% File Transfer Services 36% Webpage Translation 32% Photo Search/Images 27% Gambling 26% Pornography 25% Internet Telephony 19% Streaming Video 17% Search Engines and Portals 14% Personal Sites 14% Reference 13% Illegal Downloads 13% Online Communities 12% Illegal Drugs 11% Government and Law 10% Lingerie and Swimsuits 10% Web-Based Email 10% Adult 8% Advertisements 8% Mobile Phones 8% Figure X. HTTPS Request- Biggest Changes from January to September 2015 Source: Cisco Security Research Figure 26. HTTPS Requests: Biggest Changes from January to September 2015 SHARE
  • 32.
    3232 Industry InsightsCisco 2016Annual Security Report Looking at the top domains by requests (Figure 27), we see that many of the main content pages of Google and Facebook are encrypted. Typically, only 10 percent of their advertising traffic is encrypted. Regardless of the challenges, data encryption is a requirement in the current threat landscape. Attackers are too adept at circumventing access control for users to leave critical information unprotected at any stage of storage or transfer. This is why it is essential for security teams to monitor web traffic patterns to make sure that HTTPS requests are not coming from or going to suspicious locations. A word of caution: Don’t look for encrypted traffic over a predefined set of ports. As discussed in the next section, our research shows that malware is likely to initiate encrypted communications over a diverse set of ports. THE ENTROPY FACTOR High entropy is a good indication of encrypted or compressed file transfers or communication.⁶ The good news for security teams is that entropy is relatively easy to monitor because it does not require knowledge of the underlying cryptographic protocols. During a 3-month period beginning June 1, 2015, Cisco security researchers observed 7,480,178 flows from 598,138 “threat score: 100” malware samples submitted. There were 958,851 high-entropy flows during this period, or 12.82 percent. We also identified 917,052 flows over the Transport Layer Security (TLS) protocol (12.26 percent). In addition, 8419 TLS flows were over a port other than 443—the default port for secured HTTP. Some of the ports that the observed malware used for communication were ports 21, 53, 80, and 500. As the level of encrypted Internet traffic continues to rise, it will become increasingly important for organizations to embrace an integrated threat defense architecture (see “The Six Tenets of Integrated Threat Defense,” page 62). Point solutions are not effective at identifying potential threats in encrypted traffic. Integrated security platforms provide security teams with more visibility into what’s happening on devices or networks, so they can more easily identify suspicious patterns of activity. ⁶ Entropy: In computing, entropy (lack of order or predictability) is the randomness collected by an operating system or application for use in cryptography or other uses that require random data. Figure 27. Top Hosts Encrypting HTTPS Traffic 0-25% 26-50% 51-75% 76-100%% Encrypted Figure X. Top 100 Hosts Source: Cisco Security Research www.google-analytics.com crl.microsoft.com pagead2.googlesyndication.com ad4.liverail.com b.scorecardresearch.com ads.adaptv.advertising.com ping.chartbeat.net v4.moatads.com au.download.windowsupdate.com ib.adnxs.com c2s-openrtb.liverail.com http.00.s.sophosxl.net platform.twitter.com pixel.adsafeprotected.com ads.yahoo.com Sample Hosts 76-100% Sample Hosts 51-75% Sample Hosts 26-50% Sample Hosts 0-25% maps.googleapis.com www.google.com googleads.g.doubleclick.net ad.doubleclick.net 0.2mdn.net outlook.office365.com hangouts.google.com www.facebook.com mail.google.com 44 Hosts 0–25% Encrypted 51–75% Encrypted 12 Hosts 26–50% Encrypted 12 Hosts 76–100% Encrypted 32 Hosts
  • 33.
    3333 Industry InsightsCisco 2016Annual Security Report As discussed in the introduction to this report, online criminals are continually on the lookout for methods to add efficiency and cost savings to their operations—along with new ways to evade detection. Increasingly, cybercriminals are finding this efficiency within websites created using WordPress, the popular website and blog development platform. In WordPress sites, attackers can take control of a steady stream of compromised servers to create an infrastructure that supports ransomware, bank fraud, or phishing attacks. The Internet is filled with abandoned sites created with WordPress that are not maintained from a security perspective; as new security issues surface, these sites are often compromised and incorporated into attack campaigns. Analyzing the systems used to support ransomware and other malware, Cisco security researchers found that many online criminals are shifting online activity to compromised WordPress servers. The number of WordPress domains used by criminals grew 221 percent between February and October 2015 (see Figure 28). This shift in venue, Cisco researchers believe, has happened for a couple of reasons. When ransomware uses other tools to communicate encryption keys or other command-and-control information, those communications can be detected or blocked, which prevents the encryption process from completing. However, communications that relay encryption keys through compromised WordPress servers may appear normal, thus increasing the chances that file encryption will be completed. In other words, the WordPress sites act as relay agents. Figure 28. Number of WordPress Domains Used by Malware Creators Figure X. WordPress Domains Used by Malware Creators Source: Cisco Security Research Feb. 73 Apr. 82 Jun. 114 Aug. 171 Sep. 212 Mar. 83 May 123 Jul. 181 Jan. 128 235 Oct. Lancope, a Cisco company, examined encryption rates for both internal and Internet traffic across three business sectors (two universities, a hospital, and an ISP provider, all based in the United States). At one of the universities, Lancope found that almost all internal traffic was encrypted (82 percent). In addition, 53 percent of the university’s Internet traffic was encrypted. These findings are on par with trends that Lancope has observed in other industries. Only 36 percent of the hospital’s internal data was encrypted. However, more than half (52 percent) of the Internet traffic was encrypted. At the leading ISP provider, 70 percent of the internal traffic was encrypted, and 50 percent of Internet traffic was encrypted. The study by Lancope tells a story of broad-based adoption of encryption for data in motion across various sectors. Cisco suggests a similar focus should now be applied to the encryption of data at rest to limit the impacts of organizational compromises. The Move Toward Encryption: Case Data Online Criminals Increase Server Activity on WordPress Figure X. The Move Toward Encryption Case Data Internet DataInternal Data Source: Lancope Threat Research Labs Hospital 36% 52% University 2 82% 53% University 1 14% 37% 70% 50% ISP
  • 34.
    3434 Industry InsightsCisco 2016Annual Security Report To sidestep the drawbacks of other technologies, criminals have turned to WordPress, which they use to host malware payloads and command-and-control servers. WordPress sites offer several advantages. For example, the many abandoned sites give criminals more opportunities for compromising sites with weak security protections. The risk of using compromised systems to run a malware operation is that one of the hacked servers may be taken down when the compromise is discovered. If this happens in the middle of a campaign, the malware downloader may fail to retrieve its payload or the malware may be unable to communicate with its command-and-control servers. Cisco security researchers noticed that malware overcame this by using more than one WordPress server; Cisco even discovered lists of compromised WordPress servers stored on data-sharing sites such as Pastebin. The malware used these lists to find working command- and-control servers, allowing the malware to operate even if a compromised server failed. Researchers also identified malware downloaders that contained a list of WordPress sites storing payloads. If one download site was not working, the malware went to the next one and downloaded malicious payloads from the working WordPress server. The compromised WordPress sites were often not running the latest version of WordPress, had weak admin passwords, and used plugins that were missing security patches. These vulnerabilities allowed attackers to co-opt WordPress servers and use them as malware infrastructure (see Figure 29). Cisco researchers have identified some of the software and file types commonly hosted on compromised WordPress sites: •• Executable files that are payloads for exploit kit attacks •• Configuration files for malware such as Dridex and Dyre •• Proxy code that relays command-and-control commu- nication to hide command-and-control infrastructure •• Phishing webpages for collecting usernames and passwords •• HTML scripts that redirect traffic to exploit kit servers In addition, Cisco researchers have identified many malware families that are using compromised WordPress sites for infrastructure: •• Dridex infostealer •• Pony password stealer •• TeslaCrypt ransomware •• Cryptowall 3.0 ransomware •• TorrentLocker ransomware •• Andromeda spam botnet •• Bartallex Trojan dropper •• Necurs infostealer •• Fake login pages Figure 29. How WordPress Sites Are CompromisedFigure X. How Cryptowall Ransomware uses hacked WordPress servers for Command and Control Cryptowall C&C Server User Views Webpage with Banner Ads Cryptowall Binary Downloaded from WordPress Server Cryptowall Retrieves Ransom Note and Provides Link to Payment Site Cryptowall Connects to C&C Server to Get Encryption Key Cryptowall Encrypts Documents ! ! ! Source: Cisco Security Research 3 4 5 6 1 Flash Exploit2 SHARE
  • 35.
    3535 Industry InsightsCisco 2016Annual Security Report Security professionals concerned about the threats posed by WordPress hosting by criminals should seek web security technology that examines content coming from WordPress- created sites. Such traffic could be considered unusual if the network is downloading programs from WordPress sites instead of just webpages and images (although WordPress sites can host legitimate programs as well). Aging Infrastructure: A Problem 10 Years in the Making All companies today are IT companies to some degree, because they are dependent on their IT and OT (operational technology) infrastructure to be connected, digitized, and successful. That means they need to make IT security a priority. Yet many organizations rely on network infrastructures built of components that are old, outdated, and running vulnerable operating systems—and are not cyber-resilient. We recently analyzed 115,000 Cisco devices on the Internet and across customer environments as a way to bring attention to the security risks that aging infrastructure— and lack of attention to patching vulnerabilities—present. We identified the 115,000 devices in our one-day sample by scanning the Internet and then looking at the devices from the “outside in” (from the Internet view and into the enterprise). Through our scanning and analysis, we found that 106,000 of the 115,000 devices had known vulnerabilities in the software they were running. That means 92 percent of the Cisco devices on the Internet in our sample are susceptible to known vulnerabilities. Cisco also discovered that the version of the software that those devices were running had 26 vulnerabilities, on average. In addition, we learned that many organizations were running outdated software in their network infrastructure (Figure 30). We found some customers in the financial, healthcare, and retail verticals using versions of our software that are more than 6 years old. We also discovered that many of the infrastructure devices we analyzed had reached their last day of support (LDoS)— meaning they cannot be updated and made more secure (Figure 31). These devices are not even receiving patches for known vulnerabilities, so they are not being provided information about new threats. Customers have been made aware of this issue. 0 1 2 3 4 5 6 Years Figure X. Average Software Age in Years AirportC om m s.Drug M fg.EnterpriseFinancialHealthcareInsurance Service Provider Retail Telecom . Source: Cisco Security Research Figure 30. Average Software Age in Years 2 Insurance 1 Enterprise 0.6 Retail 10 Service Provider 16.3 Healthcare 15.7 Telecom. 15 Financial 19.9 Figure X. Percentage of LDoS for Infrastructure Devices Source: Cisco Security Research Drug Mfg. 4.8 Airport 5 Comms. Figure 31. Percentage of LDoS for Infrastructure Devices For more on this topic, read the Cisco Security blog posts: “IT Security: When Maturity Is Overrated” “Evolution of Attacks on Cisco IOS Devices” “SYNful Knock: Detecting and Mitigating Cisco IOS Software Attacks”
  • 36.
    3636 Industry InsightsCisco 2016Annual Security Report Reliance on aging infrastructure opens the door to attackers. However, the rise in cumulative alerts— which include product vulnerabilities in open-source and proprietary solutions—is a positive sign that the technology industry is paying close attention to eliminating opportunities for attackers. Cumulative alert totals have increased 21 percent from 2014 to 2015. From July through September 2015, the increase was notably high. This increase can be attributed in large part to major software updates from vendors such as Microsoft and Apple, because product updates lead to more reporting of software vulnerabilities. Major software vendors now release patches and upgrades in greater volume, and they are more transparent about this activity. The increasing volume is a main driver for organizations automating their vulnerability management through the use of security intelligence and management platforms that help manage the volume of system and software inventory, vulnerability, and threat information. Using these systems and application programming interfaces (APIs) allows for more efficient, timely, and effective security management across large and small organizations. Cumulative Alert Totals Show Growing Commitment to Managing Vulnerabilities Figure 32. Cumulative Annual Alert Totals In addition, 8 percent of the 115,000 devices in our sample that we analyzed have reached their end-of-life stage, and another 31 percent will reach end of support within one to four years. Aging, outdated IT infrastructure is a vulnerability for organizations. As we move closer to the Internet of Things (IoT)—and the Internet of Everything (IoE)—it becomes more important for businesses to make sure they are relying on a network infrastructure that is secure, thus ensuring the integrity of the data and communications traversing the network. This is critical to the success of the emerging IoE. Many Cisco customers built their network infrastructure a decade ago. Back then, many businesses simply did not account for the fact that they would be 100 percent reliant on that infrastructure. Nor did they anticipate that their infrastructure would become a prime target for adversaries. Organizations tend to avoid making infrastructure updates because it’s expensive and requires network downtime. In some cases, a simple update won’t be enough. Some products are so old they cannot be upgraded to incorporate the latest security solutions needed to protect the business. These facts alone speak to the criticality of maintaining infrastructure. Organizations need to plan for regular upgrades and recognize the value of taking control of their critical infrastructure proactively—before an adversary does. SHARE Jan. Dec. Source: Cisco Security Research 2K 6K 0 4K 8K Total Alerts Figure X. Cumulative Annual Alert Totals 21% from 2014 to 2015 2014 2013
  • 37.
    3737 Industry InsightsCisco 2016Annual Security Report Figure 33. Number of Vulnerabilities in Common Categories In examining common vulnerability categories, cross-site scripting (XSS) vulnerabilities dropped 47 percent from 2014 to 2015 (Figure 33). The decrease may be a result of the greater attention paid to vulnerability testing. Vendors have become more skilled at identifying these particular vulnerabilities and fixing them before their products go to market. Information leak or information disclosure vulnerabilities dropped 15 percent in 2015. These vulnerabilities involve unintentional disclosures to parties that don’t have explicit access. Vendors have become attentive to controls that allow or disallow access to data, making this common vulnerability a less-frequent occurrence. Threat Categories: Decline in Buffer Errors, Information Leaks, and Disclosures SMBs play a critical role in national economies. When entrusted with data by their customers, SMBs also carry the responsibility of protecting this information from online attackers. However, as detailed in the Cisco 2015 Security Capabilities Benchmark Study (see page 41), SMBs show signs that their defenses against attackers are weaker than their challenges demand. In turn, these weaknesses can place SMBs’ enterprise customers at risk. Attackers that can breach an SMB network could also find a path into an enterprise network. Judging from the results of the Cisco 2014 Security Capa- bilities Benchmark Study, SMBs are using fewer processes to analyze compromises and fewer threat defense tools than they used last year. For example, 48 percent of SMBs said in 2015 that they used web security; 59 percent said they did in 2014. Only 29 percent said they used patching and con- figuration tools in 2015, compared with 39 percent in 2014. In addition, of the SMB respondents that do not have an executive responsible for security, nearly one-quarter do not believe their businesses are high-value targets for online criminals. This belief hints at overconfidence in their business’s ability to thwart today’s sophisticated online attacks—or, more likely, that attacks will never happen to their business. Are Small and Midsize Businesses a Weak Link to Enterprise Security? SHARE Source: Cisco Security Research Figure X. Common Vulnerabliity Categories 2014 2015 CWE-119: Buffer Errors 861 681 CWE-22: Path Traversal 42 22 CWE-94: Code Injection 76 37 CWE-264: Permissions, Privileges, and Access Control 270 220 CWE-89: SQL Injection 35 20 CWE-287: Authentication Issues 50 27 CWE-200: Information Leak/Disclosure 269 191 CWE-352: Cross-Site Request Forgery (CSRF) 36 45 CWE-59: Link Following 12 4 (Increase) CWE-79: Cross-Site Scripting (XSS) 201 120 CWE-16: Configuration 4 10 CWE-78: OS Command Injections 42 26 (Increase)
  • 38.
    3838 Industry InsightsCisco 2016Annual Security Report SMBS LESS LIKELY TO USE INCIDENT RESPONSE TEAMS In many cases, SMBs are less likely than large enterprises to have incident response and threat intelligence teams. This may be due to budget constraints: Respondents pointed to budget issues as one of the biggest obstacles to adopting advanced security processes and technology. Seventy-two percent of large enterprises (those with more than 1000 employees) have both teams, compared with 67 percent of businesses with fewer than 500 employees. SMBs also use fewer processes to analyze compromises, eliminate the causes of an incident, and restore systems to pre-incident levels (Figure 35). For example, 53 percent of enterprises with more than 10,000 employees use network flow analysis to analyze compromised systems, compared with 43 percent of businesses with fewer than 500 employees. Sixty percent of businesses with more than 10,000 employees patch and update applications deemed vulnerable, compared with 51 percent of businesses with fewer than 500 employees. SMBs’ use of certain threat defenses appears to be on the decline. For example, in 2014, 52 percent of SMBs used mobility security, but only 42 percent did so in 2015. Also, in 2014, 48 percent of SMBs used vulnerability scanning, compared to 40 percent in 2015 (see Figure 36). Figure 35. SMBs Use Fewer Security Processes than Large Enterprises Source: Cisco 2015 Security Capabilities Benchmark Study Figure X. SMBs Use Fewer Security Processes than Large Enterprises Which of These Processes—If Any—Does Your Organization Use to Analyze Compromised Systems? Memory Forensics Network Flow Analysis Systems Log Analysis External (Third-Party) Incident Response/Analysis Teams Correlated Event/Log Analysis Registry Analysis IOC Detection Implement Additional or New Detections and Controls Company Size What Processes Does Your Organization Use to Restore Affected Systems to Pre-Incident Operational Levels? Patch and Update Applications Deemed Vulnerable 36% 43% 47% 40% 34% 43% 31% 49% 250-499 51% 36% 47% 51% 32% 34% 47% 34% 55% 500-999 53% 35% 52% 55% 34% 40% 52% 37% 57% 1000-9999 57% 34% 53% 59% 39% 42% 53% 36% 61% 10,000+ 60% Source: Cisco 2015 Security Capabilities Benchmark Study Figure X. SMB Biggest Obstacles Which of the Following do You Consider the Biggest Obstacles to Adopting Advanced Security Processes and Technology? Company Size 250-499 500-999 1000-9999 Budget Constraints 40% 39% 39% 41% Compatibility Issues with Legacy Systems 34% 30% 32% 34% Competing Priorities 25% 25% 24% 24% 10,000+ Figure 34. SMB Biggest Obstacles Figure 36. SMB Defenses Decrease in 2015 Source: Cisco 2015 Security Capabilities Benchmark Study Figure X. SMB Defenses Decrease in 2015 Which—If Any—of These Types of Security Threat Defenses Does Your Organization Currently Use? 2014 2015 Mobile Security 52% 42% 51%Secured Wireless 41% Vulnerability Scanning 48% 40% VPN 46% 36% Security Information and Event Management (SIEM) 42% 35% Network Forensics 41% 29% Patching and Configuration 39% 29% Endpoint Forensics 31% 23% Penetration Testing 38% 32%
  • 39.
    3939 Industry InsightsCisco 2016Annual Security Report Why is it significant that SMBs tend to use fewer defenses than their larger counterparts? In a security environment where attackers are developing more sophisticated tactics for entering networks and remaining undetected, no business can afford to leave its networks unprotected, or to put off using processes that might offer insights on how a compromise occurred so it can be avoided in the future. In addition, SMBs may not realize that their own vulnerability translates to risks for larger enterprise customers and their networks. Today’s criminals often gain entry into one network as a means to find an entry point into another, more lucrative network—and the SMB may be the starting point for such an attack. LESS LIKELY TO HAVE EXPERIENCED PUBLIC DATA BREACHES SMBs are less likely than large enterprises to have dealt with a public security breach, probably a result of their smaller footprint from a network standpoint. While 52 percent of enterprises with more than 10,000 employees have managed the aftermath of a public security breach, only 39 percent of businesses with fewer than 500 employees have done so. Public security breaches are obviously disruptive and damaging to a business, but they do offer one benefit: They often encourage businesses to take a closer look at their security protections and consider strengthening them. Cisco survey data (see page 74) shows that when large enterprises suffer a public data breach, they significantly upgrade their security technology and implement stronger processes. SMBs’ view of their businesses as targets of cybercriminals may demonstrate a gap in their perception of the threat landscape. As illustrated above in Figure 38, 22 percent of businesses with fewer than 500 employees said they do not have an executive with direct responsibility and accountability for security because they do not view themselves as high-value targets. Organiza (Explana with Dire Source: Cisco 2015 Security Capabilities Benchmark Study Figure X.SMBs Do Not Perceive Themselves as High-Value T Is There an Executive at Your Organization Who Has Direct Responsibility and Accountability for Security? 250-499 Company Size 89% 500-999 93% 1000-9999 92% 10,000+ 92% 78% NoYes Yes 250-4 11% 7% 8% 8% Figure 38. SMBs Do Not Perceive Themselves as High-Value Targets Enterprise 10,000+ Had to Manage a Public Security Breach 39% 52% SMB 250-499 Figure X. SMBs Report Fewer Public Breaches; Less Likely than Enterprises to Initiate Changes in Response Source: Cisco 2015 Security Capabilities Benchmark Study Figure 37. SMBs Report Fewer Public Breaches Organiza (Explana with Dire Source: Cisco 2015 Security Capabilities Benchmark Study Figure X.SMBs Do Not Perceive Themselves as High-Value T Is There an Executive at Your Organization Who Has Direct Responsibility and Accountability for Security? 250-499 Company Size 89% 500-999 93% 1000-9999 92% 10,000+ 92% 78% NoYes Yes 250-4 11% 7% 8% 8% Organization is Not a High-Value Target for Attackers. (Explanation for Why an Organization Does Not Have an Executive with Direct Responsibility and Accountability for Security). Source: Cisco 2015 Security Capabilities Benchmark Study Figure X.SMBs Do Not Perceive Themselves as High-Value Targets Is There an Executive at Your Organization Who Has Direct Responsibility and Accountability for Security? 250-499 Company Size Company Size 89% 500-999 93% 1000-9999 92% 10,000+ 92% 22% 17%13%26% 74%78% 87% 83% NoYes NoYes 250-499 500-999 1000-9999 10,000+ 11% 7% 8% 8% SHARE
  • 40.
    4040 Industry InsightsCisco 2016Annual Security Report Although the survey shows that more SMBs overall are outsourcing some of their security functions, SMBs are generally less likely than large enterprises to outsource certain services, such as advice and consulting. For example, 55 percent of large enterprises outsource advice and consulting services, compared with 46 percent of businesses with fewer than 500 employees. Fifty-six percent of large enterprises outsource security auditing tasks, compared with 42 percent of businesses with fewer than 500 employees (see Figure 39). However, in 2015, more SMBs are outsourcing at least some security services. In 2014, 24 percent of SMBs with less than 499 employees said they did not outsource any services. In 2015, only 18 percent of SMBs said the same. The fact that more SMBs are adopting outsourcing as a way to manage security is good news. It says that SMBs are seeking flexible tools for securing networks that do not place a burden on their smaller staffs or more conservative budgets. However, SMBs may mistakenly believe that outsourcing security processes will greatly reduce the likelihood of a network breach. Or they may place the onus for security on a third party. Such a viewpoint would be wishful thinking, since only a truly integrated threat defense system—one that examines and mitigates attacks as well as prevents them—can provide enterprise-level security protection. SMBs MORE LIKELY TO OUTSOURCE SECURITY FUNCTIONS IN 2015 Source: Cisco 2015 Security Capabilities Benchmark Study Figure X. More SMBs Outsource in 2015 Company Size Advice and Consulting Monitoring Threat Intelligence Incident Response Auditing Remediation 250-499 46% 45% 42% 39% 35% 33% 51% 46% 46% 44% 37% 38% 54% 42% 46% 44% 42% 36% 55% 44% 56% 40% 41% 36% None 18% 12% 11% 10% Why Does Your Organization (SMB 250-499) Choose to Outsource This/These Service(s)? Lack of Internal Experience 30% More Cost-Efficient 55% Lack of Internal Resources (Software, Manpower) 31% Desire for Unbiased Insight 45% More Timely Response to Incidents 45% 1000-9999500-999 10,000+ When it Comes to Security, Which of the Following Types of Services, if Any, Are Outsourced Fully or in Part to Third Parties? Figure 39. More SMBs Outsource Security Services in 2015 SHARE
  • 41.
    4141 Industry InsightsCisco 2016Annual Security Report Cisco Security Capabilities Benchmark Study
  • 42.
    42 Security Capabilities BenchmarkStudyCisco 2016 Annual Security Report In the face of more sophisticated threats, the Cisco study suggests that the confidence of security professionals appears to be flagging. On the other hand, deepening concerns about security are changing how these professionals protect networks. For example, we are seeing more security training, an increase in formal written policies, and more outsourcing of tasks such as security audits, consulting, and incident response. In short, security professionals show signs that they are taking action to combat the threats that loom over their networks. The moves toward training and outsourcing are positive developments, but the security industry can’t stop there. It must continue to increase its use of tools and processes to improve the detection, containment, and remediation of threats. Given the barriers of budget limitations and solution compatibility, the industry must also explore effective solutions that provide an integrated threat defense. The industry must also do a better job of collaborating with other organizations when public breaches occur (such as with the SSHPsychos botnet; see page 14), since knowledge-sharing can help prevent future attacks. To gauge the perceptions of security professionals on the state of security in their organizations, Cisco asked chief security officers (CSOs) and security operations (SecOps) managers in several countries and at organizations of various sizes about their perceptions of their security resources and procedures. The Cisco 2015 Security Capabilities Benchmark Study offers insights on the maturity level of security operations and security practices currently in use, and also compares these results with those of the inaugural 2014 study. Cisco Security Capabilities Benchmark Study Decline in Confidence Amid Signs of Preparedness
  • 43.
    43 Security Capabilities BenchmarkStudyCisco 2016 Annual Security Report As security professionals become aware of threats, they may be seeking ways to improve their defenses— for example, by outsourcing security tasks that can be managed more efficiently by consultants or vendors. In 2015, 47 percent of our surveyed companies outsourced security audits, an increase from 41 percent in 2014. Also in 2015, 42 percent outsourced incident response processes, compared with 35 percent in 2014 (Figure 40). In addition, more security professionals are outsourcing at least some security functions. In 2014, 21 percent of the survey respondents said they did not outsource any security services. In 2015, that number dropped significantly, to 12 percent. Fifty-three percent said they outsource services because doing so was more cost- efficient, while 49 percent said they outsource services to obtain unbiased insights. To add protection to their networks and data, security professionals indicated that they are receptive to the concept of hosting networks off-premises. While on- premises hosting is still the favored option, the number of professionals using off-premises solutions has increased. In 2015, 20 percent used off-premises private cloud solutions compared with 18 percent in 2014 (Figure 41). Figure 41. Off-Premises Hosting on the Rise Figure 40. Outsourced Services Overview RESOURCES: ORGANIZATIONS MORE LIKELY TO OUTSOURCE Advice and Consult. Audit Monitoring Incident Response Threat Intel. Remediation None/Internal 51% 41% 42% 35% 34% 21% N/A 52% 47% 44% 42% 36% 12% 39% More Cost–Efficient Desire for Unbiased Insight More Timely Response to Incidents Lack of Internal Expertise Lack of Internal Resources 53% 49% 46% 31% 31% Why Are These Services Outsourced? † 2015 (n=1129) Which Security Services Are Outsourced? 2014 (n=1738) 2015 (n=2432) Figure X. Outsourced Services Seen as Cost Effective Source: Cisco 2015 Security Capabilities Benchmark Study † Security respondents that outsource security services (2015; n=2129) On-Premises Hosting of the Organization’s Networks is Still the Most Common; However, Off-Premises Hosting Has Increased Since Last Year Figure X. Off-Premise Hosting on the Rise 2014 (n=1727) 2015 (n=2417) On-Premises as Part of a Private Cloud 50% 51% Off-Premises Public Cloud 8% 10% Off-Premises Private Cloud 18% 20% On-Premises but Managed by an External Third Party 23% 24% On-Premises 54% 48% Source: Cisco 2015 Security Capabilities Benchmark Study
  • 44.
    44 Security Capabilities BenchmarkStudyCisco 2016 Annual Security Report The security teams surveyed by Cisco are more intent on protecting their networks more effectively, but they may be limited in their ability to carry out their plans. Security professionals said that budget constraints (39 percent) top the list of likely reasons to choose or reject security services and tools, followed by technology compatibility issues (32 percent; see Figure 42). Budget constraints become more of a problem for enterprises that rank in the low and lower-mid maturity levels (see Figure 43). In the responses from all security professionals, 39 percent cite budget constraints as an obstacle to adopting advanced security processes. That figure is 43 percent of enterprises in the low-maturity range, and 48 percent in the lower-mid maturity range. One sign that some organizations are giving more thought to their security resources is how they structure their security budget. The survey shows a slight increase in the number of organizations that separate the security budget from overall IT budget. In 2014, 6 percent of professionals said they had completely separated security and IT budgets; in 2015, that number rose to 9 percent (see Figure 44). Figure X. Budget Constraints Are the Major Barrier to Security Upgrades 2015 (n=2432)Biggest Barriers to Adopting Advanced Security Processes and Technology Upper Management Buy-In 20% Reluctance to Purchase Until Proven 22% Lack of Trained Personnel 22% Organizational Culture/Attitude 23% Lack of Knowledge 23% Current Workload Too Heavy 24% Competing Priorities 24% Certification Requirements 25% Compatibility Issues 32% Budget Constraints 39%$ Source: Cisco 2015 Security Capabilities Benchmark Study Figure 42. Budget Constraints Are the Major Barrier to Security Upgrades FIgure X. Budget Constraints as Biggest Obstacles to Adopting Advanced Security Processes and Technology HighUpper-MidMiddleLower-Mid 38%38%39% 48% 43% Low Percentage of Respondents Seeing Budget Constraints as the Biggest Obstacles (n=2432) Source: Cisco 2015 Security Capabilities Benchmark Study Figure 43. Budget Constraints Are Greater Obstacle for Low-Maturity Companies Completely Separate All Within ITPartially Within IT 6% 9% 33% 33% 61% 58% $ $ A Minority of Organizations Still Have Security Budgets that Are Completely Separate From it, but Incidence Has Increased. Is the Security Budget Part of the IT Budget? Figure X. Slight Increases in Organizations with Separate Security Budgets 2014 (n=1720) 2015 (n=2417) Source: Cisco 2015 Security Capabilities Benchmark Study Figure 44. Slight Increase in Organizations with Separate Security Budgets SHARE
  • 45.
    45 Security Capabilities BenchmarkStudyCisco 2016 Annual Security Report When organizations standardize on security policies or seek certification, they show a commitment to improving security. Nearly two-thirds of security professionals said their organizations are certified on standardized security policies or practices, or are in the process of becoming certified (Figure 45). This is another positive sign that enterprises see value in improving their security knowledge and responding to threats. Figure X. Majority of Organizations Are Certified or Seeking Certification Preparing for the Certification Process Currently in the Process of Becoming Certified Organization Follows Standardized Information Security Policy Practice (2015 n=1265) 63% Chemical Eng. or Mfg. 58% Non-Computer Mfg. 57% Transportation 46% Agriculture/Forestry/Fishing 44% Pharmaceuticals 36% Mining 70% Financial Services 70% Telecommunications 67% Healthcare 65% Government 64% Utilities/Energy 63% Other Industry Already Certified 63%31% 7% Source: Cisco 2015 Security Capabilities Benchmark Study Figure 45. Most Organizations Are Certified or Seeking Certification Figure 46. Firewalls and Data Loss Prevention Are Most Commonly Used Security Tools In examining the use of security defenses, we found that firewalls are the most commonly used security tools by enterprises (65 percent), followed by data loss prevention (56 percent) and authentication tools (53 percent; see Figure 46). In 2015, enterprises were somewhat less likely to rely on cloud-based tools. Although security professionals have shown a willingness to outsource security services (see page 43), they may be trending toward an in-house deployment of tools. (See page 71 for full list.) Security Threat Defenses Used by Organization Defenses Administered Through Cloud- Based Services (Security Respondents Who Use Security Threat Defenses) 2014 (n=1738) 2014 (n=1646) 2015 (n=2268)2015 (n=2432) Network, Security, Firewalls, and Intrusion Prevention* 60% N/A 35% Email/Messaging Security 56% 52% 37% 34% Encryption/Privacy/Data Protection 53% 53% Data Loss Prevention 55% 56% Authentication 52% 53% Firewall* N/A 65% 31% Web Security 59% 51% 37% 31% *Firewall and intrusion prevention were one code in 2014: “Network security, firewalls, and intrusion prevention.” Figure X. Firewalls and Data Loss Prevention Are Most Commonly Used Security Tools Source: Cisco 2015 Security Capabilities Benchmark Study
  • 46.
    46 Security Capabilities BenchmarkStudyCisco 2016 Annual Security Report CAPABILITIES: CONFIDENCE IS DOWN In 2015, security professionals were less confident that their security infrastructure is up to date than they were in 2014. This decline in confidence is due, no doubt, to the steady drumbeat of high-profile attacks on major enterprises, the corresponding theft of private data, and the public apologies from companies whose networks have been breached. However, this decline in confidence is accompanied by a growing interest in developing stronger policies. As seen in Figure 47, more companies (66 percent) have a written, formal security strategy in 2015 than was the case in 2014 (59 percent). Figure 48. Confidence Is Lower in 2015 As a sign that confidence is on the decline, security profes- sionals show slightly less confidence in their technologies. In 2014, 64 percent said their security infrastructure was up to date and constantly upgraded. In 2015, that number dropped to 59 percent (Figure 48). Also, in 2014, 33 percent said their organizations were not equipped with the latest security tools; that number rose to 37 percent in 2015. Confidence is somewhat higher among CSOs, who are more optimistic than security operations managers: 65 percent of CSOs believe their security infrastructure is up to date, compared with 54 percent of SecOps managers. The confidence of SecOps managers is likely to suffer because they respond to day-to-day security incidents, giving them a less positive view of their security readiness. SHARE Figure 47. More Organizations Create Formal Security Policies Source: Cisco 2015 Security Capabilities Benchmark Study Figure X. Off-Premise Hosting on the Rise 2014 (n=1738)Security Standards 2015 (n=2432) Written, Formal, Organization- Wide Security Strategy that is Reviewed Regularly 66% Nearly Two-Thirds are Already Certified on a Standardized Security Policy or Practice. None of the Above 1% 1% Follow a Standardized Information Security Policy Practice Such as ISO 27001 59% 52% 52% 54% 38% Formally Define Critical Business Assets that Require Special Consideration for Risk Management that Are Either Business-Critical or Regulated to Have Increased Protection Figure X. Confidence is Lower in 2015 2014 (n=1738) 2015 (n=2432) In 2015, Companies are Less Confident that Their Security Infrastructure is Up-to-Date; Budget is the Top Barrier to Upgrades. Our Security Infrastructure is Very Up to Date, and is Constantly Upgraded With the Best Technologies Available We Replace or Upgrade Our Security Technologies on a Regular Cadence, but Aren’t Equipped with the Latest-and-Greatest Tools We Replace or Upgrade Our Security Technologies Only When Old Ones No Longer Work or Are Obsolete, or When We Identify Completely New Needs 64% 59% 33% 37% 3% 5% How Would You Describe Your Security Infrastructure? Source: Cisco 2015 Security Capabilities Benchmark Study
  • 47.
    47 Security Capabilities BenchmarkStudyCisco 2016 Annual Security Report Security professionals also show mixed levels of confidence in terms of their ability to thwart attackers. Fifty-one percent strongly believe they can detect security weaknesses before they become full-blown incidents; only 45 percent are confident in their ability to determine the scope of a network compromise, and to remediate the damage (see Figure 49). Security professionals also show weaker confidence levels in their capability to defend their networks against attacks. For example, in 2015, fewer professionals strongly believe that they do a good job of building security into procedures for acquiring, developing, and maintaining systems (54 percent in 2015, compared with 58 percent in 2014; see Figure 50). (See page 76 for full list.) Figure 49. Mixed Confidence in Ability to Detect Compromises SHARE Figure X. Mixed Confidence in Ability to Detect Compromises Our Security Infrastructure is Very Up to Date, and is Constantly Upgraded with the Best Technologies Available. Source: Cisco 2015 Security Capabilities Benchmark Study Percentage of Organizations Confident in Determining the Scope of a Compromise and Remediating It 451 8 46 (2015 n=2432) Percentage of Organizations Able to Detect Security Weaknesses Before They Become Full-Blown Incidents 511 4 45 Strongly Disagree Strongly AgreeDisagree Agree How Would You Describe Your Security Infrastructure? 59% Figure 50. Lower Confidence in Ability to Build Security into Systems Figure X. Lower Confidence in Ability to Build Security into Systems Source: Cisco 2015 Security Capabilities Benchmark Study We Do a Good Job of Building Security Into Systems and Applications (%) 93 582 5 35 96 541 4 42 2015 n=2432 2014 n=1738 Strongly Disagree Strongly AgreeDisagree AgreeSecurity Policies
  • 48.
    48 Security Capabilities BenchmarkStudyCisco 2016 Annual Security Report In some areas, confidence levels in security capabilities are not very high. For example, in 2015, only 54 percent of respondents said they believe they have a good system for verifying that security incidents have actually occurred (see Figure 51). (See page 77 for full list.) Respondents are also not entirely confident that their systems can scope and contain such compromises. Fifty-six percent said they review and improve security practices regularly, formally, and strategically; 52 percent believe their security technologies are well integrated and work effectively together (see Figure 52). (See page 79 for full list.) Figure 51. Enterprises Believe They Have Good Security Controls Security Controls We Have Good Systems for Verifying that Security Incidents Actually Occurred Source: Cisco 2015 Security Capabilities Benchmark Study Security Controls 92 541 6 38 95 541 5 41 2015 n=2432 2014 n=1738 Strongly Disagree Strongly AgreeDisagree Agree We Review and Improve Our Security Practices Regularly, Formally, and Strategically Over Time Strongly Disagree Strongly AgreeDisagree Agree 94 561 4 38 96 561 4 40 2015 n=2432 2014 n=1738 Our Security Technologies are Well Integrated to Work Effectively Together 94 562 5 38 95 521 4 43 2015 n=2432 2014 n=1738 It is Easy to Determine the Scope of a Compromise, Contain it, and Remediate From Exploits 89 362 9 43 91 451 8 46 2015 n=2432 2014 n=1738 Security Operationalization Figure X. Enterprises Lack Confidence in Ability to Contain Compromises Source: Cisco 2015 Security Capabilities Benchmark Study Figure 52. Enterprises Express Mixed Confidence in Ability to Contain Compromise SHARE
  • 49.
    49 Security Capabilities BenchmarkStudyCisco 2016 Annual Security Report Similar to the respondents in 2014, more than one-fourth of the security professionals in 2015 said they perceive their security tools to be only somewhat effective (Figure 53). Figure X. One-Fourth of Enterprises Believe Security Tools Are Only Somewhat Effective Not at All ExtremelyNot Very Somewhat Effective VeryEffectiveness of Security Tools Similar to Last Year, Over a Quarter Perceive Their Security Tools to be Only “Somewhat” Rather Than “Very” or “Extremely” Effective Blocking Against Known Security Threats 73 230 3 24 50 75 240 2 5123 2015 n=2432 2014 n=1738 Detecting Network Anomalies and Dynamically Defending Against Shifts in Adaptive Threats 70 210 4 27 49 70 210 2 4928 2015 n=2432 2014 n=1738 Enabling Us to Enforce Security Policies 71 201 3 27 51 70 200 2 5028 2015 n=2432 2014 n=1738 Enabling Us to Assess Potential Security Risks 70 221 4 26 48 69 190 2 5029 2015 n=2432 2014 n=1738 Determining the Scope of a Compromise, Containing It, and Remediating Further Exploits 67 190 3 30 48 68 190 2 4930 2015 n=2432 2014 n=1738 Source: Cisco 2015 Security Capabilities Benchmark Study Figure 53. One-Fourth of Enterprises Believe Security Tools Are Only Somewhat Effective
  • 50.
    50 Security Capabilities BenchmarkStudyCisco 2016 Annual Security Report Public security breaches tend to be a defining moment for organizations. Once they occur, organizations seem to become more aware of the need to prevent future breaches. However, in 2015, fewer security professionals said their organizations had to deal with public security breaches: they made up 53 percent of the professionals in 2014, and 48 percent in 2015 (Figure 54). Professionals acknowledge the value that breaches have in terms of delivering a wake-up call about the importance of strengthening security processes: 47 percent of the security professionals affected by public breaches said the breaches resulted in better policies and procedures. For example, 43 percent of the respondents said they increased security training after a public breach, and 42 percent said they increased investments in security defense technologies. The good news is that organizations that have suffered a public breach are increasingly likely to strengthen their security processes. In 2015, 97 percent of security professionals said they conduct security training at least once a year, a solid increase from 82 percent in 2014 (see Figure 90 on page 82). Figure 54. Public Breaches Can Improve Security Has Your Organization Ever Had to Manage Public Scrutiny of a Security Breach? Figure X. Public Breaches Can Improve Security (n=1701) (n=1347) 48%Yes 53%Yes VS 20152014 How Much Did the Breach Drive Improvements in Your Security Threat Defense Policies, Procedures, or Technologies? (n=1134) Not at All A LotSomewhatNot Very 10%1% 42% 47% Source: Cisco 2015 Security Capabilities Benchmark Study SHARE Figure 55. More Organizations Conduct Security Training Figure X. More Organizations Conduct Security Training 43% Source: Cisco 2015 Security Capabilities Benchmark Study In 2015, 43 percent of respondents said they increased security training after a public breach.
  • 51.
    51 Security Capabilities BenchmarkStudyCisco 2016 Annual Security Report MATURITY: BUDGET CONSTRAINTS RANK HIGH AT EVERY LEVEL As organizations deploy more sophisticated security practices and policies, their perceptions of their security readiness may shift. The Cisco 2015 Security Capabilities Benchmark Study places survey respondents and their organizations into five maturity categories, based on responses about their security processes (Figure 56). The study examines how different characteristics such as capabilities, industries, and countries may affect maturity levels. Interestingly, organizations at different maturity levels seem to share some of the obstacles to implementing more sophisticated security processes and tools. Although the exact percentages may vary, the challenge of budget constraints ranks at the top of the list at every level of maturity (Figure 57). Figure 57. Obstacles to Adopting Better Security Not Affected by Maturity Level Figure 56. Maturity Model Ranks Organizations Based on Security Processes Figure X. Maturity Model Ranks Organizations Based on Secuirty Processes Cisco explored several options for sample segmentation before selecting a five-segment solution based on a series of questions targeting security processes. The five-segment solution maps fairly closely to the Capability Maturity Model Integration (CMMI). Low Upper– Middle Lower– Middle High Middle 5–Segment–Based Solution Optimizing Quantitatively Managed Defined Repeatable Initial Focus Is on Process Improvement Processes Quantitatively Measured and Controlled Processes Characterized for the Organization; Often Proactive Processes Characterized for Projects; Often Reactive Processes Are Ad Hoc, Unpredictable 1 2 3 4 5 Level Source: Cisco 2015 Security Capabilities Benchmark Study Source: Cisco 2015 Security Capabilities Benchmark Study Figure X. Obstacles to Adopting Better Secuirty not Affected by Maturity Level Which of the Following Do You Consider the Biggest Obstcles to Adopting Advanced Security Processes and Technology? Sophistication Level Low Upper–Middle HighLower–Middle Middle Budget Constraints Competing Priorities 39%41% 48% 38%38% Upper Management Buy-In 20%14% 20% 19%22% Lack of Trained Personnel 26%19% 27% 22%26% Competing Priorities 26%14% 17% 25%27% 22%21% 27% 23%19% Lack of Knowledge About Adv. Security Processes and Tech 25%31% 20% 22%23% Reluctant to Purchase Until They Are Proven in the Market Current Workload Too Heavy to Take on New Responsibilities 24%12% 25% 19%25% Organizational Culture Attitude About Security 22%31% 23% 22%25% 36% 23% 22%25%25% Compatibility Issues with Legacy Systems 29%21% 28% 33%34%
  • 52.
    52 Security Capabilities BenchmarkStudyCisco 2016 Annual Security Report The chart to the right maps the quality of the security infrastructure and maturity levels of various industries. It is based on survey respondents’ perceptions of their security processes. The industries that appear in the upper-right quadrant show the highest levels of maturity as well as infrastructure quality. The chart below shows placement in Cisco’s maturity levels by industry. In 2015, nearly half of transportation and pharmaceutical organizations surveyed are in the high-maturity segment. Telecommunications and utilities are less likely to be in the high-maturity segment in 2015, compared to 2014. The results are based on survey respondents’ perceptions of their security processes. Figure 58. Gauging Security Maturity by Infrastructure and Industry SHARE Figure 59. Maturity Levels by Industry Source: Cisco 2015 Security Capabilities Benchmark Study Figure X. Maturity Levels by Industry Segment Distribution by Industry Sophistication Level Low Upper–Middle HighLower–Middle Middle Chemical Engineering 1% 6% 39%21% 33% Financial Services 1% 10% 38%26% 26% Government 3% 10% 34%28% 25% Healthcare 1% 10% 37%30% 22% Non-Computer- Related Manufacturing 1% 10% 32%34% 22% Pharmaceutical 2% 3% 44%30% 21% Transportation 1% 5% 46%28% 20% Utilities/Energy 1% 15% 23%28% 32% Telecommunications 2% 11% 33%26% 28% Figure X. Gauging Security Maturity by Infrastructure and Industry Utilities/Energy Non-Computer–Related Manufacturing Telecommunications Pharmaceuticals Other Mining Transportation Healthcare Chemical Engineering Manufacturing Government Financial Services: Banking, Insurance Source: Cisco 2015 Security Capabilities Benchmark Study Middle Upper Middle High ConstantUpdate, LatestTech RegularUpgrade Cadence
  • 53.
    53 Security Capabilities BenchmarkStudyCisco 2016 Annual Security Report Source: Cisco 2015 Security Capabilities Benchmark Study Figure X. Maturity Levels by Country Segment Distribution by Country 2014 (n=1637) 2015 (n=2401) Sophistication Level Low2014 Upper–Middle HighLower–Middle Middle United States 22%2% 4% 45%27% Brazil 1% 9% 40%26% Germany 1% 12% 39%24% Italy 4% 3% 34%23% United Kingdom 0% 14% 32%22% Australia 1% 5% 29%36% China 0% 6% 32%25% India 24% 36% 32% 29% 37% 21% 34% 1% 4% 40%34% Japan 2% 16% 32%16% 27%3% 10% 44%16% 2% 5% 34%35% 1% 4% 43%25% 1% 23% 38%25% 8% 8% 41%18% 9% 7% 30%35% 0% 3% 36%29% 27% 24% 24% 13% 25% 19% 32% 20% 14% 7% 3% 16% 7% 15% 32%40% 20%Mexico 6% 8% 50%16% 27%Russia 1% 14% 32%26% 35%France 1% 15% 29%20% 54% The chart below shows placement in Cisco’s maturity levels by country. The results are based on survey respondents’ perceptions of their security processes. The chart to the right maps the quality of the security infrastructure, and maturity levels, of various countries. The countries that appear in the upper-right quadrant show the highest levels of maturity as well as infrastructure quality. It’s important to note that these findings are based on security professionals’ perceptions of their security readiness. Figure X. Gauging Security Maturity by Infrastructure and Country Japan France Russia Germany Mexico Italy China Brazil India U.S. U.K. Australia Source: Cisco 2015 Security Capabilities Benchmark Study Middle Upper Middle HighConstantUpdate, LatestTech RegularUpgrade Cadence Figure 60. Gauging Security Maturity by Infrastructure and Country Figure 61. Maturity Levels by Country SHARE
  • 54.
    54 Security Capabilities BenchmarkStudyCisco 2016 Annual Security Report RECOMMENDATIONS: RESPONDING TO THE REALITY CHECK As our Security Benchmark Capabilities Study shows, reality has set in for security professionals. Security professionals’ confidence in their readiness to block attackers is wavering. However, the reality checks provided by high-profile exploits have had a positive effect on the industry, judging from the uptick in security training and formal policy development. In addition, the more frequent outsourcing of audits and incident response services indicates that defenders are searching for expert help. Enterprises should continue to raise their awareness of their security preparedness, and security professionals must champion the growth of budgetary outlays to support technology and personnel. In addition, confidence will rise when security practitioners deploy tools that can not only detect threats, but also contain their impact and boost understanding of ways to prevent future attacks.
  • 55.
    55 Security Capabilities BenchmarkStudyCisco 2016 Annual Security Report A Look Forward
  • 56.
    56 A Look ForwardCisco2016 Annual Security Report In the post–Edward Snowden era, the geopolitical landscape for Internet governance has changed dramatically. There is now pervasive uncertainty surrounding the free flow of information across borders. The landmark case brought by the Austrian privacy activist Max Schrems against the social networking giant Facebook had perhaps the biggest impact, leading the Court of Justice of the European Union (CJEU) to overturn the U.S. Safe Harbor agreement on October 6, 2015.⁷ Consequently, companies are now forced to rely on mechanisms and legal safeguards other than Safe Harbor when transferring data out of the EU to the United States— which are, in turn, subject to investigation. Data companies are still trying to assess the fallout from this move. And while EU and U.S. authorities have been working on a replacement for Safe Harbor for the last two years, there are concerns about the anticipated new mechanism. It could either fail to materialize by the January 2016 deadline or, perhaps more likely, fail to restore market confidence if it does not fully address the concerns of the CJEU and proves once more to be at risk of invalidation.⁸ Data protection experts expect Safe Harbor 2.0 to be no less controversial than its predecessor. It may even follow the same path by being challenged in court and also declared invalid.⁹ End-to-end encryption—how it benefits consumers and organizations, and the challenges it creates for law enforcement in their investigations of criminal and terrorist activity—will also be a topic of much debate between governments and industry in the year ahead. The terrorist attacks in Paris in November 2015 have some policymakers pushing even harder to give investigators the ability to access the content of encrypted communications.¹⁰ This could give additional momentum to the development of Safe Harbor 2.0, as civil liberties concerns take a back seat to security concerns. Geopolitical Perspective: Uncertainty in the Internet Governance Landscape A Look Forward Cisco geopolitical experts offer insight on the changing landscape for Internet governance, including changes in data transfer legislation and the debate over the use of encryption. Also featured in this section are select findings from two Cisco studies. One examines executives’ concerns about cybersecurity. The other focuses on IT decision- makers’ perceptions about security risk and trustworthiness. We also give an overview of the value of an integrated threat defense architecture and provide an update on Cisco’s progress in reducing time to detection (TTD). ⁷ “The Court of Justice declares that the Commission’s U.S. Safe Harbour Decision is invalid,” CJEU, October 6, 2015: http://curia.europa.eu/jcms/upload/docs/application/pdf/2015-10/cp150117en.pdf. ⁸ “Safe Harbor 2.0 framework begins to capsize as January deadline nears,” by Glyn Moody, Ars Technica, November 16, 2015: http://arstechnica.com/tech-policy/2015/11/safe-harbour-2-0-framework-begins-to-capsize-as-january-deadline-nears/. ⁹ “Safe Harbor 2.0 framework begins to capsize as January deadline nears,” by Glyn Moody, Ars Technica, November 16, 2015: http://arstechnica.com/tech-policy/2015/11/safe-harbour-2-0-framework-begins-to-capsize-as-january-deadline-nears/. ¹⁰ “Paris Attacks Fan Encryption Debate,” by Danny Yadron, Alistair Barr, and Daisuke Wakabayashi, The Wall Street Journal, November 19, 2015: http://www.wsj.com/articles/paris-attacks-fan-encryption-debate-1447987407.
  • 57.
    57 A Look ForwardCisco2016 Annual Security Report Amid such uncertainty, what should organizations ask data providers in order to make sure that their business is in compliance with data transfer regulations? In the short term, they should certainly seek assurances from vendors that they are using EU Model Contract Clauses or Binding Corporate Rules—and not just Safe Harbor—when transferring data out of the EU. Another major geopolitical issue that organizations should monitor relates to vulnerabilities and exploits. Some governments are expressing great concern about the rise of a market for unpatched vulnerabilities—so-called weaponized software. Such tools are vital to the security research community as it looks for ways to protect networks around the globe. But in the wrong hands, particularly those of repressive regimes, this technology, intended for good, could be used for financial crime, to steal national and commercial secrets, suppress political dissent, or disrupt critical infrastructure. How to restrict access to unpatched vulnerabilities without tying the hands of those conducting vital research is an issue that governments will clearly wrestle with in the coming months and years. As governments attempt to tackle this thorny problem, they need to carefully assess how their policymaking decisions affect security. For example, the uncertainty about laws that govern the transmission of information about unpublished vulnerabilities could chill the advancement of security threat research, or encourage the publication of vulnerabilities before vendors have an opportunity to patch them. Any approach to resolving this uncertainty should be compatible across the globe. Cybersecurity Concerns Weigh on Minds of Executives Obviously, in-depth security can help enterprises avoid calamitous breaches and attacks. But can it help improve the chances of a company’s success? According to an October 2015 Cisco study of finance and line-of-business executives regarding cybersecurity’s role in business and digital strategy, enterprise executives understand that protecting their businesses from threats may dictate whether they succeed or fail. As organizations become more digitized, growth will depend on their ability to protect the digital platform. As the survey shows, cybersecurity is a growing concern for executives: 48 percent said they were very concerned, and 39 percent said they were moderately concerned, about cybersecurity breaches. This concern is on the rise; 41 percent said they were much more concerned about security breach- es than they were three years ago, and 42 percent said they were a little more concerned than before. Business leaders are also anticipating that investors and regulators will ask tougher questions about security processes, just as they ask questions about other business functions. Ninety-two percent of the respondents agreed that regulators and investors will expect companies to provide more information on cybersecurity risk exposure in the future. Enterprises also appear to have a keen sense of the cyber- security challenges they face. The inability of cybersecurity policies to keep pace with business change was the most common challenge cited, followed by the lack of metrics to determine security effectiveness (Figure 62). Figure 62. Enterprises Face Tough Cybersecurity Challenges Source: Cisco Security Research Figure X. Enterprises Face Tough Cybersecurity Challenges 32% 24% 21% Do Not Know Our Major Cybersecurity Vulnerabilities Ineffective Enforcement of Cybersecurity Policies 26% Insufficient Investment in Cybersecurity 27% Lack of the Right Metrics to Determine Cybersecurity Effectiveness Inability of Cybersecurity Policy to Keep Up with the Pace of Business Change
  • 58.
    58 A Look ForwardCisco2016 Annual Security Report About a third of executives are also worried about their ability to safeguard critical data. When asked to name the types of information that are most difficult to protect, 32 percent selected “confidential financial information.” Respondents named “customer information” and “confidential business information” as the next two most difficult types of data to protect (see Figure 63). Trustworthiness Study: Shining a Light on the Risks and Challenges for Enterprises The relentless rise in information security breaches underscores the deep need for enterprises to trust that their systems, data, business partners, customers, and citizens are safe. We are seeing trust become a major factor for businesses selecting IT and networking infrastructure. In fact, many are now requiring that security and trustworthiness be integrated throughout the product lifecycle of the solutions that comprise their infrastructure. In October 2015, Cisco conducted a study to assess IT decision-makers’ perceptions of their security risks and challenges and to determine the role that IT vendor trustworthiness plays in their IT investments. We surveyed both information security and non-information-security decision-makers at organizations in several countries. (See the Appendix for more details on the Security Risk and Trustworthiness Study, including our methodology.) FOLLOWING ARE SELECT FINDINGS FROM OUR RESEARCH: We found that 65 percent of the respondents think that their organization faces a significant level of security risk— namely, from the use of mobility, IT security, and cloud- based solutions in the enterprise (Figure 64). Figure 63. Executives Concerned About Securing Critical Data Source: Cisco Security Research Customer Information (Transactional Data) Confidential Financial Information Confidential Business Information (Operational Data) 32% 31% 30% Figure X. Executives Concerned About Securing Critical Data Figure 64. Perceptions of Security Risk Enterprises believe the following areas of their organization’s infrastructure are at a high risk for a security breach: 50% Mobility Cloud-Based 42% of respondents think their organizations are threatened 65% IT Security 43% Source: Security Risk and Trustworthiness Study, Cisco Figure X. Perceptions of Security Risk SHARE
  • 59.
    59 A Look ForwardCisco2016 Annual Security Report Sixty-eight percent of the respondents to our study identified malware as the top external security challenge that their organization faces. Phishing and advanced persistent threats rounded out the top three responses— at 54 percent and 43 percent, respectively (see Figure 65). As for internal security challenges (see Figure 66), more than half (54 percent) of our respondents cited malicious software downloads as the top threat, followed by internal security breaches by employees (47 percent), and hardware and software vulnerabilities (46 percent). We also found that most enterprises (92 percent) employ a dedicated security team within their organization. Eighty-eight percent of respondents reported that they have a formal, organization-wide security strategy that is renewed regularly. However, only 59 percent have standardized policies and procedures in place to validate IT vendor trustworthiness (see Figure 67). In addition, about half (49 percent) of large enterprise organizations keep their security infrastructure up to date with the most current technologies, and most others upgrade their infrastructure regularly. Very few wait to upgrade until the technology they use is obsolete, according to our study. Figure 65. External Challenges Faced (Total Respondents) Source: Security Risk and Trustworthiness Study, Cisco Figure X. External Challenges Faced (Total Respondents) I Do Not Consider Any of These to Be Challenges for My Organization Advanced Persistent Threats 43% Denial of Service Attacks 38% Brute-Force Attacks 35% Zero-Day Attacks 35% 3% Phishing 54% Malware 68% Figure 66. Internal Security Challenges Faced (Total Respondents) Source: Security Risk and Trustworthiness Study, Cisco Figure X. Internal Challenges Faced (Total Respondents) 54%Malicious Software Downloads Internal Security Breaches by Employees 47% 46% Hardware or Software Vulnerabilities Employees Using Their Own Devices/ Software/Cloud Apps to Do Business 43% Lack of Employee Awareness 39% IT Security Staff Is Not Adequately Trained 26% I Do Not Consider Any of These to Be Challenges for My Organization 5% Figure 67. Most Large Enterprises Have a Dedicated Security Team In-House 92% Dedicated Security Team Standardized Validation Policies and Procedures 59% Organization-Wide Security Strategy 88% Source: Security Risk and Trustworthiness Study, Cisco Figure X. Most Large Enterprises Have a Dedicated Security Team In-House SHARE
  • 60.
    60 A Look ForwardCisco2016 Annual Security Report In today’s threat-centric landscape, confidence in a vendor’s processes, policies, technologies, and people—and the ability to verify them—are foundational to building a lasting, trusted relationship between vendors and enterprises. Technology vendors demonstrate trustworthiness by: •• Building security into their solutions and the value chain from inception •• Having and following policies and processes in place that reduce risk •• Creating a security-aware culture •• Responding to breaches quickly and transparently •• Providing rapid remediation and constant vigilance after an incident How Vendors Can Demonstrate Trustworthiness Upgrading infrastructure is good practice, of course. Organizations of all sizes need to deploy a secure, trustworthy infrastructure in which security is designed into all facets of the network. However, they can also help to shrink the attack surface by fostering an open, security-aware culture. Building this culture requires that organizations implement consistent, enterprise-wide policies and processes that ensure security is embedded into every aspect of the business. They must then work to extend this security-centric mindset to their ecosystem of partners and suppliers, and continually work to demonstrate transparency and accountability with customers, partners, and other stakeholders. Time to Detection: The Race to Keep Narrowing the Window We define “time to detection,” or TTD, as the window of time between the first observation of an unknown file and the detection of a threat. We determine this time window using opt-in security telemetry gathered from Cisco security products deployed around the globe. The “retrospectives” category in Figure 68 shows the number of files that Cisco initially categorized as “unknown” and later converted to “known bad.” As reported in the Cisco 2015 Midyear Security Report, the median TTD was about two days (50 hours). Figure 68. Time to Detection, December 2014–October 2015 Source: Cisco Security Research Dec. 2014 Oct. 2015 Figure X. Time to Detection, December 2014 – November 2015 112766 112664 96106 197158 286457 379366 205601 192975 150480 154353 20.4 17.5 50.3 46.4 44.5 44.4 49.3 41.4 34.3 32.8 27.0 Median TTD 20 40 60 Hours Retrospectives 185539
  • 61.
    61 A Look ForwardCisco2016 Annual Security Report From January to March, the median TTD was roughly the same—between 44 and 46 hours, but with a slight trend downward. In April, it had edged up slightly to 49 hours. However, by the end of May, TTD for Cisco had decreased to about 41 hours. The industrialization of hacking and the greater use of commodity malware have played an important role in our ability to narrow the window on TTD. As soon as a threat becomes industrialized, it becomes more widespread and thus easier to detect. However, we also suggest that the combination of sophisti- cated threat defenses and close collaboration among skilled security researchers has been perhaps even more critical to our ability to consistently and significantly reduce the median TTD over the course of 2015. The TTD comparison in Figure 69 shows that many threats in June were being caught within around 35.3 hours. By September, more threats were being stopped within around 17.5 hours. Again, we attribute the reduction in median TTD partly to a faster identification of commodity malware, such as Cryptowall 3.0, Upatre, and Dyre. The integration of new technologies, such as those from ThreatGRID, a Cisco company, is another factor. However, even with the narrowed time window for TTD, some threats remain harder to detect than others. Downloaders that target Microsoft Word users are typically the easiest to detect (<20 hours). Adware and browser injections are among the most difficult threats to detect (<200 hours). One reason the latter threats are so challenging to detect is that they are typically designated as a lower priority by security teams, and are therefore often overlooked in the race to deflect adversaries’ onslaught of zero-day attacks (see “Browser Infections: Widespread—and a Major Source of Data Leakage” on page 16). Figure 70 provides an overview of the types of threats that usually come to light within 100 days. Figure X. Tag Cloud for 100 Days Source:Cisco Security Research CrossRider PennyBee ConvertAd Wajam NetFilterElex OptimizerPro StartPage Systweak Yotoon MyPCBackup BitCocktail AddLyrics SupTab Compete Downloader Esprot Generik GigaClicks Kranet MultiPlug Linkury MyWebSearch OpenCandy InstallCore Visicom Spigot SpeedingUpMyPC RuKometa Sharik Dagava Browse Fox Figure 69. Time to Detection Comparison, December 2014 to October 2015 Figure 70. Tag Cloud for 100 Days SHARE Since that time, the median TTD has been on a rapid decline. By October, Cisco had reduced the median TTD to about 17 hours—less than one day. This far outpaces the current industry estimate for TTD (100 to 200 days). The speed is due to the inclusion of more detail about how short-lived infections are mitigated. Figure X. Time to Detection Comparison, June vs September 2015 Source: Cisco Security Research VS 17.5Hours Oct. (Median) 35.3Hours June (Median)
  • 62.
    62 A Look ForwardCisco2016 Annual Security Report The Six Tenets of Integrated Threat Defense In the Cisco 2015 Midyear Security Report, Cisco security experts asserted that the need for adaptive, integrated solutions will lead to major changes in the security industry within the next five years. The outcomes will be industry consolidation and a unified movement toward a scalable, integrated threat defense architecture. Such an architecture will provide visibility, control, intelligence, and context across many solutions. This “detection and response” framework will make possible a faster response to both known and emerging threats. At the core of this new architecture will be a visibility platform that delivers full contextual awareness and is continuously updated to assess threats, correlate local and global intelligence, and optimize defenses. The intent of this platform is to build a foundation that all vendors can operate on and contribute to. With visibility, there is more control, which leads to better protection across more threat vectors and the ability to thwart more attacks. Below, we present six tenets of integrated threat defense to help organizations, and their security vendors, better understand the intent and potential benefits of this architecture: 1. A richer network and security architecture is needed to address the growing volume and sophistication of threat actors. For the past 25 years, the traditional model for security has been “See a problem, buy a box.” But these solutions, often a collection of technologies from many different security vendors, don’t talk to each other in any meaningful way. They produce information and intelligence about security events, which are integrated into an event platform and then analyzed by security personnel. An integrated threat defense architecture is a detection and response framework that offers more capabilities and supports faster threat responses by collecting more information from deployed infrastructure in an automated, efficient manner. The framework observes the security environment more intelligently. Instead of just alerting security teams to suspicious events and policy violations, it can paint a clear picture of the network and what’s happening on it to help inform better decision-making around security. 2. Best-in-class technology alone cannot deal with the current—or future—threat landscape; it just adds to the complexity of the networked environment. Organizations invest in “best in class” security technologies, but how do they know if those solutions are really working? The headlines about major security breaches over the past year are evidence that many security technologies aren’t working well. And when they fail, they fail badly. A proliferation of security vendors offering best-in- class solutions doesn’t help to improve the security environment unless those vendors offer radically different—not just slightly different—solutions from those of their competitors. But today, there are no stark differences in many offerings from leading vendors in most core areas of security. 3. More encrypted traffic will require an integrated threat defense that can converge on encrypted malicious activity that renders particular point products ineffective. As discussed in this report, encrypted web traffic is on the rise. There are good reasons for using encryption, of course, but encryption also makes it challenging for security teams to track threats. The answer to the encryption “problem” is to have more visibility into what’s happening on devices or networks. Integrated security platforms can help to provide this. 4. Open APIs are crucial to an integrated threat defense architecture. Multivendor environments need a common platform that provides greater visibility, context, and control. Building a front-end integration platform can support better automation and bring better awareness into the security products themselves. 5. An integrated threat defense architecture requires less gear and software to install and manage. Security vendors should strive to offer platforms that are as feature-rich as possible and that offer extensive functionality on one platform. This will help to reduce the complexity and fragmentation in the security environment that create too many opportunities for easy access and concealment for adversaries.
  • 63.
    63 A Look ForwardCisco2016 Annual Security Report 6. The automation and coordination aspects of an integrated threat defense help to reduce time to detection, containment, and remediation. Reducing false positives helps security teams focus on what matters most. Contextualization supports a front- line analysis of events underway, helps teams assess whether those events require immediate attention, and can ultimately produce automated responses and deeper analytics. Power in Numbers: The Value of Industry Collaboration Industry collaboration is essential not only to developing a future architecture for integrated threat defense that will enable faster threat response, but also for keeping pace today with a global community of increasingly bold, innovative, and persistent threat actors. Adversaries are becoming only more adept at deploying hard-to-detect and highly profitable campaigns. Many now employ legitimate assets in the infrastructure to support their campaigns—and with great success. Given this landscape, it is not surprising that the defenders surveyed for our Cisco 2015 Security Capabilities Benchmark Study are less confident in their ability to help secure their organization. We suggest that defenders consider the powerful impact that proactive and continuous industry collaboration can have in bringing cybercriminal activity to light, undermining adversaries’ ability to generate revenue, and reducing the opportunity to launch future attacks. As discussed in depth earlier in this report (see “Featured Stories,” starting on page 10), collaboration between a Cisco Partner Contributor and within our Cisco Collective Security Intelligence (CSI) ecosystem, and cooperation with service providers, were significant factors in Cisco’s ability to uncover, verify, and sideline global operations involving the Angler exploit kit, and to weaken one of the largest DDoS botnets our researchers have ever observed, SSHPsychos.
  • 64.
    64 A Look ForwardCisco2016 Annual Security Report About Cisco
  • 65.
    65 Cisco 2016 AnnualSecurity Report About Cisco Threat researchers from the Cisco Collective Security Intelligence (CSI) ecosystem bring together, under a single umbrella, the industry’s leading threat intelligence, using telemetry obtained from the vast footprint of devices and sensors, public and private feeds, and the open-source community at Cisco. This amounts to a daily ingest of billions of web requests and millions of emails, malware samples, and network intrusions. Our sophisticated infrastructure and systems consume this telemetry, helping machine-learning systems and researchers to track threats across networks, data centers, endpoints, mobile devices, virtual systems, web, email, and from the cloud to identify root causes and scope outbreaks. The resulting intelligence is translated into real-time protections for our products and services offerings that are immediately delivered globally to Cisco customers. To learn more about Cisco’s threat-centric approach to security, visit www.cisco.com/go/security. Contributors to the Cisco 2016 Annual Security Report TALOS SECURITY INTELLIGENCE AND RESEARCH GROUP Talos is Cisco’s threat intelligence organization, an elite group of security experts devoted to providing superior protection
for Cisco customers, products, and services. Talos is comprised of leading threat researchers supported by sophisticated systems to create threat intelligence for Cisco products that detect, analyze, and protect against known and emerging threats. Talos maintains the official rule sets of Snort.org, ClamAV, SenderBase.org, and SpamCop, and is the primary team that contributes threat information to the Cisco CSI ecosystem. ADVANCED SERVICES CLOUD AND IT TRANSFORMATION, OPTIMIZATION TEAM The team provides recommendations and optimizes networks, data center, and cloud solutions for the largest service providers and enterprises around the world. This consulting offer focuses on maximizing the availability, performance, and security of clients’ critical solutions. The optimization service is delivered to more than 75 percent of Fortune 500 companies. About Cisco Cisco delivers intelligent cybersecurity for the real world, providing one of the industry’s most comprehensive advanced-threat protection portfolios of solutions across the broadest set of attack vectors. Cisco’s threat-centric and operationalized approach to security reduces complexity and fragmentation while providing superior visibility, consistent control, and advanced threat protection before, during, and after an attack.
  • 66.
    66 About CiscoCisco 2016Annual Security Report ACTIVE THREAT ANALYTICS TEAM The Cisco Active Threat Analytics (ATA) team helps organizations defend against known intrusions, zero-day attacks, and advanced persistent threats by taking advantage of advanced big data technologies. This fully managed service is delivered by our security experts and our global network of security operations centers. It provides constant vigilance and on-demand analysis 24 hours a day, seven days a week. CISCO THOUGHT LEADERSHIP ORGANIZATION The Cisco Thought Leadership Organization illuminates the global opportunities, market transitions, and key solutions that transform organizations, industries, and experiences. The organization provides an incisive and predictive lens into what firms can expect in a rapidly changing world—and how they can best compete. Much of the team’s thought leadership focuses on helping organizations become digital by bridging physical and virtual environments—seamlessly and securely—to innovate faster and achieve their desired business outcomes. COGNITIVE THREAT ANALYTICS Cisco’s Cognitive Threat Analytics is a cloud-based service that discovers breaches, malware operating inside protected networks, and other security threats by means of statistical analysis of network traffic data. It addresses gaps in perimeter-based defenses by identifying the symptoms of a malware infection or data breach using behavioral analysis and anomaly detection. Cognitive Threat Analytics relies on advanced statistical modeling and machine learning to independently identify new threats, learn from what it sees, and adapt over time. GLOBAL GOVERNMENT AFFAIRS Cisco engages with governments at many different levels to help shape public policy and regulations that support the technology sector and help governments meet their goals. The Global Government Affairs team develops and influences pro-technology public policies and regulations. Working collaboratively with industry stakeholders and association partners, the team builds relationships with government leaders to influence policies that affect Cisco’s business and overall ICT adoption, looking to help shape policy decisions at a global, national, and local level. The Government Affairs team is comprised of former elected officials, parliamentarians, regulators, senior U.S. government officials, and government affairs professionals who help Cisco promote and protect the use of technology around the world. INTELLISHIELD TEAM The IntelliShield team performs vulnerability and threat research, analysis, integration, and correlation of data and information from across Cisco Security Research & Operations and external sources to produce the IntelliShield Security Intelligence Service, which supports multiple Cisco products and services. LANCOPE Lancope, a Cisco company, is a leading provider of network visibility and security intelligence to protect enterprises against today’s top threats. By analyzing NetFlow, IPFIX, and other types of network telemetry, Lancope’s StealthWatch® System delivers Context-Aware Security Analytics to quickly detect a wide range of attacks from APTs and DDoS to zero-day malware and insider threats. Combining continuous lateral monitoring across enterprise networks with user, device, and application awareness, Lancope accelerates incident response, improves forensic investigations, and reduces enterprise risk. OPENDNS OpenDNS, a Cisco company, is the world’s largest cloud- delivered security platform, serving more than 65 million daily users spread across more than 160 countries. OpenDNS Labs is the security research team at OpenDNS that supports the security platform. For more information visit www.opendns.com or https://labs.opendns.com.
  • 67.
    67 About CiscoCisco 2016Annual Security Report SECURITY AND TRUST ORGANIZATION Cisco’s Security and Trust Organization underscores Cisco’s commitment to address two of the most critical issues that are top of mind for boardrooms and world leaders alike. The organization’s core missions include protecting Cisco’s public and private customers, enabling and ensuring Cisco Secure Development Lifecycle and Trustworthy Systems efforts across Cisco’s product and service portfolio, and protecting the Cisco enterprise from ever-evolving cyber threats. Cisco takes a holistic approach to pervasive security and trust, which includes people, policies, processes, and technology. The Security and Trust organization drives operational excellence focusing across InfoSec, Trustworthy Engineering, Data Protection and Privacy, Cloud Security, Transparency and Validation, and Advanced Security Research and Government. For more information, visit http://trust.cisco.com. SECURITY RESEARCH AND OPERATIONS (SR&O) Security Research & Operations (SR&O) is responsible for threat and vulnerability management of all Cisco products and services, including the industry-leading Product Security Incident Response Team (PSIRT). SR&O helps customers understand the evolving threat landscape at events such as Cisco Live and Black Hat, as well as through collaboration with its peers across Cisco and the industry. Additionally, SR&O innovates to deliver new services such as Cisco’s Custom Threat Intelligence (CTI), which can identify indicators of compromise that have not been detected or mitigated by existing security infrastructures. Cisco Partner Contributor LEVEL 3 THREAT RESEARCH LABS Level 3 Communications is a premier global communications provider headquartered in Broomfield, Colorado, that provides communications services to enterprise, government, and carrier customers. Anchored by extensive fiber networks on three continents and connected by undersea facilities, our global services platform features deep metro assets reaching more than 500 markets in more than 60 countries. Level 3’s network provides an expansive view of the global threat landscape. Level 3 Threat Research Labs is the security group that proactively analyzes the global threat landscape and correlates information across internal and external sources to help protect Level 3 customers, its network, and the public Internet. The group regularly partners with industry leaders, such as Cisco Talos, to help research and mitigate threats.
  • 68.
    68 About CiscoCisco 2016Annual Security Report Appendix
  • 69.
    69 AppendixCisco 2016 AnnualSecurity Report Appendix Figure X. Respondent Profiles Respondent Profiles Source: Cisco 2015 Security Capabilities Benchmark Study Setting Overall Vision and Strategy 75% 67%Making Final Brand Recommendations Regarding Solutions Researching and Evaluating Solutions 75% Implementing and Managing Solutions 73% Defining Requirements 71% Approving Budgets 57% 83% 81% 78% 79% 76% 66% Areas of Security Involvement 2014 2015 20152014 (n=1738) (n=2432) 4% Healthcare 6% 15% Non-Computer- Related Manufacturing 14% Utilities/Energy 7% 14% Financial Services: Banking, Insurance 15% 3%3% Mining 1% 12% Government 9% 3% Pharmaceuticals 3% 8% Telecommunications 6% 1% Agriculture/Forestry/ Fishing 2% 5% Chemical Engineering or Manufacturing 7% 27% Other Industry 21% 5% Transportation 8% 54% Midmarket 0% Enterprise Large 46% Enterprise 49%13% 38% CSOs vs SecOps Organization Size 46%56% 2014 55%45% 2015 CSOs SecOps 20152014 Figure 71. Respondent Profiles Cisco’s 2015 Security Capabilities Benchmark Study: Respondent Profile and Resources
  • 70.
    70 AppendixCisco 2016 AnnualSecurity Report Source: Cisco 2015 Security Capabilities Benchmark Study Figure X. Although only 9% have a security budget that’s separate from the IT budget, this has increased significantly since 2014 Is the Security Budget Part of the IT Budget? (IT Department Members) 2014 (n=1720) 2015 (n=2412) All Within ITPartially Within IT Completely Separate All Within ITPartially Within IT Completely Separate 61%33% 6% 58%33% 9% Figure 72. Although Only 9% Have a Security Budget That’s Separate From the IT Budget, This Has Increased Significantly Since 2014 Figure 73. Job Titles: Respondents and Their Managers Figure X. Job Titles: Respondents and Their Managers Members of the IT Department 98%97% VS 20152014 Chief Security Officer 22% Chief Executive Officer 34% Chief Technology Officer 18% President/Owner 18% Director or Manager of IT 16% Chief Security Officer 6% Chief Information Officer 13% Chief Information Officer 6% Director of Security Operations 7% Chief Technology Officer 6% VP of IT Security 5% Director or Manager of IT 4% Risk and Compliance Officer 4% VP of IT Security 4% Security Operations Manager 4% VP of IT 2% Security Architect 4% Executive Board 2% VP of IT 3% Chief Operations Officer 1% Chief Operations Officer 3% Chief Financial Officer 1% Another Title 2% Another Title 0% Job Title Manager’s Job Title Department or Team Dedicated to Security Members of a Security Team 2014 2015(n=1738) (n=2432) 2014 2015(n=1706) (n=2382) 98% 98% 97% 94% Source: Cisco 2015 Security Capabilities Benchmark Study
  • 71.
    71 AppendixCisco 2016 AnnualSecurity Report Source: Cisco 2015 Security Capabilities Benchmark Study Security Threat Defenses Used by Organization Defenses Administered Through Cloud- Based Services (Security Respondents Who Use Security Threat Defenses) 2014 (n=1738) 2014 (n=1646) 2015 (n=2268)2015 (n=2432) Network, Security, Firewalls, and Intrusion Prevention* 60% N/A 35% None of the Above 1% 1% 11%13% Email/Messaging Security 56% 52% 37% 34% Encryption/Privacy/Data Protection 53% 53% Data Loss Prevention 55% 56% Authentication 52% 53% Firewall* N/A 65% 31% Intrusion Prevention* N/A 44% 20% Identity Administration/User Provisioning 45% 45% Access Control/Authorization 53% 48% Endpoint Protection/Anti-Malware 49% 49% 25% 25% Web Security 59% 51% 37% 31% Security Information and Event Management 43% 38% VPN 48% 40% 26% 21% Vulnerability Scanning 48% 41% 25% 21% Secured Wireless 50% 41% 26% 19% Mobility Security 51% 44% 28% 24% Endpoint Forensics 31% 26% Network Forensics 42% 31% Patching and Configuration 39% 32% Penetration Testing 38% 34% 20% 17% DDoS Defense 36% 37% “Network security, firewalls, and intrusion prevention.”*Firewall and intrusion prevention were one code in 2014: Figure X. Firewalls and Data Loss Prevention Are Most Commonly Used Security Tools Figure 74. Firewall Is the Most Common Security Threat Defense Tool Used; Fewer Security Threat Defenses Are Being Administered Through Cloud-Based Services in 2015 Compared to 2014
  • 72.
    72 AppendixCisco 2016 AnnualSecurity Report Outsourcing Figure X. Advice and consulting still top most security services outsourced Preparing for the Certification Process Currently in the Process of Becoming Certified 63% Chemical Eng. or Mfg. 58% Non-Computer-Related Mfg. 57% Transportation 46% Agriculture/Forestry/Fishing 44% Pharmaceuticals 36% Mining 70% Financial Services 70% Telecommunications 67% Healthcare 65% Government 64% Utilities/Energy 63% Other Industry Already Certified 63%31% 7% Significant Increases Seen in Audit and Incident Response Outsourcing. Outsourcing Is Seen as Being More Cost-Efficient. Half (52%) follow a standardized security policy practice such as ISO 27001—the same as last year. Of these, the vast majority are either already certified or in the process of becoming certified. Standardized Security Policy Practice Organization follows standardized information security policy practice (2015: n=1265) Source: Cisco 2015 Security Capabilities Benchmark Study Figure 75. Advice and Consulting Still Topmost Security Services Outsourced Figure X. Company view of outsourcing: Large Enterprises are significantly more likely to outsource audits and advice and consulting 10%40%44%56%55% 11%42%46%54% 14%46%45%49% Source: Cisco 2015 Security Capabilities Benchmark Study Advice and Consulting Audit Monitoring Incident Response Threat Intelligence Remediation None/ All Internal 44% 42% 41% 42% 36% 36% 37% 36% Which Security Services Are Outsourced? Midmarket Enterprise Large Enterprise (n=924) (n=319) (n=1189) Figure 76. Company View of Outsourcing: Large Enterprises Are Significantly More Likely to Outsource Audits, Advice and Consulting
  • 73.
    73 AppendixCisco 2016 AnnualSecurity Report Figure 77. Country View of Outsourcing: Japan Is Significantly More Likely to Outsource Advice and Consulting Figure X. Country view of outsourcing: Japan is significantly more likely to outsource advice and consulting Which Security Services Are Outsourced? 52% 52% 50% 48% 46% 42% 34% 18% 47% 44% 42% 39% 36% 12% TOTAL U.S. 51% 55% 49% 39% 40% 32% 9% Brazil 19% 38% 32% 32% 37% 38% 18% Germany 51% 48% 39% 38% 46% 34% 13% Italy 44% 50% 41% 43% 36% 31% 19% U.K. 54% 36% 52% 53% 16% 47% 4% Australia 52% 33% 31% 34% 36% 37% 19% China 54% 51% 51% 49% 48% 41% 12% India 58% 63% 49% 45% 44% 21% 3% Mexico 41% 40% 37% 27% 42% 41% 16% Russia 55% 59% 50% 54% 39% 41% 4% France 64% 41% 51% 53% 47% 40% 10% Japan Source: Cisco 2015 Security Capabilities Benchmark Study Advice and Consulting Audit Monitoring Incident Response Threat Intelligence Remediation None/All Internal Figure 78. On-Premises Hosting of Networks Is Still the Most Common; However, Off-Premises Hosting has Increased Since Last Year Source: Cisco 2015 Security Capabilities Benchmark Study Figure X. On-premise hosting of the organization’s networks is still the most common; however, off-premise hosting has increased since last year Where Networks Are Hosted On–Premises Off–Premises 20152014 (n=1727) (n=2417) 50% With Private Cloud 51% 54% All On–Premises 48% 23% Third–Party Managed 24% 18% Private Cloud 20% 8% Public Cloud 10%
  • 74.
    74 AppendixCisco 2016 AnnualSecurity Report Public Security Breach Source: Cisco 2015 Security Capabilities Benchmark Study Fewer Organizations in 2015 Report Having Had to Manage Public Scrutiny of Security Breaches Compared to 2014. How Much Did the Breach Drive Improvements in Your Security Threat Defense Policies, Procedures, or Technologies? (n=1134) Security Breaches Are Strong Drivers of Security Improvements: Figure X. Fewer organizations in 2015 report having had to manage public scrutiny of security breaches, compared to 2014 10%1% 42% 47% Increased Security Awareness Training Among Employees 43% Increased Investment in Security Defense Technologies or Solutions Increased Investment in Security Defense Technologies or Solutions 42% Established a Formal Set of Security Policies and Procedures 41% Increased Enforcement of Data Protection Laws and Regulations 40% Increased Investment in the Training of Security Staff 40% (Top 5 Mentions) Respondents Affected by a Security Breach (2015 n=1109) In 2015, 41 percent of respondents said they established a formal set of security policies and procedures. 41% 43% In 2015, 43 percent of respondents said they increased security training after a public breach. 48%53% VS 20152014 Not at all Not very Somewhat A lot Source: Cisco 2015 Security Capabilities Benchmark Study 10%1% 42% 47% Increased Security Awareness Training Among Employees 43% Increased Investment in Security Defense Technologies or Solutions Increased Investment in Security Defense Technologies or Solutions 42% Established a Formal Set of Security Policies and Procedures 41% Increased Enforcement of Data Protection Laws and Regulations 40% Increased Investment in the Training of Security Staff 40% (Top 5 Mentions) Respondents Affected by a Security Breach (2015 n=1109) In 2015, 41 percent of respondents said they established a formal set of security policies and procedures. 41% 43% In 2015, 43 percent of respondents said they increased security training after a public breach. 48%53% VS 20152014 Not at all Not very Somewhat A lot Figure 79. Fewer Organizations in 2015 Report Having Had to Manage Public Scrutiny of Security Breaches CSOs Mention More Improvements After Security Breach Than SecOps Managers Do. Source: Cisco 2015 Security Capabilities Benchmark Study Respondents Dedicated to Security.2014 (n=1701) 2015 (n=1347) 48%Yes 53%Yes VS 20152014 How Much Did the Breach Drive Improvements in Your Security Threat Defense Policies, Procedures, or Technologies? (n=1134) Security Breaches are Strong Drivers of Security Improvements: Not at all Not very Somewhat A lot 10%1% 42% 47% Has Your Organization Ever Had to Manage Public Scrutiny of a Security Breach?Figure 80. Public Breaches Can Improve Security
  • 75.
    75 AppendixCisco 2016 AnnualSecurity Report Leadership and Maturity Figure X. 5-segment model tracks closely to Security Capability Maturity Model (CMM) Segments Reflect a Similar Pattern to Last Year’s Study in Terms of Maturity Around the Priority of Security and How that Translates Into Processes and Procedures. This is True for the Most Part Across Countries and Industry. or More Fit More Security-Mature Profiles.60% 2014 (n=1637) 2015 (n=2401) Low Upper–Middle HighLower–Middle Middle Segment Sizing 28%2% 9% 36%25% 26%4% 8% 39%23% Source: Cisco 2015 Security Capabilities Benchmark Study Figure 81. 5-Segment Model Tracks Closely to Security Capability Maturity Model (CMM) Figure X. As in 2014, nearly all agree or strongly agree that executive leadership considers security a high priority Significantly more pharmaceutical respondents strongly agree with the statement “my organization’s executive team has established clear metrics for assessing the effectiveness of our security program” than do professionals from most other industries. Significantly more CSOs agree with all statements around executive engagement compared with SecOps. Security Roles and Responsibilities are Clarified Within My Organization’s Executive Team Cyber Risk Assessments are Routinely Incorporated Into Our Overall Risk Assessment Process My Organization’s Executive Team has Established Clear Metrics for Assessing Effectiveness of Our Security Program Executive Leadership at My Organization Considers Security a High Priority 93 532 6 40 2014 n=1738 94 531 5 41 2015 n=2432 93 572 4 36 2014 n=1738 95 551 4 40 2015 n=2432 94 582 5 35 2014 n=1738 95 581 4 36 2015 n=2432 94 632 4 32 2014 n=1738 94 611 4 35 2015 n=2432 Security Policies Strongly Disagree Strongly AgreeDisagree Agree Source: Cisco 2015 Security Capabilities Benchmark Study Figure 82. As in 2014, Nearly All Agree or Strongly Agree that Executive Leadership Considers Security a High Priority
  • 76.
    76 AppendixCisco 2016 AnnualSecurity Report Processes Source: Cisco 2015 Security Capabilities Benchmark Study Information Assets are Inventoried and Clearly Classified 93 542 6 39 95 531 5 42 2015 n=2432 2014 n=1738 We Do an Excellent Job of Managing HR Security 93 532 5 40 95 511 5 44 2015 n=2432 2014 n=1738 We Do a Good Job of Building Security Into Our Procedures for Acquiring, Developing, and Maintaining Systems 94 562 4 38 97 561 2 41 2015 n=2432 2014 n=1738 We Do a Good Job of Building Security Into Systems and Applications 93 582 5 35 96 541 4 42 2015 n=2432 2014 n=1738 Technical Security Controls in Systems and Networks are Well Managed 95 602 3 35 95 570 4 38 2015 n=2432 2014 n=1738 Computer Facilities Within My Organization are Well Protected 93 572 4 36 96 561 4 40 2015 n=2432 2014 n=1738 We Regularly Review Our Security Practices and Tools to Ensure that They are Up to Date and Effective 94 592 5 35 97 601 3 37 2015 n=2432 2014 n=1738 Access Rights to Networks, Systems, Applications, Functions, and Data are Appropriately Controlled 94 612 4 33 97 591 3 38 2015 n=2432 2014 n=1738 Strongly Disagree Strongly AgreeDisagree AgreeSecurity Policies Fewer in 2015 Strongly Agree that They Do a Good Job Building Security Into Systems and Applications Figure X. Lower Confidence in Ability to Build Security into Systems Source: Cisco 2015 Security Capabilities Benchmark Study Information Assets are Inventoried and Clearly Classified 93 542 6 39 95 531 5 42 2015 n=2432 2014 n=1738 We Do an Excellent Job of Managing HR Security 93 532 5 40 95 511 5 44 2015 n=2432 2014 n=1738 We Do a Good Job of Building Security Into Our Procedures for Acquiring, Developing, and Maintaining Systems 94 562 4 38 97 561 2 41 2015 n=2432 2014 n=1738 We Do a Good Job of Building Security Into Systems and Applications 93 582 5 35 96 541 4 42 2015 n=2432 2014 n=1738 Technical Security Controls in Systems and Networks are Well Managed 95 602 3 35 95 570 4 38 2015 n=2432 2014 n=1738 Computer Facilities Within My Organization are Well Protected 93 572 4 36 96 561 4 40 2015 n=2432 2014 n=1738 We Regularly Review Our Security Practices and Tools to Ensure that They are Up to Date and Effective 94 592 5 35 97 601 3 37 2015 n=2432 2014 n=1738 Access Rights to Networks, Systems, Applications, Functions, and Data are Appropriately Controlled 94 612 4 33 97 591 3 38 2015 n=2432 2014 n=1738 Strongly Disagree Strongly AgreeDisagree AgreeSecurity Policies Fewer in 2015 Strongly Agree that They Do a Good Job Building Security Into Systems and Applications Figure 83. Mixed Confidence in Ability to Build Security into Systems
  • 77.
    77 AppendixCisco 2016 AnnualSecurity Report Figure 83. Mixed Confidence in Ability to Build Security into Systems (continued) Source: Cisco 2015 Security Capabilities Benchmark Study Information Assets are Inventoried and Clearly Classified 93 542 6 39 95 531 5 42 2015 n=2432 2014 n=1738 We Do an Excellent Job of Managing HR Security 93 532 5 40 95 511 5 44 2015 n=2432 2014 n=1738 We Do a Good Job of Building Security Into Our Procedures for Acquiring, Developing, and Maintaining Systems 94 562 4 38 97 561 2 41 2015 n=2432 2014 n=1738 We Do a Good Job of Building Security Into Systems and Applications 93 582 5 35 96 541 4 42 2015 n=2432 2014 n=1738 Figure X. Lower Confidence in Ability to Build Security into Systems Source: Cisco 2015 Security Capabilities Benchmark Study Information Assets are Inventoried and Clearly Classified 93 542 6 39 95 531 5 42 2015 n=2432 2014 n=1738 We Do an Excellent Job of Managing HR Security 93 532 5 40 95 511 5 44 2015 n=2432 2014 n=1738 We Do a Good Job of Building Security Into Our Procedures for Acquiring, Developing, and Maintaining Systems 94 562 4 38 97 561 2 41 2015 n=2432 2014 n=1738 We Do a Good Job of Building Security Into Systems and Applications 93 582 5 35 96 541 4 42 2015 n=2432 2014 n=1738 Technical Security Controls in Systems and Networks are Well Managed 95 602 3 35 95 570 4 38 2015 n=2432 2014 n=1738 Computer Facilities Within My Organization are Well Protected 93 572 4 36 96 561 4 40 2015 n=2432 2014 n=1738 We Regularly Review Our Security Practices and Tools to Ensure that They are Up to Date and Effective 94 592 5 35 97 601 3 37 2015 n=2432 2014 n=1738 Access Rights to Networks, Systems, Applications, Functions, and Data are Appropriately Controlled 94 612 4 33 97 591 3 38 2015 n=2432 2014 n=1738 Strongly Disagree Strongly AgreeDisagree AgreeSecurity Policies Fewer in 2015 Strongly Agree that They Do a Good Job Building Security Into Systems and Applications Figure X. Enterprises Believe They Have Good Security Controls We Have Well–Documented Processes and Procedures for Incident Response and Tracking Strongly Disagree Strongly AgreeDisagree Agree 93 562 5 37 95 541 5 41 2015 n=2432 2014 n=1738 We Have Good Systems for Verifying that Security Incidents Actually Occurred 92 541 6 38 95 541 5 41 2015 n=2432 2014 n=1738 We Do a Good Job of Notifying and Collaborating with Stakeholders About Security Incidents 94 512 5 43 95 531 4 42 2015 n=2432 2014 n=1738 We Have a Good System for Categorizing Incident-Related Information 94 542 5 40 96 531 4 43 2015 n=2432 2014 n=1738 We Have Effective Processes for Interpreting and Prioritizing Incoming Incident Reports and Understanding Them 93 512 5 42 95 521 5 43 2015 n=2432 2014 n=1738 492 8 41 Security Controls Most Say They are Comfortable With Their Security Controls Except for the statement “We do a good job of notifying and collaborating with stakeholders about security incidents,” CSOs are more positive about attributes surrounding security controls than SecOps managers. Financial services respondents are more likely to strongly agree with the statement “We have a good system for categorizing incident-related information” than professionals from most other industries. Source: Cisco 2015 Security Capabilities Benchmark Study Figure X. Enterprises Believe They Have Good Security Controls We Have Well–Documented Processes and Procedures for Incident Response and Tracking Strongly Disagree Strongly AgreeDisagree Agree 93 562 5 37 95 541 5 41 2015 n=2432 2014 n=1738 We Have Good Systems for Verifying that Security Incidents Actually Occurred 92 541 6 38 95 541 5 41 2015 n=2432 2014 n=1738 We Do a Good Job of Notifying and Collaborating with Stakeholders About Security Incidents 94 512 5 43 95 531 4 42 2015 n=2432 2014 n=1738 We Have a Good System for Categorizing Incident-Related Information 94 542 5 40 96 531 4 43 2015 n=2432 2014 n=1738 We Have Effective Processes for Interpreting and Prioritizing Incoming Incident Reports and Understanding Them 93 512 5 42 95 521 5 43 2015 n=2432 2014 n=1738 We Follow a Standardized Incident Response Practice Such Aas Rfc2350, ISO/IEC 27035:2011, or U.S. Cert 90 492 8 41 93 491 6 44 2015 n=2432 2014 n=1738 Security Controls Most Say They are Comfortable With Their Security Controls Figure 84. Enterprises Believe They Have Good Security Controls
  • 78.
    78 AppendixCisco 2016 AnnualSecurity Report Except for the statement “We do a good job of notifying and collaborating with stakeholders about security incidents,” CSOs are more positive about attributes surrounding security controls than SecOps managers. Financial services respondents are more likely to strongly agree with the statement “We have a good system for categorizing incident-related information” than professionals from most other industries. Source: Cisco 2015 Security Capabilities Benchmark Study We Do a Good Job of Notifying and Collaborating with Stakeholders About Security Incidents 94 95 531 4 42 2015 n=2432 n=1738 We Have a Good System for Categorizing Incident-Related Information 94 542 5 40 96 531 4 43 2015 n=2432 2014 n=1738 We Have Effective Processes for Interpreting and Prioritizing Incoming Incident Reports and Understanding Them 93 512 5 42 95 521 5 43 2015 n=2432 2014 n=1738 We Follow a Standardized Incident Response Practice Such Aas Rfc2350, ISO/IEC 27035:2011, or U.S. Cert 90 492 8 41 93 491 6 44 2015 n=2432 2014 n=1738 Except for the statement “We do a good job of notifying and collaborating with stakeholders about security incidents,” CSOs are more positive about attributes surrounding security controls than SecOps managers. Financial services respondents are more likely to strongly agree with the statement “We have a good system for categorizing incident-related information” than professionals from most other industries. Source: Cisco 2015 Security Capabilities Benchmark Study Figure X. Enterprises Believe They Have Good Security Controls We Have Well–Documented Processes and Procedures for Incident Response and Tracking Strongly Disagree Strongly AgreeDisagree Agree 93 562 5 37 95 541 5 41 2015 n=2432 2014 n=1738 We Have Good Systems for Verifying that Security Incidents Actually Occurred 92 541 6 38 95 541 5 41 2015 n=2432 2014 n=1738 We Do a Good Job of Notifying and Collaborating with Stakeholders About Security Incidents 94 512 5 43 95 531 4 42 2015 n=2432 2014 n=1738 We Have a Good System for Categorizing Incident-Related Information 94 542 5 40 96 531 4 43 2015 n=2432 2014 n=1738 We Have Effective Processes for Interpreting and Prioritizing Incoming Incident Reports and Understanding Them 93 512 5 42 95 521 5 43 2015 n=2432 2014 n=1738 We Follow a Standardized Incident Response Practice Such Aas Rfc2350, ISO/IEC 27035:2011, or U.S. Cert 90 492 8 41 93 491 6 44 2015 n=2432 2014 n=1738 Security Controls Most Say They are Comfortable With Their Security Controls Figure 84. Enterprises Believe They Have Good Security Controls (continued) Figure 85. Quarantine/Removal of Malicious Applications and Root Cause Analysis Continue to Be the Top Processes Used Figure X. Quarantine/removal of malicious applications and root cause analysis continue to be the top processes used Processes to Eliminate Cause of Security Incidents 97% 94% Source: Cisco 2015 Security Capabilities Benchmark Study Significantly more U.S. respondents mention “none of the above” when asked about processes to eliminate the cause of a security incident compared with respondents in most other countries. 52% 48%Additional Monitoring 56% 55%Quarantine or Removal of Malicious Application 53% 53% Stopping Communication of Malicious Software 55% 55%Root Cause Analysis 45% 41%Reimage System to Previous State 48% 47% Stopping Communication of Compromised Application 47% 40%Long-Term Fix Development 2% 1%None of the Above 20152014 (n=1738) (n=2432) 51% 47%Policy Updates United States Security Incidents
  • 79.
    79 AppendixCisco 2016 AnnualSecurity Report Source: Cisco 2015 Security Capabilities Benchmark Study We Have Tools in Place that Enable Us to Review and Provide Feedback Regarding the Capabilities of Our Security Practices 93 531 5 40 96 521 4 44 2015 n=2432 2014 n=1738 Our Security Technologies are Well Integrated to Work Effectively Together 94 562 5 38 95 521 4 43 2015 n=2432 2014 n=1738 It is Easy to Determine the Scope of a Compromise, Contain it, and Remediate from Exploits 89 462 9 43 91 451 8 46 2015 n=2432 2014 n=1738 Our Threat Detection and Blocking Capabilities are Kept Up to Date 94 571 5 37 96 561 3 40 2015 n=2432 2014 n=1738 Security is Well Integrated into Our Organization’s Goals and Business Capabilities 94 582 5 36 96 561 4 40 2015 n=2432 2014 n=1738 We Routinely and Systematically Investigate Security Incidents 93 552 5 38 96 561 4 40 2015 n=2432 2014 n=1738 We Can Increase Security Controls on High-Value Assets Should Circumstances Require 94 541 5 40 97 561 3 41 2015 n=2432 2014 n=1738 We Regularly Review Connection Activity on the Network to Ensure that Security Measures are Working as Intended 94 582 4 36 96 571 3 39 2015 n=2432 2014 n=1738 We Review and Improve Our Security Practices Regularly, Formally, and Strategically Over Time 94 561 4 38 96 561 4 40 2015 n=2432 2014 n=1738 Figure X. Enterprises Lack Confidence in Ability to Contain Compromises We Have Tools in Place that Enable Us to Review and Provide Feedback Regarding the Capabilities of Our Security Practices 93 531 5 40 96 521 4 44 2015 n=2432 2014 n=1738 Our Security Technologies are Well Integrated to Work Effectively Together 94 562 5 38 95 521 4 43 2015 n=2432 2014 n=1738 It is Easy to Determine the Scope of a Compromise, Contain it, and Remediate from Exploits 89 462 9 43 91 451 8 46 2015 n=2432 2014 n=1738 Our Threat Detection and Blocking Capabilities are Kept Up to Date 94 571 5 37 96 561 3 40 2015 n=2432 2014 n=1738 Security is Well Integrated into Our Organization’s Goals and Business Capabilities 94 582 5 36 96 561 4 40 2015 n=2432 2014 n=1738 We Routinely and Systematically Investigate Security Incidents 93 552 5 38 96 561 4 40 2015 n=2432 2014 n=1738 We Can Increase Security Controls on High-Value Assets Should Circumstances Require 94 541 5 40 97 561 3 41 2015 n=2432 2014 n=1738 We Regularly Review Connection Activity on the Network to Ensure that Security Measures are Working as Intended 94 582 4 36 96 571 3 39 2015 n=2432 2014 n=1738 We Review and Improve Our Security Practices Regularly, Formally, and Strategically Over Time 94 561 4 38 96 561 4 40 2015 n=2432 2014 n=1738 Strongly Disagree Strongly AgreeDisagree AgreeSecurity Operationalization However, Companies Continue to Lack Confidence in Their Abilities to Scope and Contain Compromises Figure 86. Enterprises Exhibit Mixed Confidence in Ability to Contain Compromises
  • 80.
    80 AppendixCisco 2016 AnnualSecurity Report Figure 86. Enterprises Exhibit Mixed Confidence in Ability to Contain Compromises (continued) Source: Cisco 2015 Security Capabilities Benchmark Study We Have Tools in Place that Enable Us to Review and Provide Feedback Regarding the Capabilities of Our Security Practices 93 531 5 40 96 521 4 44 2015 n=2432 2014 n=1738 Our Security Technologies are Well Integrated to Work Effectively Together 94 562 5 38 95 521 4 43 2015 n=2432 2014 n=1738 It is Easy to Determine the Scope of a Compromise, Contain it, and Remediate from Exploits 89 462 9 43 91 451 8 46 2015 n=2432 2014 n=1738 Security is Well Integrated into Our Organization’s Goals and Business Capabilities 94 582 5 36 96 561 4 40 2015 n=2432 2014 n=1738 Figure X. Enterprises Lack Confidence in Ability to Contain Compromises We Have Tools in Place that Enable Us to Review and Provide Feedback Regarding the Capabilities of Our Security Practices 93 531 5 40 96 521 4 44 2015 n=2432 2014 n=1738 Our Security Technologies are Well Integrated to Work Effectively Together 94 562 5 38 95 521 4 43 2015 n=2432 2014 n=1738 It is Easy to Determine the Scope of a Compromise, Contain it, and Remediate from Exploits 89 462 9 43 91 451 8 46 2015 n=2432 2014 n=1738 Our Threat Detection and Blocking Capabilities are Kept Up to Date 94 571 5 37 96 561 3 40 2015 n=2432 2014 n=1738 Security is Well Integrated into Our Organization’s Goals and Business Capabilities 94 582 5 36 96 561 4 40 2015 n=2432 2014 n=1738 We Routinely and Systematically Investigate Security Incidents 93 552 5 38 96 561 4 40 2015 n=2432 2014 n=1738 We Can Increase Security Controls on High-Value Assets Should Circumstances Require 94 541 5 40 97 561 3 41 2015 n=2432 2014 n=1738 We Regularly Review Connection Activity on the Network to Ensure that Security Measures are Working as Intended 94 582 4 36 96 571 3 39 2015 n=2432 2014 n=1738 We Review and Improve Our Security Practices Regularly, Formally, and Strategically Over Time 94 561 4 38 96 561 4 40 2015 n=2432 2014 n=1738 Strongly Disagree Strongly AgreeDisagree AgreeSecurity Operationalization However, Companies Continue to Lack Confidence in Their Abilities to Scope and Contain Compromises Figure 87. Firewall Logs and System Log Analysis Continue to Be the Most Commonly Used Processes to Analyze Compromised Systems Midmarket Figure X. Firewall logs and system log analysis continue to be the most commonly used processes to analyze compromised systems System Log Analysis 40% 45%Firewall Log Network Flow Analysis 40% Malware or File Regression Analysis 34% Registry Analysis 33% Full Packet Capture Analysis 32% Correlated Event/Log Analysis 28% Disk Forensics 27% Memory Forensics 24% IOC Detection 26% External Incident Response/Analysis 21% None of the Above 1% 59% 61% 53% 55% 50% 47% 42% 40% 41% 38% 37% 2% Processes to Analyze Compromised Systems Source: Cisco 2015 Security Capabilities Benchmark Study Enterprise and Large Enterprise companies report using more processes for analyzing compromised systems than do Midmarket companies. 2014 2015(n=1738) (n=2432) Enterprise and Large Enterprise
  • 81.
    81 AppendixCisco 2016 AnnualSecurity Report Figure 88. Restoring From a Pre-Incident Backup Is the Most Common Process to Restore Affected Systems in 2015 Figure X. Restoring from a pre-incident backup is the most common process to restore affected systems in 2015 57% 59% 60% 56% 60% 55% 56% 51% 35% 35% 2% 1% Processes to Restore Affected Systems 97% 94% Source: Cisco 2015 Security Capabilities Benchmark Study Respondents in China say they patch and update applications deemed vulnerable more frequently than do respondents in other countries surveyed. Implementing Additional or New Detections and Controls Based on Identified Weaknesses Post-Incident Patching and Updating Applications Deemed Vulnerable Differential Restoration (Removing Changes Caused by an Incident) Restoring From a Pre-Incident Backup Gold Image Restoration None of the Above 2014 2015(n=1738) (n=2432) China Patch Management Figure X. The CEO or president is most likely to be notified of security incidents, followed by operations and the finance department Operations 46% 40% 45%Chief Executive Officer N/A N/A N/A Finance Department 40% Technology Partners 45% 34% Engineering 38% 33% Human Resources 36% 32% Legal 36% 28% Manufacturing 33% 27% Public Relations 28% 24% All Employees 35% 26% Business Partners 32% 21% External Authorities 22% 18% 15%Insurance Companies Groups Notified in the Event of an Incident 97% 94% Source: Cisco 2015 Security Capabilities Benchmark Study Significantly more large enterprise respondents mention notifying external authorities in the event of an incident than those from Midmarket and Enterprise companies. 2014 2015(n=1738) (n=2432) Large Enterprise ! Figure 89. The CEO or President Is Most Likely to Be Notified of Security Incidents, Followed by Operations and the Finance Department
  • 82.
    82 AppendixCisco 2016 AnnualSecurity Report Training Figure X. Nearly all companies (97%) deliver security training at least once a year 83%96% VS Have NotHave Source: Cisco 2015 Security Capabilities Benchmark Study Are Security Awareness and/or Training Programs Delivered to Security Staff on a Regular Basis? (Respondents Dedicated to Security) How Often is Security Training Delivered? (Respondents Whose Security Teams Receive Training) More companies that have experienced a breach regularly conduct security awareness and/or training programs (96%) than those companies that have not experienced a breach (83%). 89% Enterprise 93% Enterprise Large 88% Midmarket More Large Enterprises say they have security awareness and/or training programs regularly (93%) compared with Midmarket (88%) and Enterprise (89%) companies. 2014 (n=1726) 2015 (n=2402) 89% Yes 11% No 90% Yes 10% No 2015 (n=2147) 2+ Times/Year≥1 Times/Year≤1 Times/ 2–Year<1 Time/2–Year N/A N/A 3% 39% 58% 97% 2014 (n=1560) 1% 17% 82% (no 2014 data) Figure 90. Nearly All Companies (97%) Deliver Security Training at Least Once a Year Source: Cisco 2015 Security Capabilities Benchmark Study Fewer Organizations in 2015 Report Having Had to Manage Public Scrutiny of Security Breaches Compared to 2014. How Much Did the Breach Drive Improvements in Your Security Threat Defense Policies, Procedures, or Technologies? (n=1134) Security Breaches Are Strong Drivers of Security Improvements: Figure X. Fewer organizations in 2015 report having had to manage public scrutiny of security breaches, compared to 2014 10%1% 42% 47% Increased Security Awareness Training Among Employees 43% Increased Investment in Security Defense Technologies or Solutions Increased Investment in Security Defense Technologies or Solutions 42% Established a Formal Set of Security Policies and Procedures 41% Increased Enforcement of Data Protection Laws and Regulations 40% Increased Investment in the Training of Security Staff 40% (Top 5 Mentions) Respondents Affected by a Security Breach (2015 n=1109) In 2015, 41 percent of respondents said they established a formal set of security policies and procedures. 41% 43% In 2015, 43 percent of respondents said they increased security training after a public breach. 48%53% VS 20152014 Not at all Not very Somewhat A lot Figure 91. Frequency of Security Awareness Training and Incidence of Formal Security Policies Are Both Up Since 2014—Evidence of Action
  • 83.
    83 AppendixCisco 2016 AnnualSecurity Report Figure 92. As in 2014, Nearly 9 in 10 Say Their Security Staff Attend Security-Focused Conferences or Training Figure X. As in 2014, nearly 9 in 10 say their security staff attend security-focused conferences or training Do Security Staff Members Attend Conferences and/or External Training to Improve and Maintain Their Skills? (Respondents Dedicated to Security) Do Employees Serve on Security Industry Boards or Committees? (Respondents Dedicated to Security) 2014 2015(n=1738) (n=2432) 89% Yes 89% Yes 64% Yes 36% 11% 11% 35% 65% Yes 2014 2015(n=1738) (n=2432) Source: Cisco 2015 Security Capabilities Benchmark Study
  • 84.
    84 AppendixCisco 2016 AnnualSecurity Report Security Risk and Trustworthiness Study Figure X. Background & Methodology Methodology: Quantitative and Qualitative Approach Research Background and Objectives Source: Security Risk and Trustworthiness Study, Cisco Cisco is interested in obtaining a deeper understanding of Enterprise and Service Provider IT decision makers’ perceptions of their organization’s security risks and challenges and the role that IT vendor trustworthiness plays in IT solution purchases. Specific objectives include: Two methodologies were utilized to provide insight into each of these research objectives: (All respondents involved in IT purchase decision=making) Research was conducted in the U.S., U.K., France, Germany, and Canada (IDIs only) Qualitative in-depth interviews among (7 US., 3 Canada, 3 U.K., 4 Germany, 3 France) 20 service providers Quantitative web-based survey among (402 US, 282 UK, 197 Germany, 169 France) 1050 enterprise ITDMs Data collection took place from August – September 2015 In-depth interviews 45Minute Web-based survey 20Minute Gauge the level of risk from external and internal threats and vulnerabilities Understand the strategies, policies, and solutions being implemented to mitigate security risks Identify the purchase process for IT solutions and the role of IT vendor trustwor- thiness in that process Gauge interest in receiving communica- tions about how to validate IT vendor trustworthiness Determine if there are differences in security risk perspectives or approaches to mitigating risks across industries and audiences Figure 93. Background and Methodology
  • 85.
    85 AppendixCisco 2016 AnnualSecurity Report Figure X. Enterprise Respondent Profile Quantitive Source: Security Risk and Trustworthiness Study, Cisco Industry (more than 5% reported) 11% Finance 11% Healthcare 10% Non-Computer Manufacturing 10% Retail 8% Government 7% Insurance 6% Energy, Oil, and Gas 5% Engineering 5% Telecom. 29% Other Job Title Country Company Size InfoSec Classification 6%Sr. Engineer/Architect 25% 26% C-Level (CIO, CSO, CTO, etc.) U.S. 30%Director 9%Vice President 2%Legal Manager 3%Engineer Purchase Involvement Research/Evaluate Solutions 69% 69% Set Vision/Strategy Approve Major Purchases 71% 77% 77% 80% Ensure Compliance 53%Authorize Funding/Approve Budget Implement/Manage Solutions Provide Input or Make Final Brand Decisions 38% U.K. 27% France 16% Germany 19% 1000-2499 Non-InfoSec 2500-4999 10,000 or more 22% 32% 53%47% 30% 16% 5000-9999 InfoSec Figure 94. Enterprise Respondent Profile Quantitative
  • 86.
    86 AppendixCisco 2016 AnnualSecurity Report Source: Security Risk and Trustworthiness Study, Cisco Service Provider Type Country Company Size InfoSec Classification 4% 6% Media Services 11% 11% Application Services U.S./Canada Mobile Telecom. Tech Services 3%Wired Telecom. Job Title Senior Manager 7%CIO/CTO/CSO 8%Director of IT 1% 1% 1% VP of IT Manager 2%Sr. Engineer/Architect Purchase Involvement Research/Evaluate Solutions Set Vision/Strategy Approve Major Purchases Ensure Compliance Authorize Funding/Approve Implement/Manage Solutions Make Final Brand Decisions 10 U.K. 3 France 3 4Germany 6 14 7 7 6 100-999 5000 or more1000-4900 Non-InfoSecInfoSec 80% 70% 95% 100% 75% 85% 60% Figure 95. Service Provider Respondent Profile: Qualitative
  • 87.
    Americas Headquarters Cisco Systems,Inc. San Jose, CA Asia Pacific Headquarters Cisco Systems (USA) Pte. Ltd. Singapore Europe Headquarters Cisco Systems International BV Amsterdam, The Netherlands Cisco has more than 200 offices worldwide. Addresses, phone numbers, and fax numbers are listed on the Cisco Website at www.cisco.com/go/offices. Cisco and the Cisco logo are trademarks or registered trademarks of Cisco and/or its affiliates in the U.S. and other countries. To view a list of Cisco trademarks, go to this URL: www.cisco.com/go/trademarks. Third party trademarks mentioned are the property of their respective owners. The use of the word partner does not imply a partnership relationship between Cisco and any other company. (1110R) Americas Headquarters Cisco Systems, Inc. San Jose, CA Asia Pacific Headquarters Cisco Systems (USA) Pte. Ltd. Singapore Europe Headquarters Cisco Systems International BV Amsterdam, The Netherlands Cisco has more than 200 offices worldwide. Addresses, phone numbers, and fax numbers are listed on the Cisco Website at www.cisco.com/go/offices. Cisco and the Cisco logo are trademarks or registered trademarks of Cisco and/or its affiliates in the U.S. and other countries. To view a list of Cisco trademarks, go to this URL: www.cisco.com/go/trademarks. Third party trademarks mentioned are the property of their respective owners. The use of the word partner does not imply a partnership relationship between Cisco and any other company. (1110R) Americas Headquarters Cisco Systems, Inc. San Jose, CA Asia Pacific Headquarters Cisco Systems (USA) Pte. Ltd. Singapore Europe Headquarters Cisco Systems International BV Amsterdam, The Netherlands Cisco has more than 200 offices worldwide. Addresses, phone numbers, and fax numbers are listed on the Cisco Website at www.cisco.com/go/offices. Cisco and the Cisco logo are trademarks or registered trademarks of Cisco and/or its affiliates in the U.S. and other countries. To view a list of Cisco trademarks, go to this URL: www.cisco.com/go/trademarks. Third party trademarks mentioned are the property of their respective owners. The use of the word partner does not imply a partnership relationship between Cisco and any other company. (1110R) Americas Headquarters Cisco Systems, Inc. San Jose, CA Asia Pacific Headquarters Cisco Systems (USA) Pte. Ltd. Singapore Europe Headquarters Cisco Systems International BV Amsterdam, The Netherlands Cisco has more than 200 offices worldwide. Addresses, phone numbers, and fax numbers are listed on the Cisco Website at www.cisco.com/go/offices. Cisco and the Cisco logo are trademarks or registered trademarks of Cisco and/or its affiliates in the U.S. and other countries. To view a list of Cisco trademarks, go to this URL: www.cisco.com/go/trademarks. Third party trademarks mentioned are the property of their respective owners. The use of the word partner does not imply a partnership relationship between Cisco and any other company. (1110R) Adobe, Acrobat, and Flash are either registered trademarks or trademarks of Adobe Systems Incorporated in the United States and/or other countries. © 2016 Cisco and/or its affiliates. All rights reserved. Published January 2016