Download to read offline
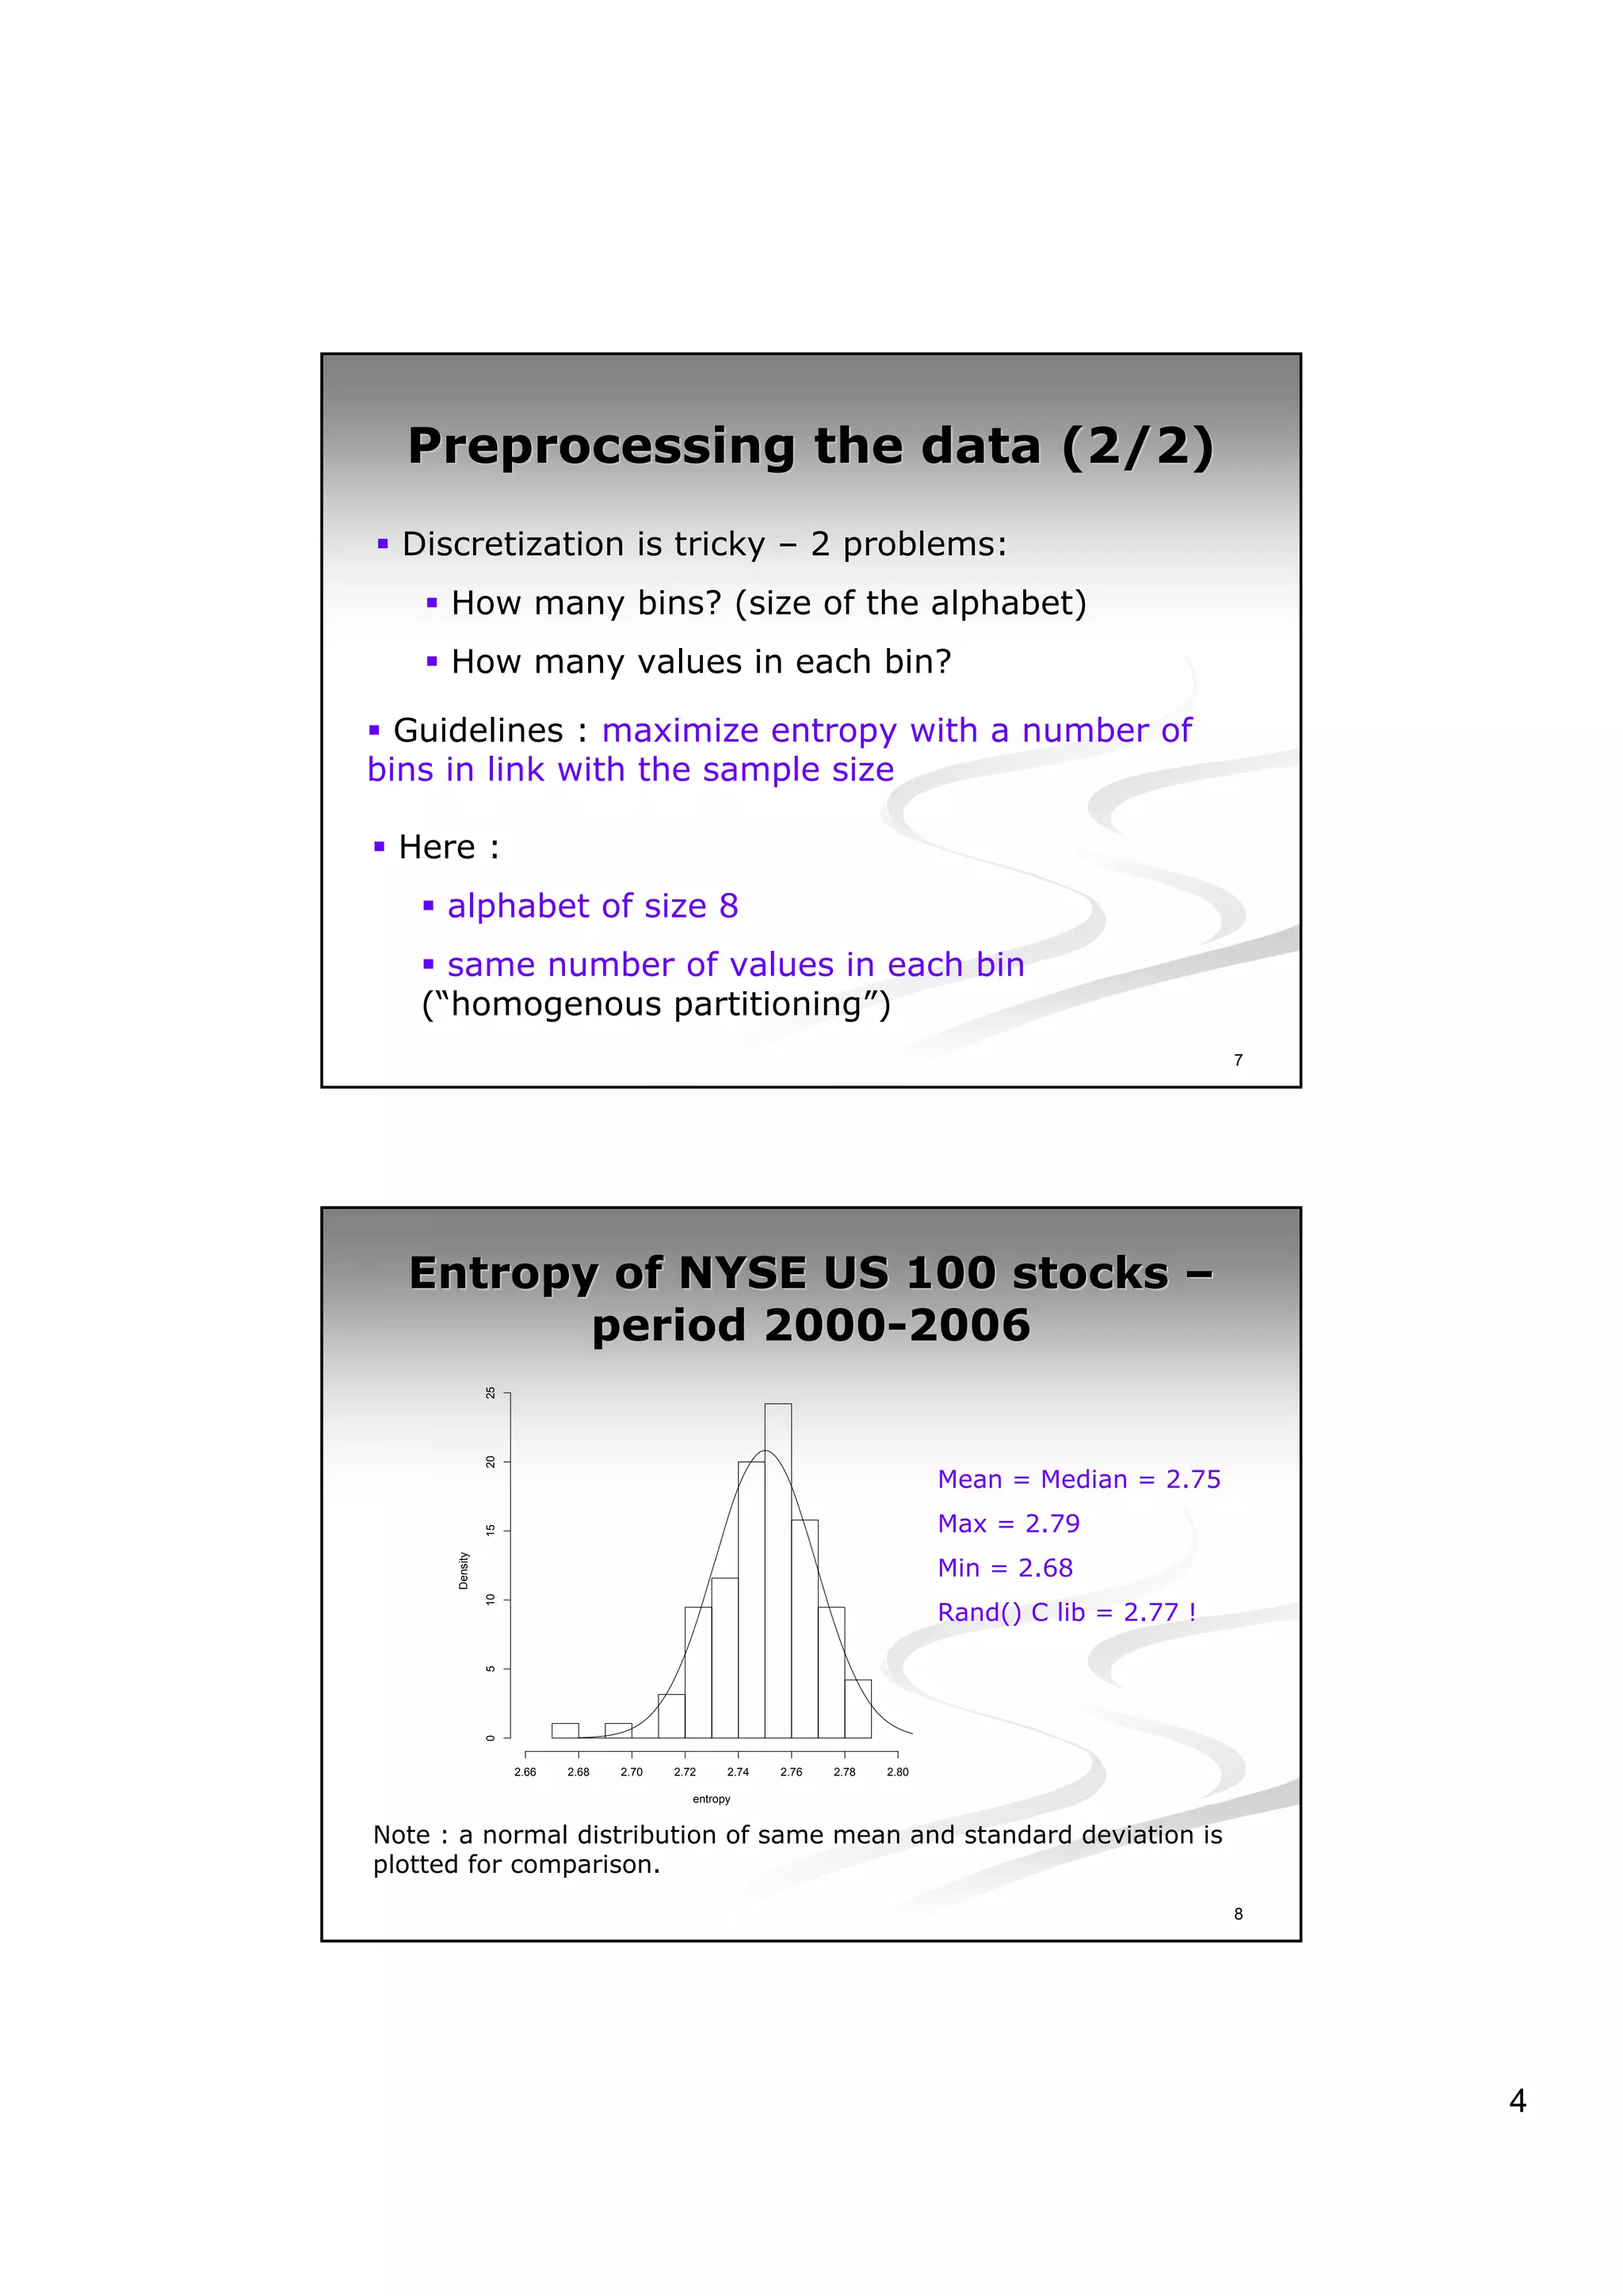
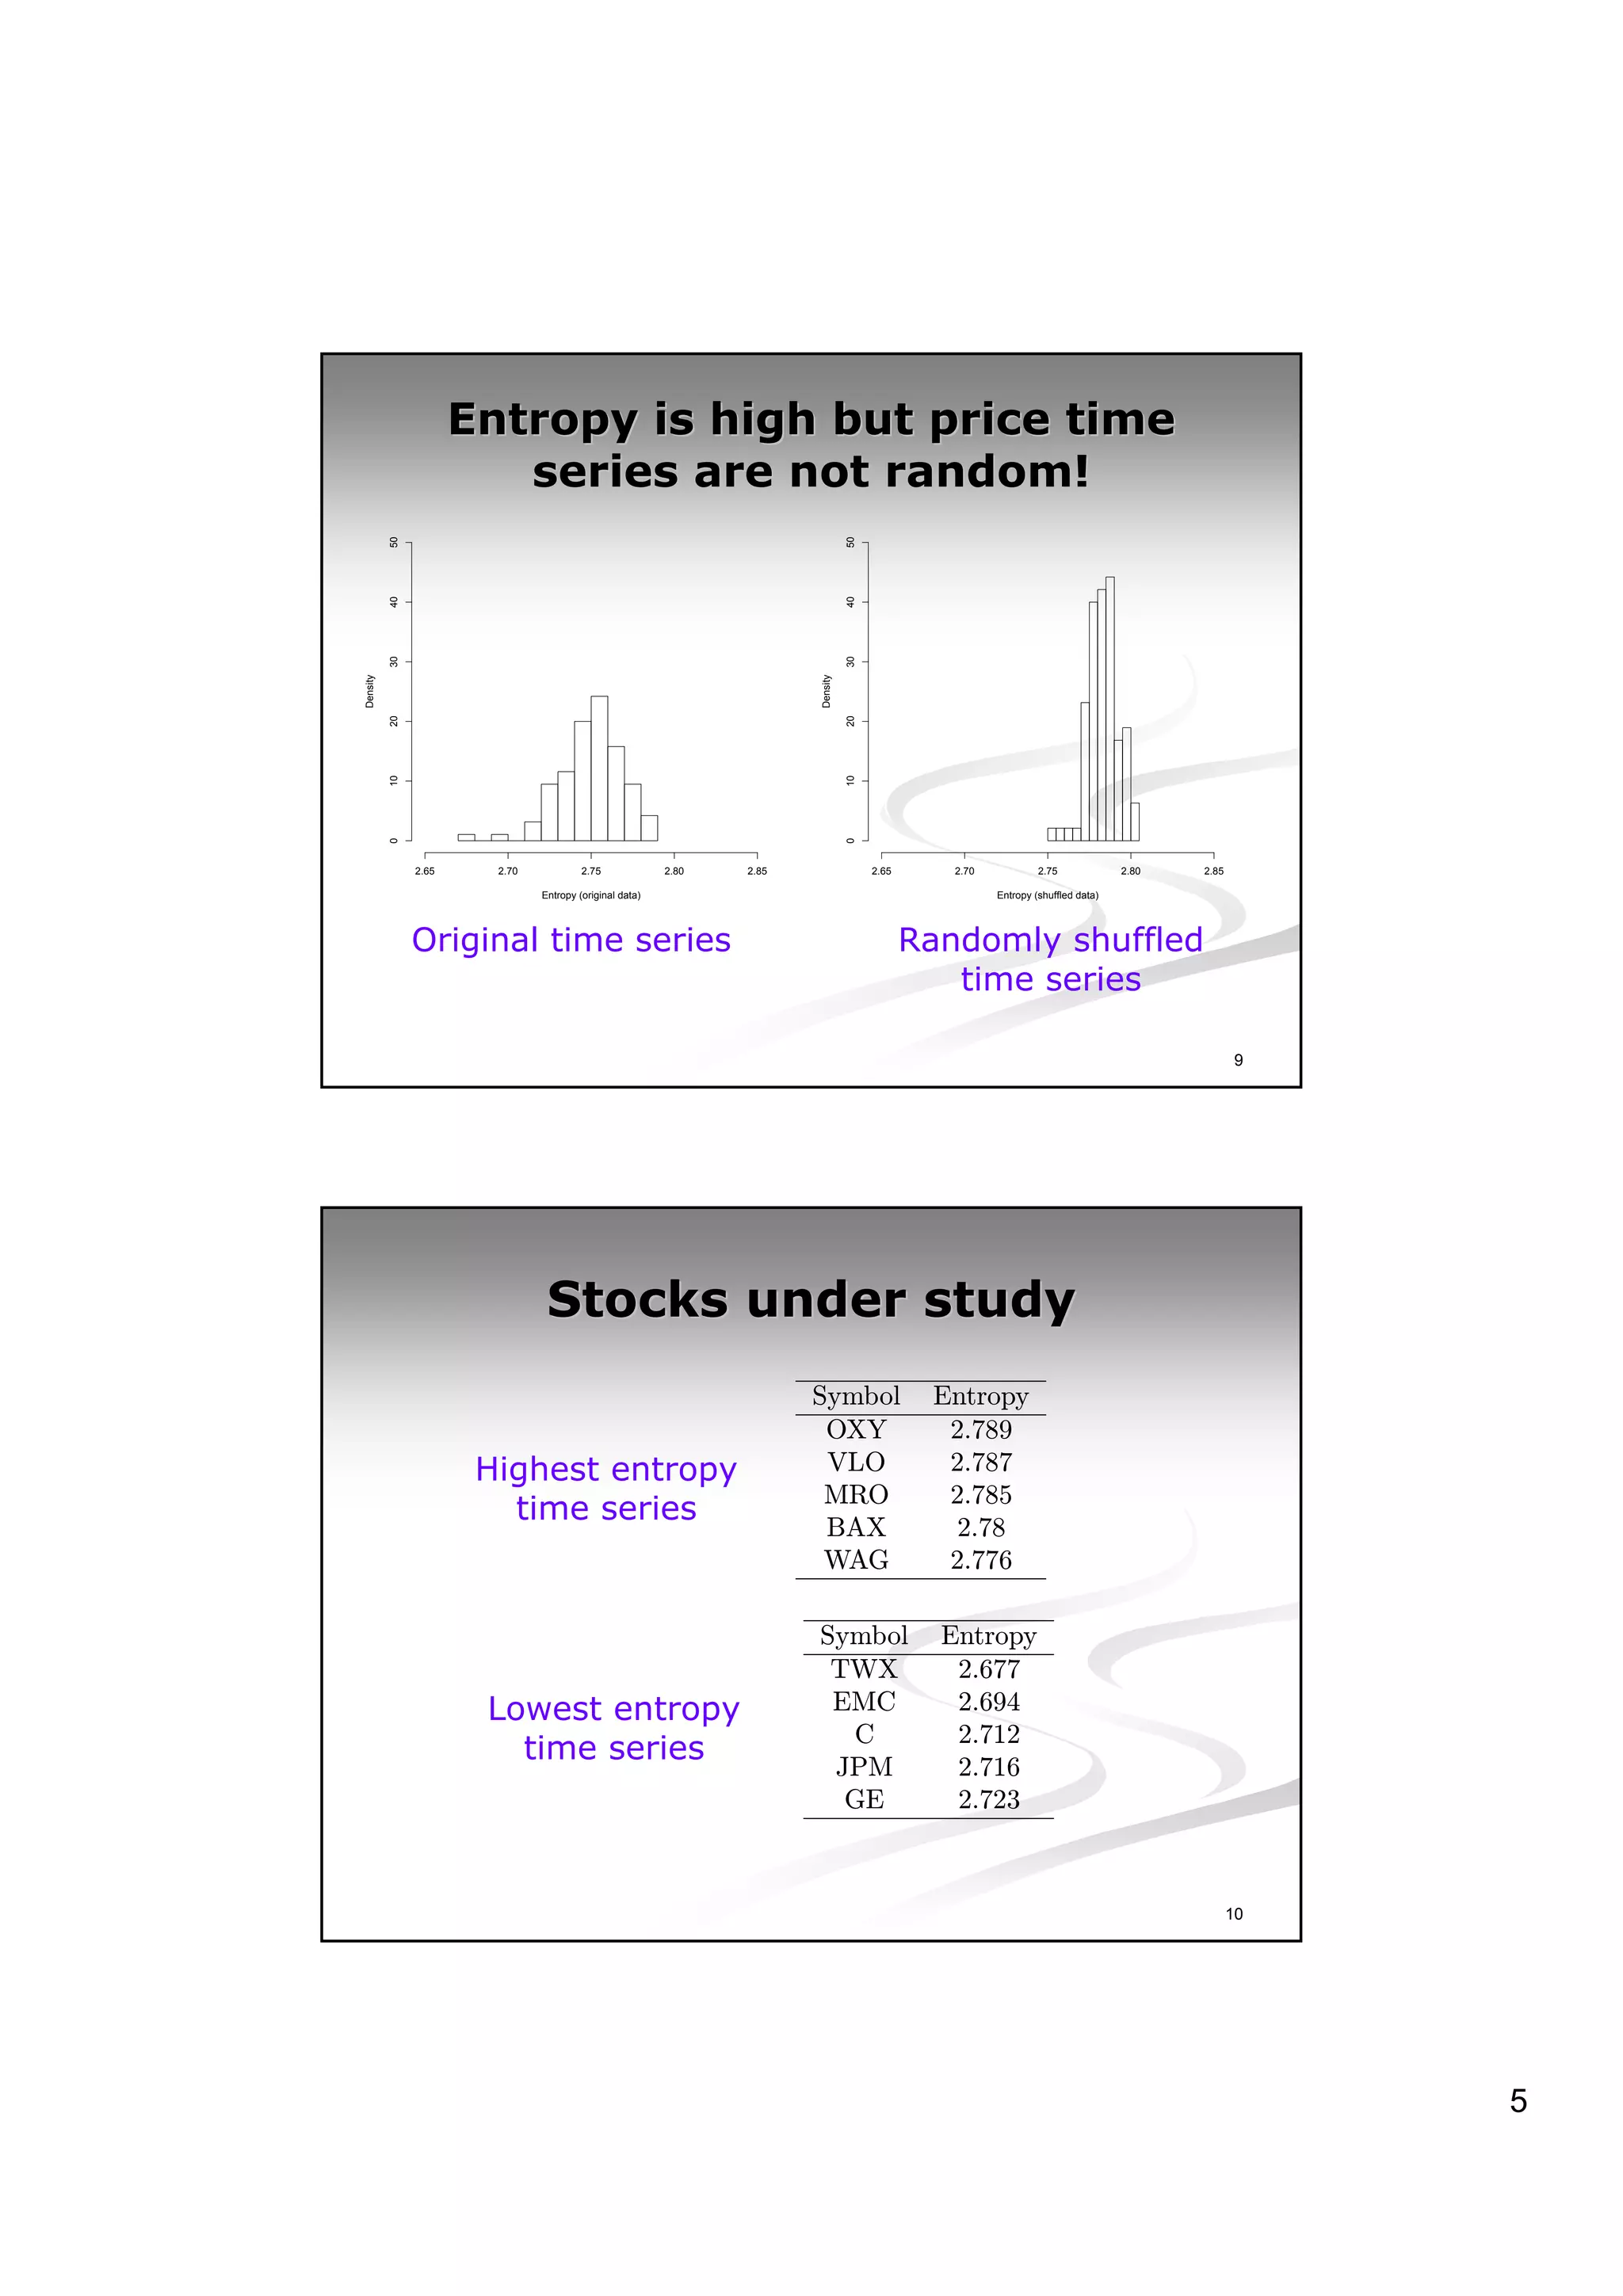
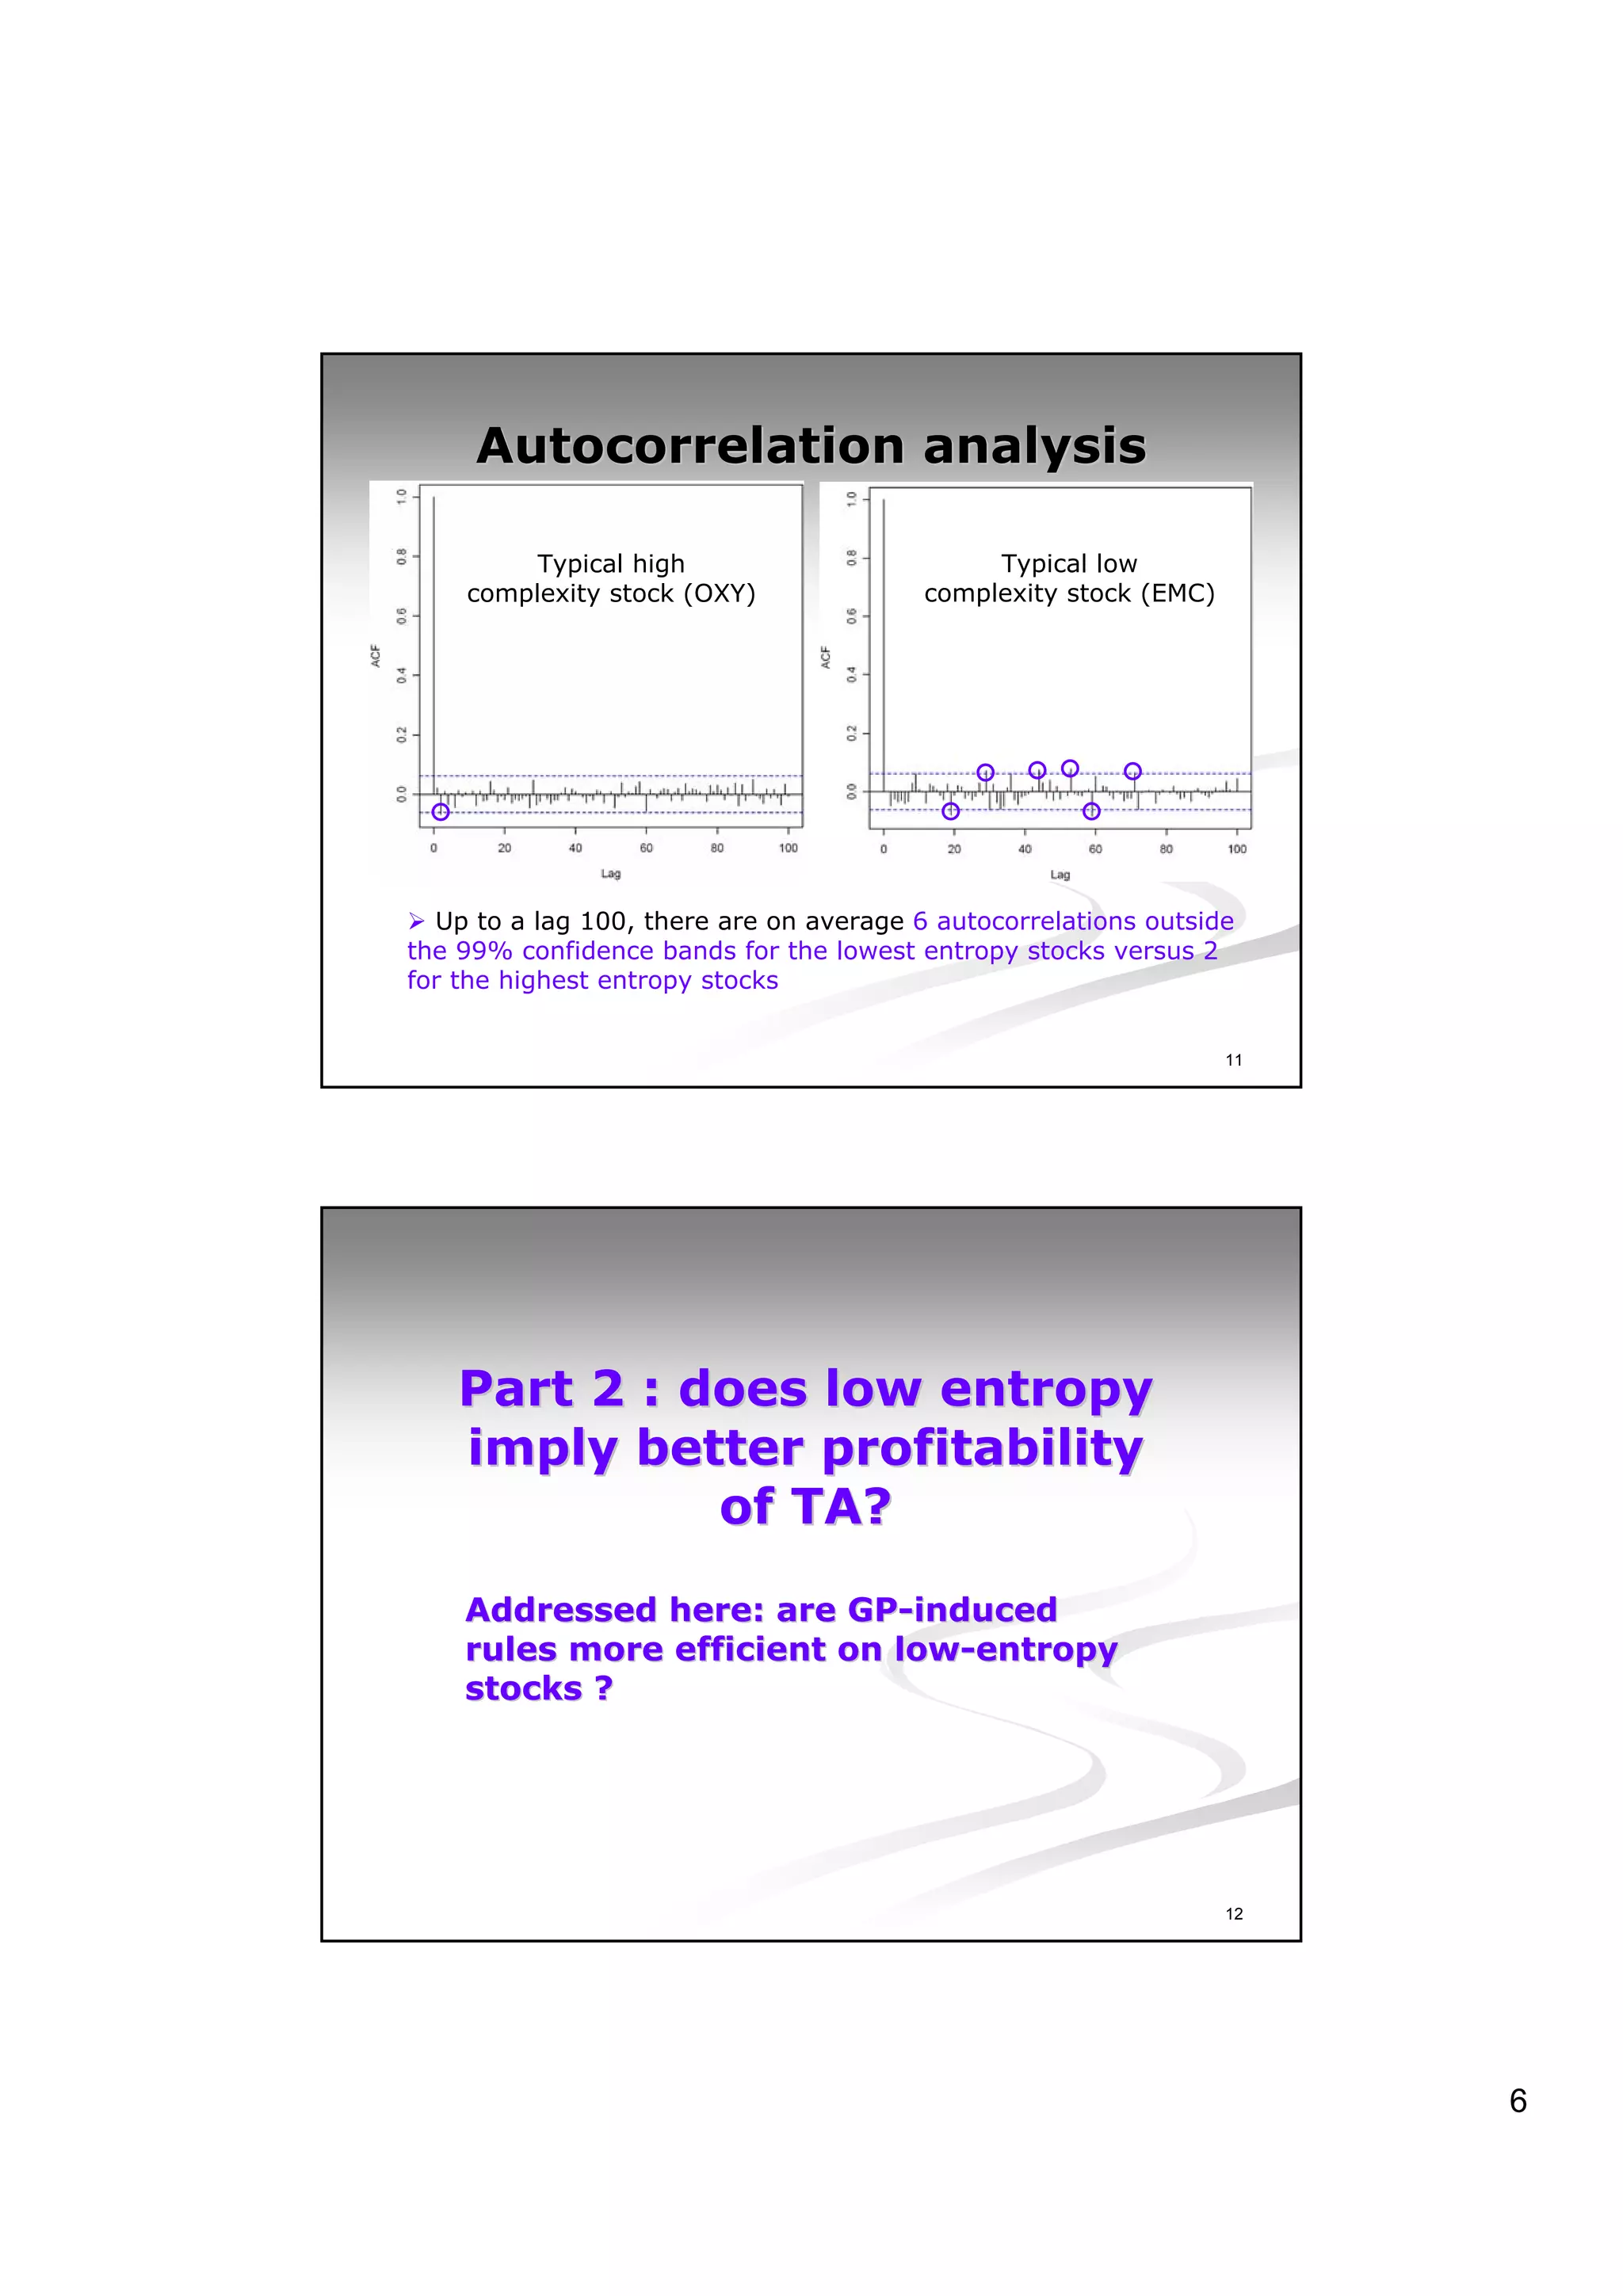
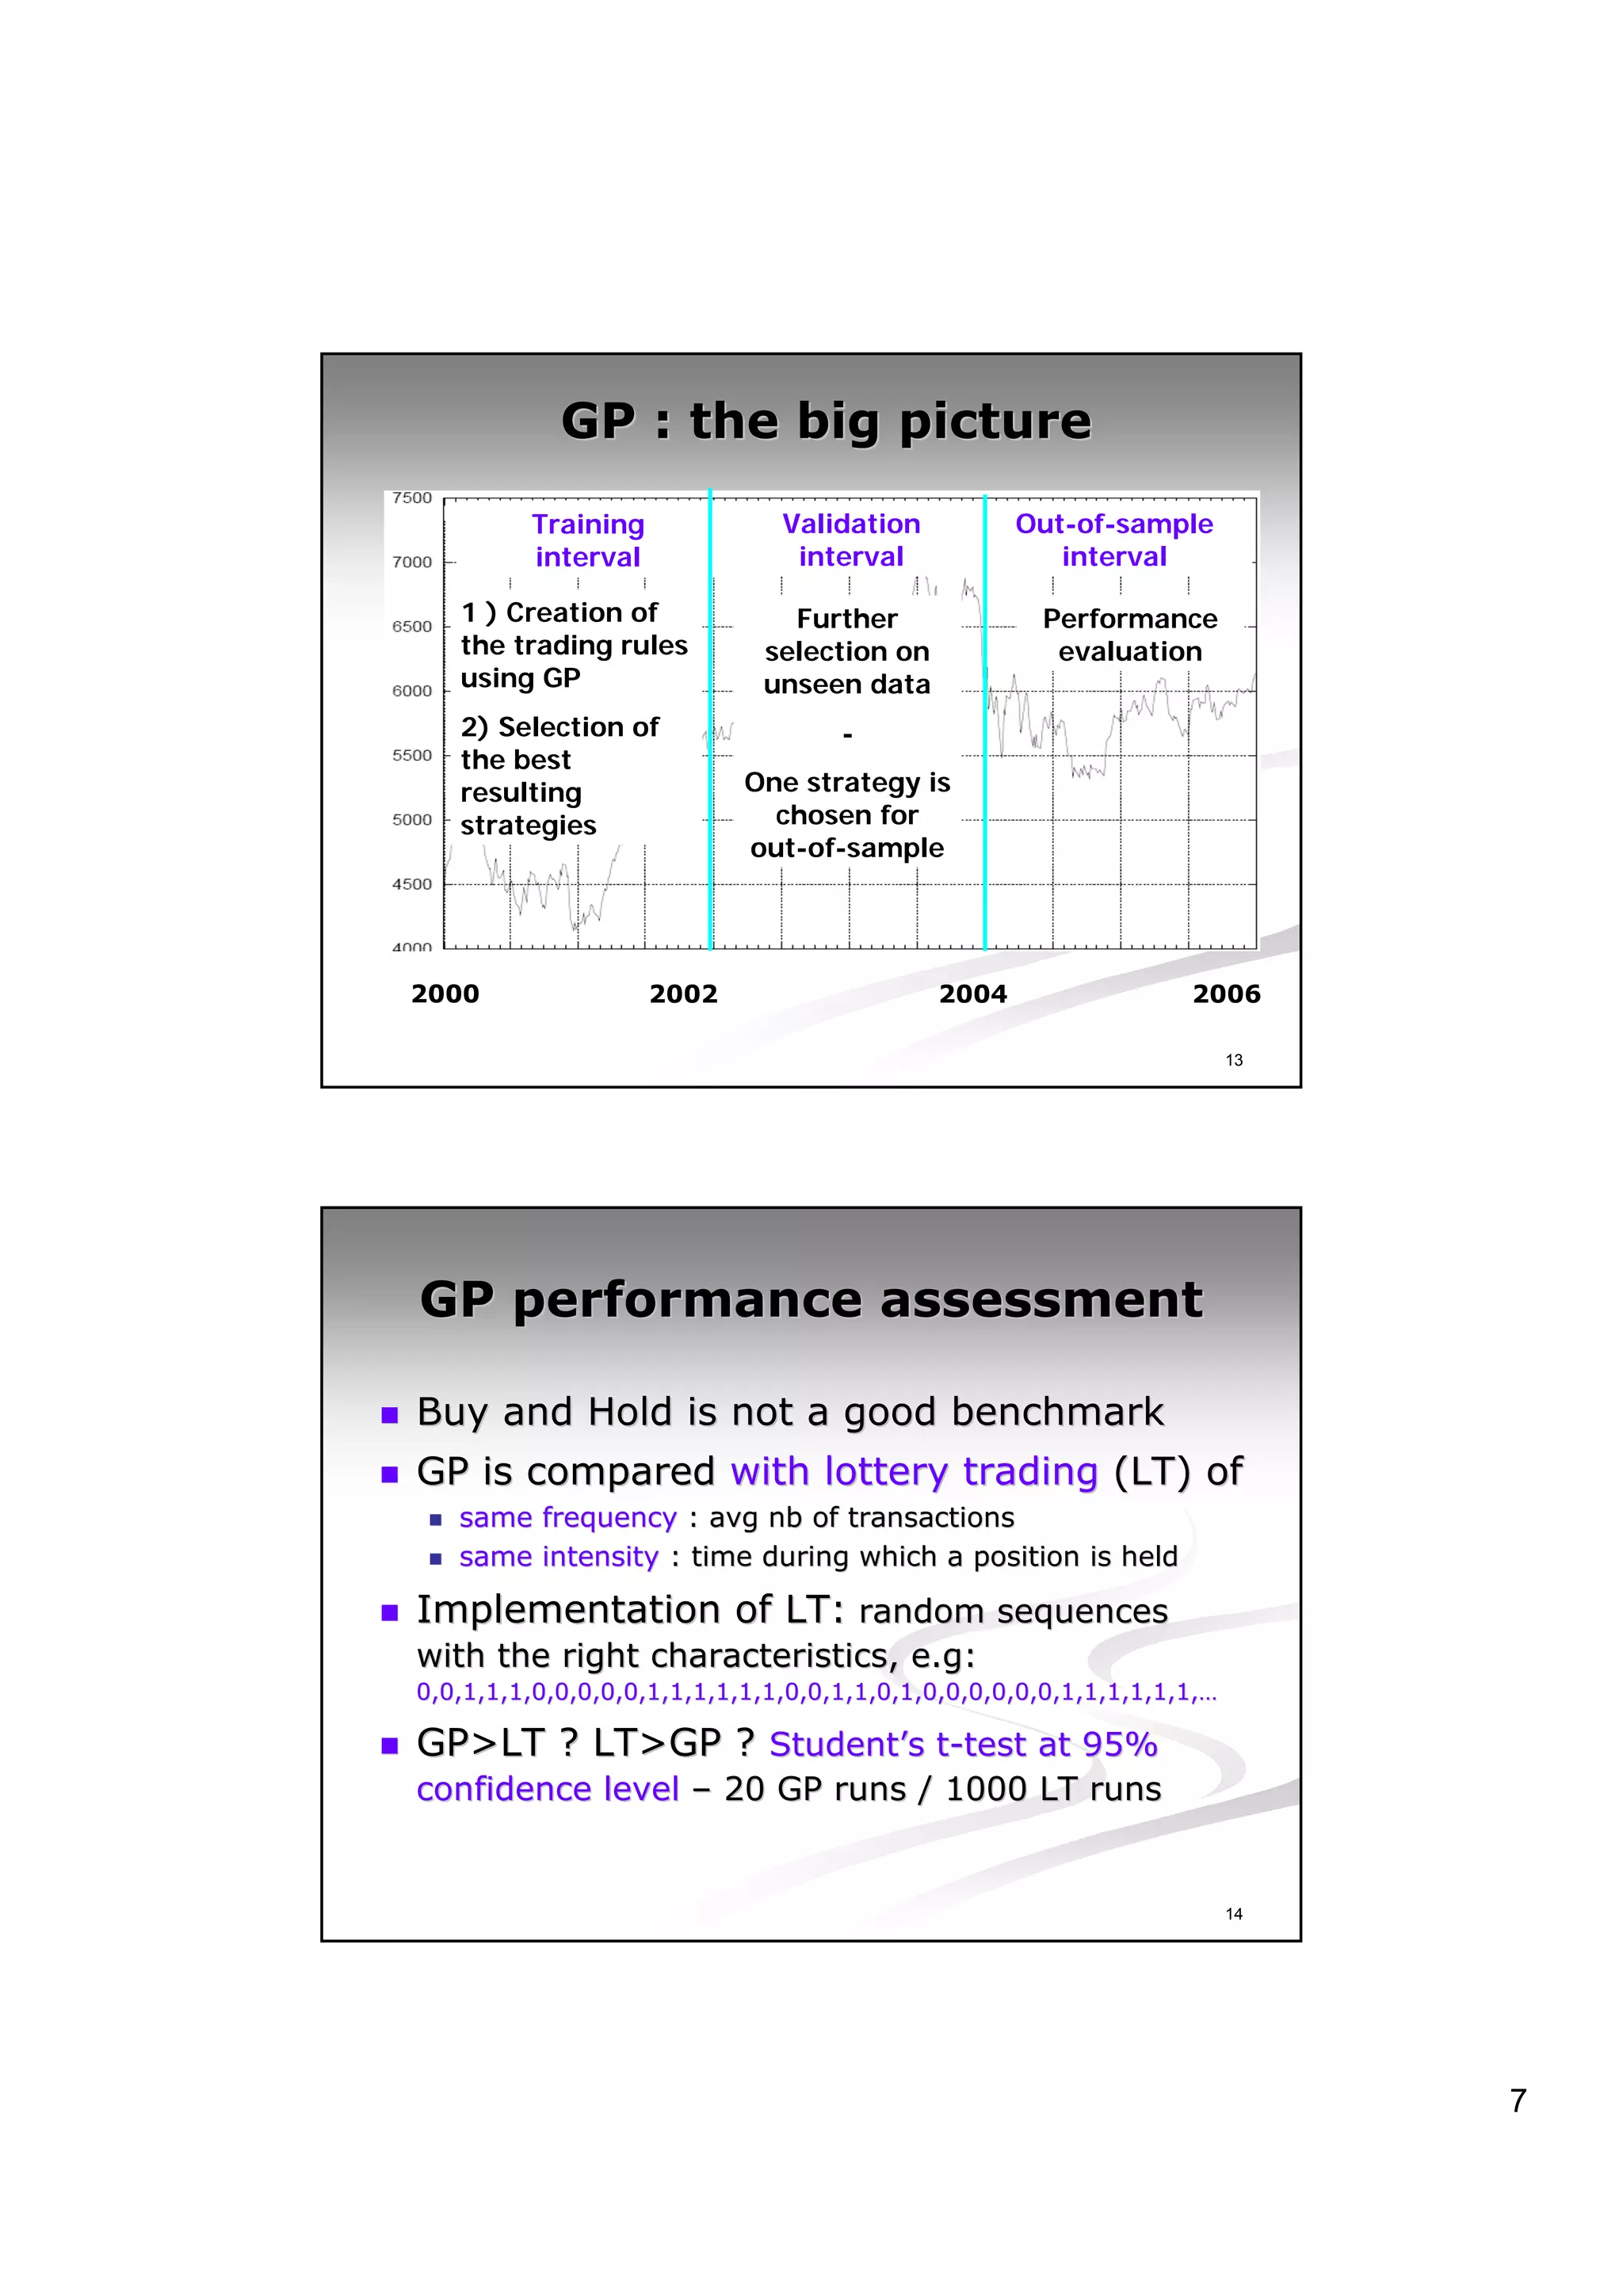
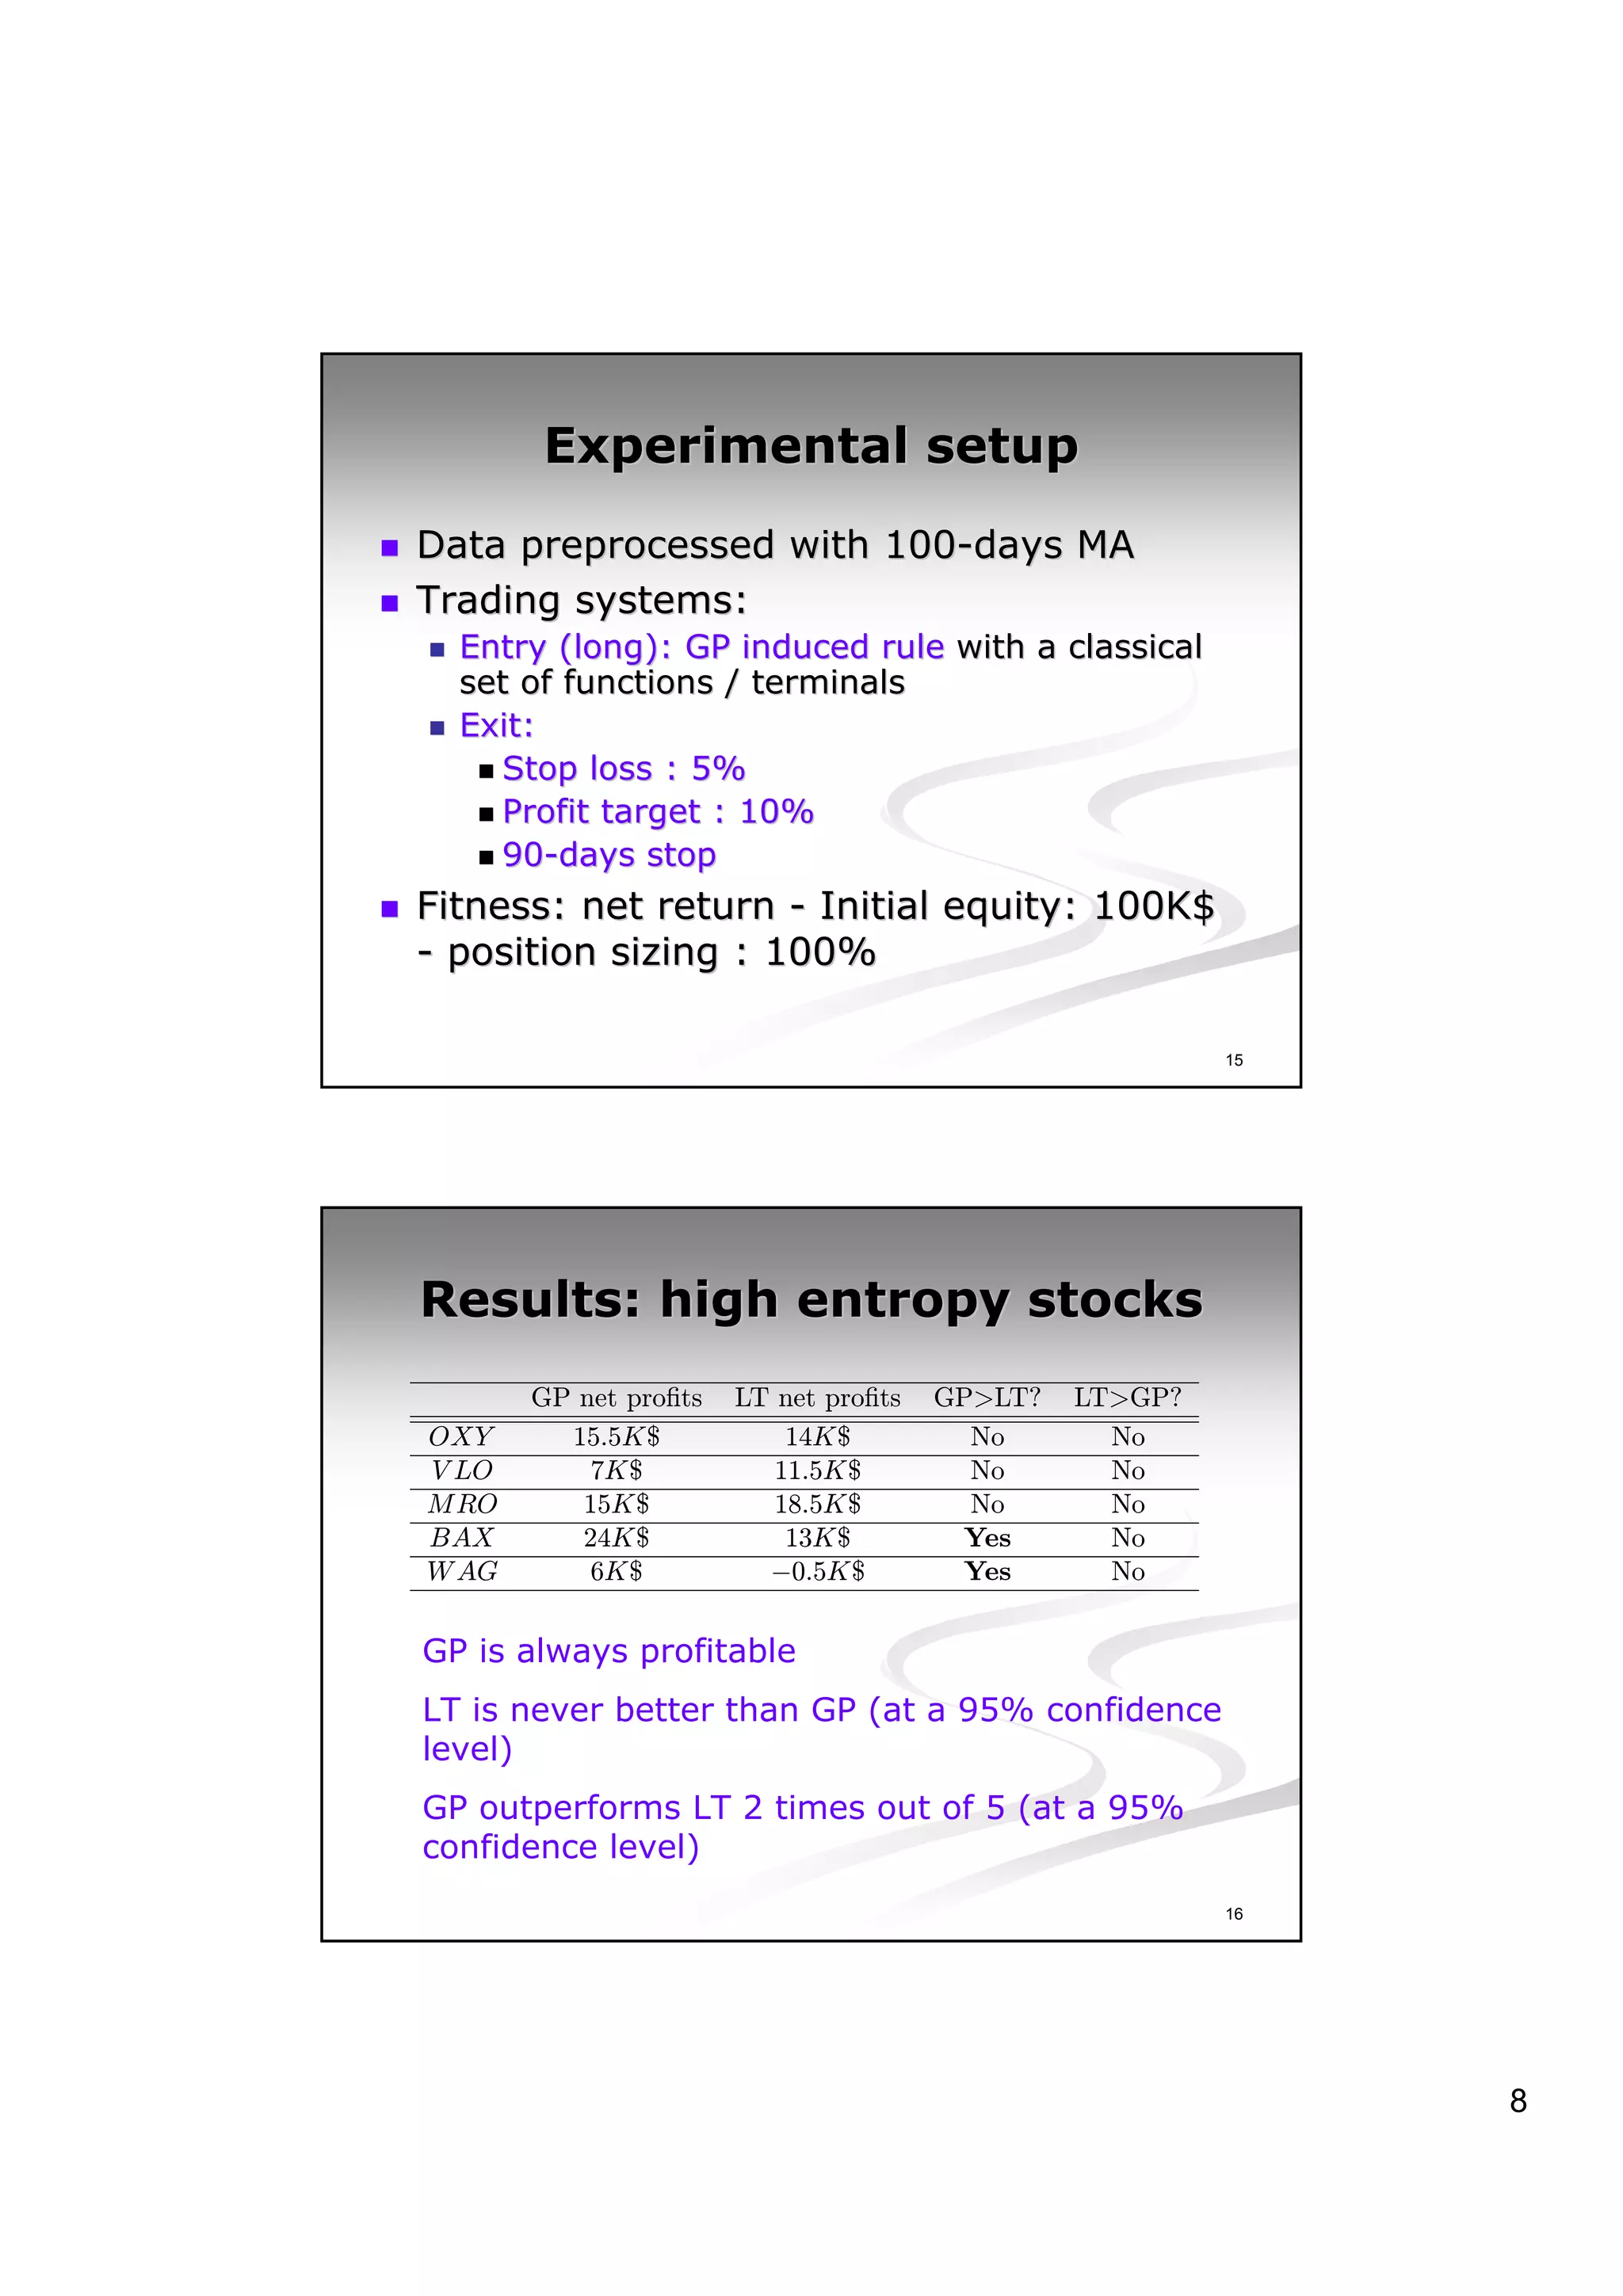
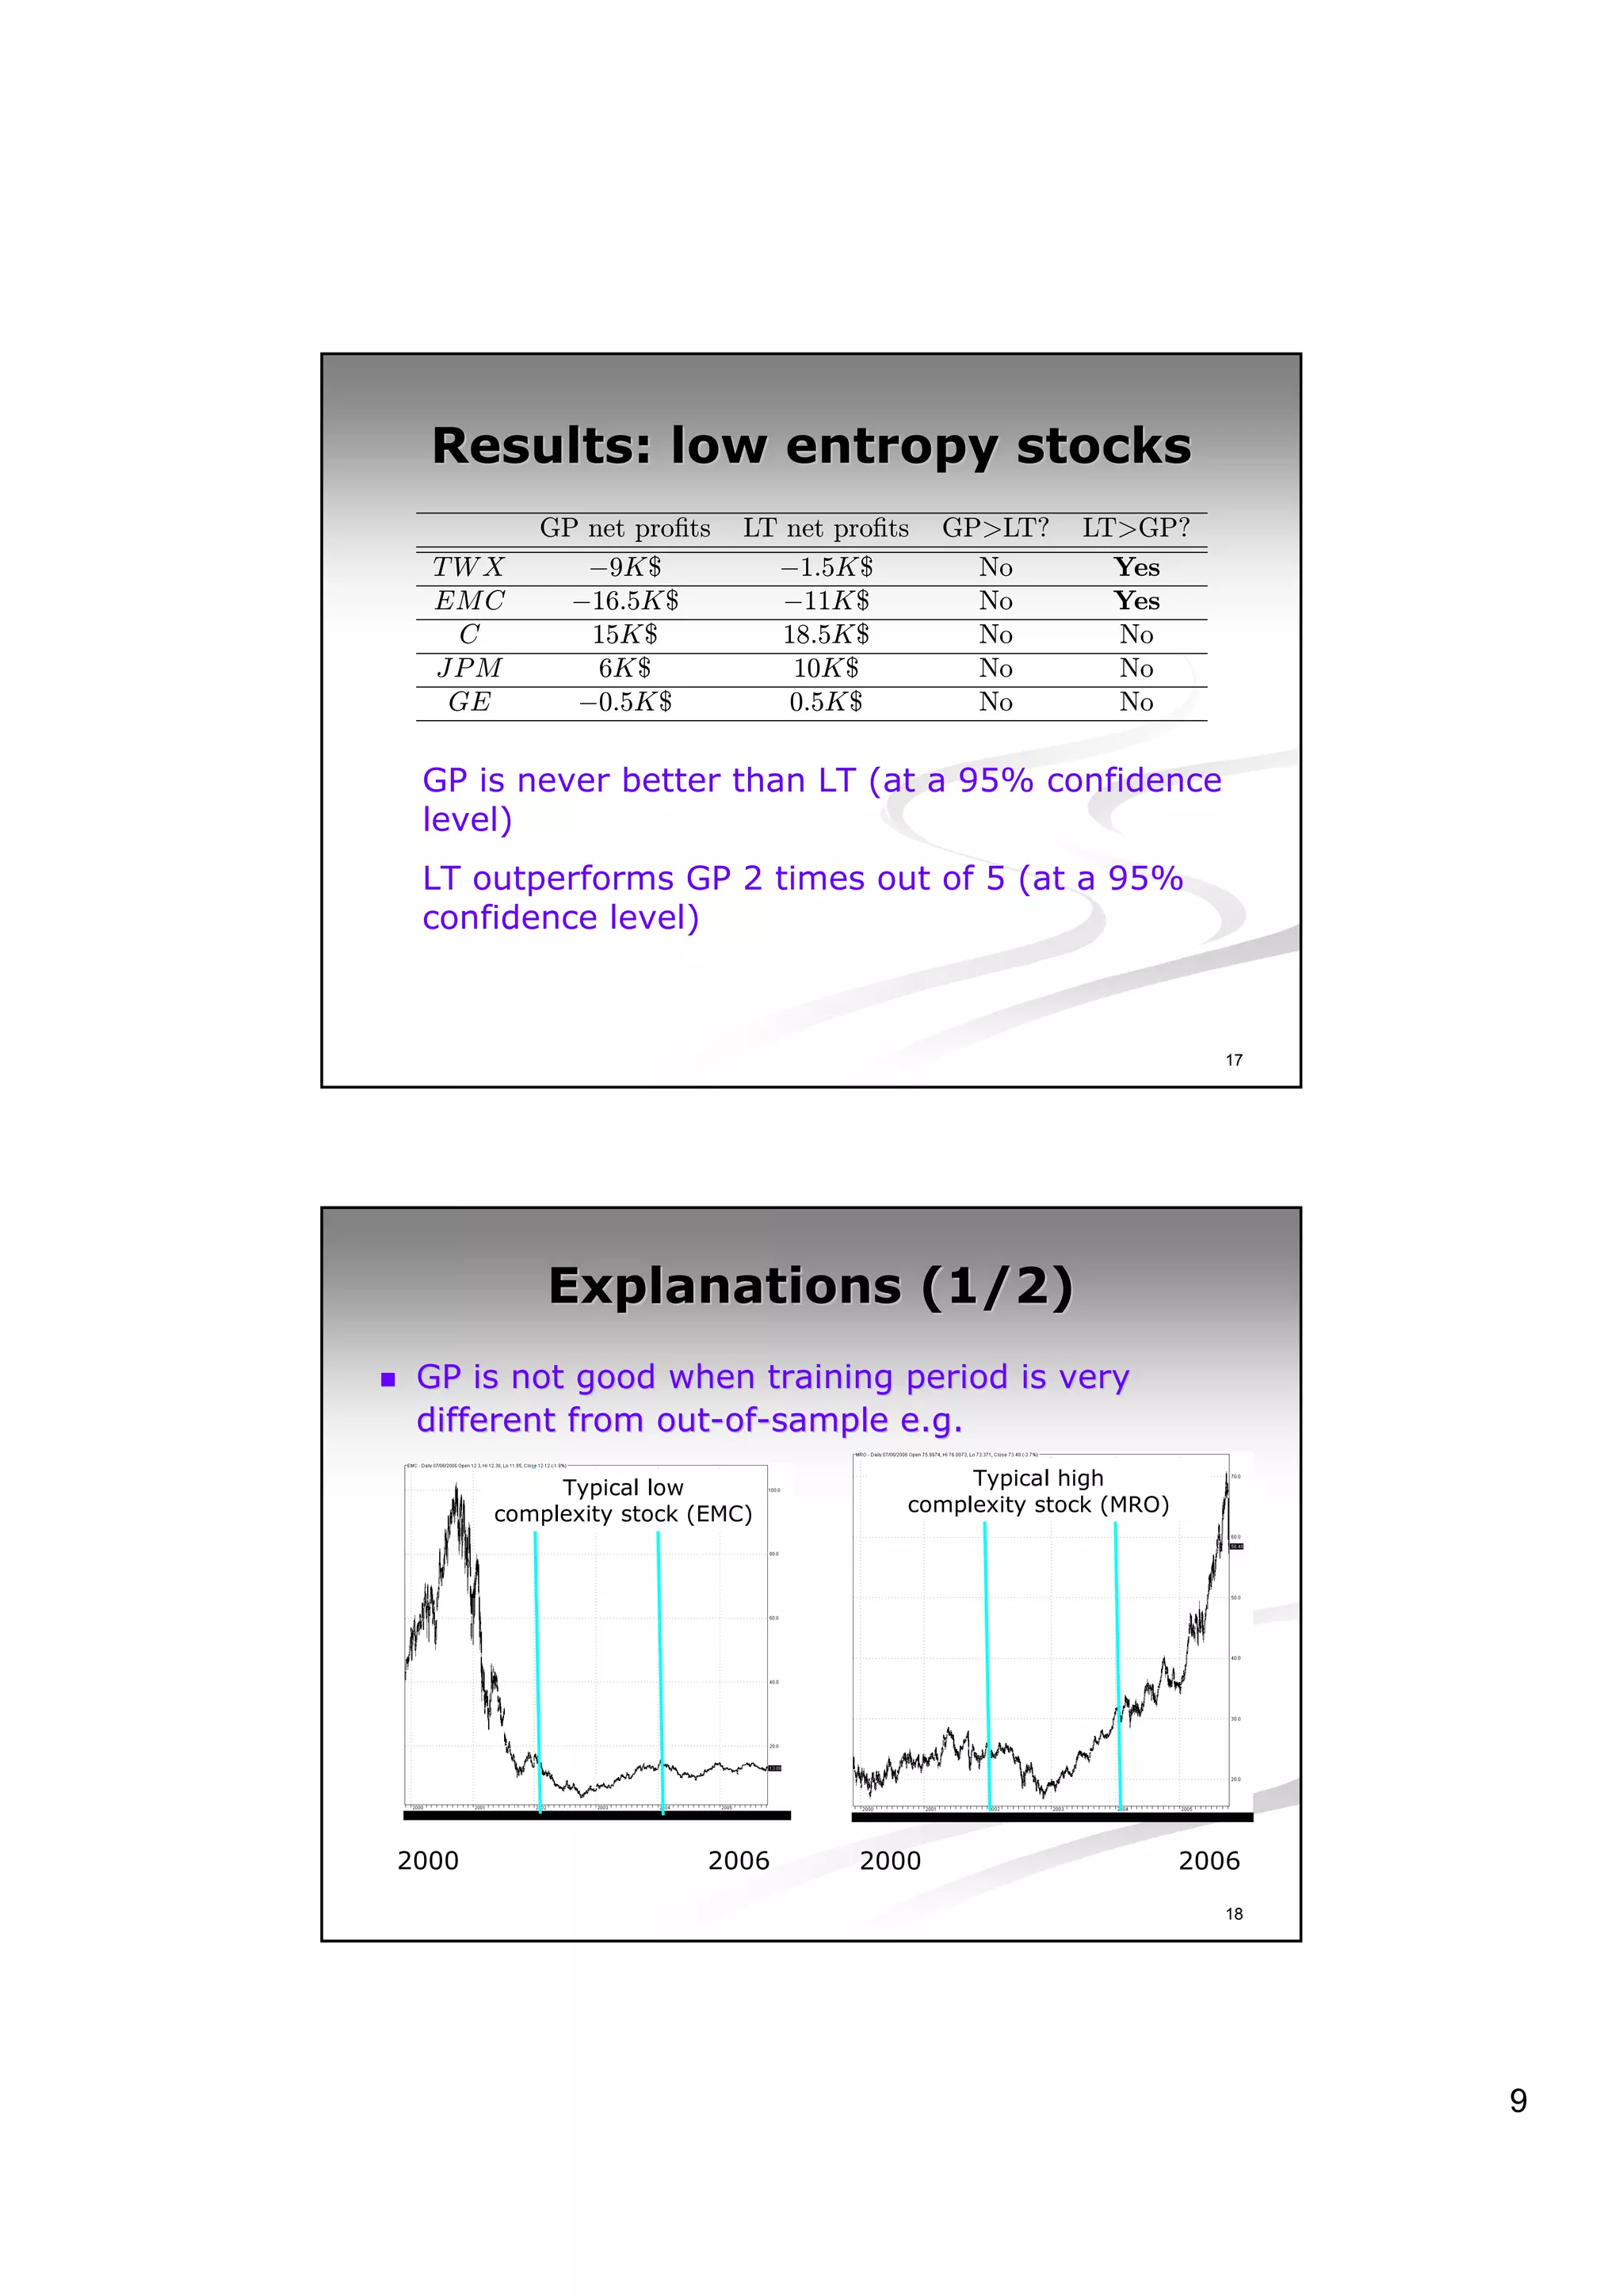
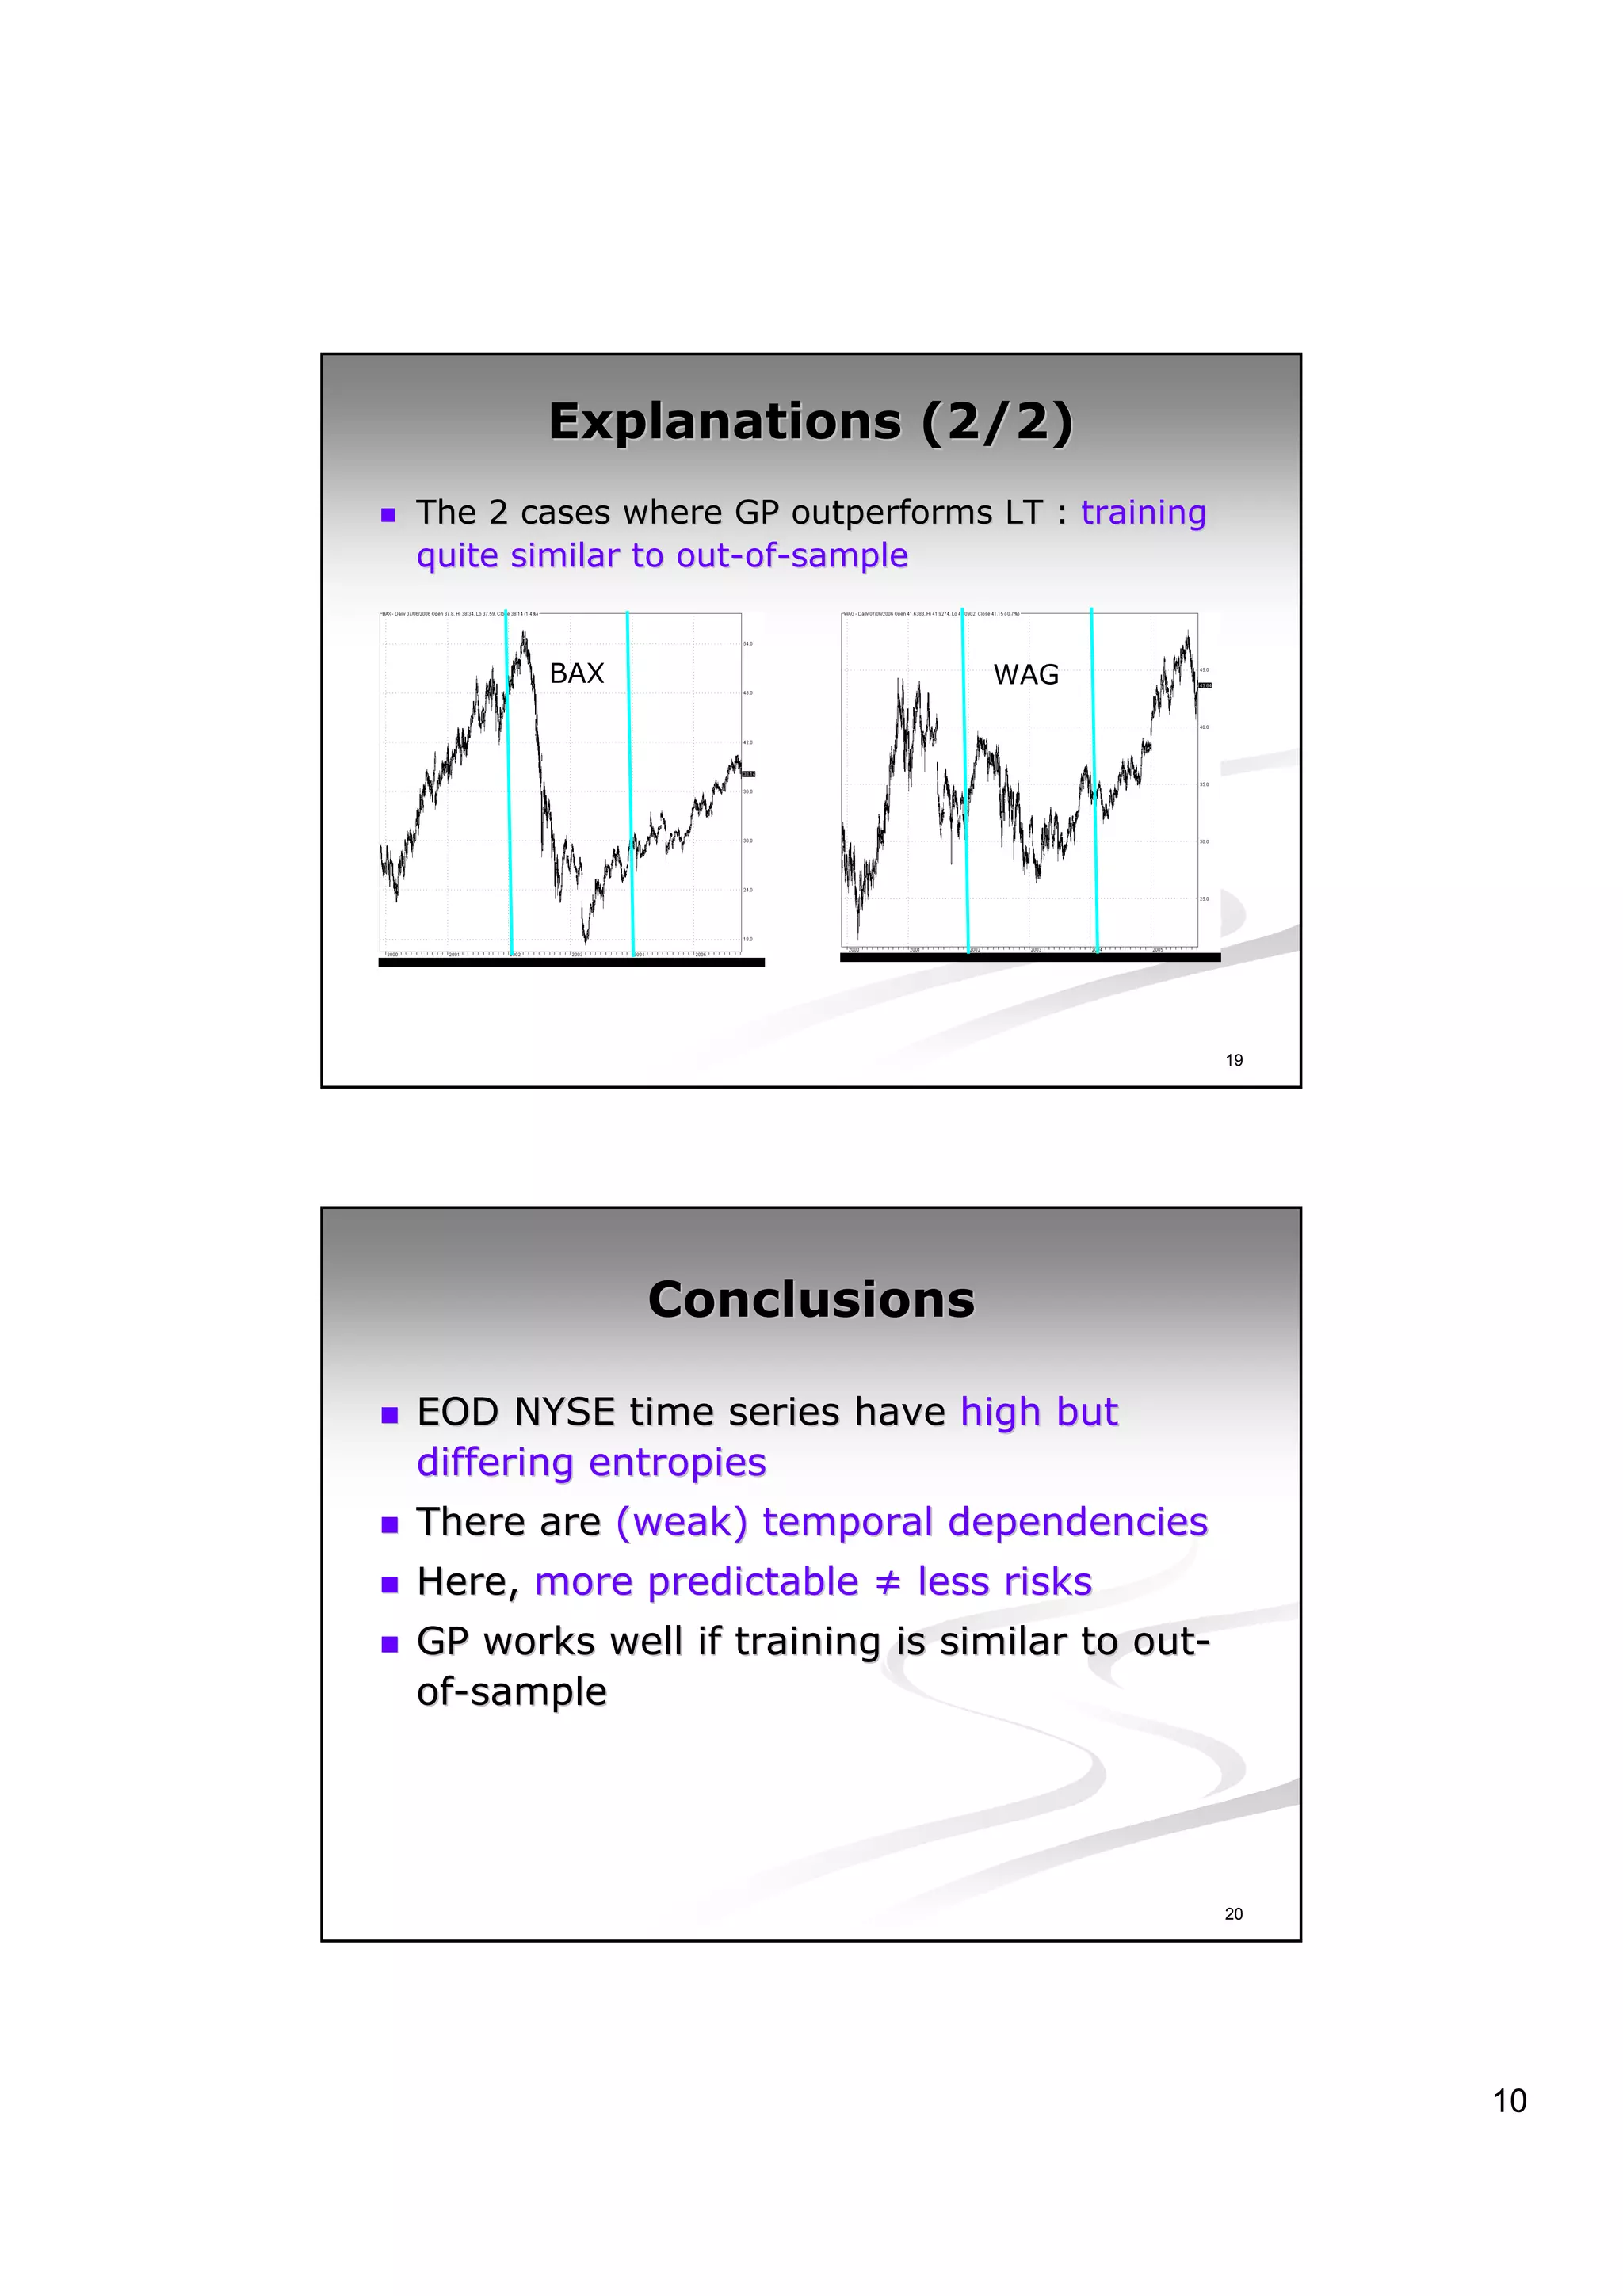

This document discusses experiments analyzing the entropy rates and profitability of technical analysis on NYSE US 100 stocks from 2000-2006. It finds that stocks have differing entropy rates ranging from 2.68-2.79 bits/character on average. Lower entropy stocks exhibited more autocorrelation. Genetic programming was used to generate trading rules and found that for high entropy stocks, generated rules did not consistently outperform random lottery trading, indicating technical analysis was not clearly profitable.