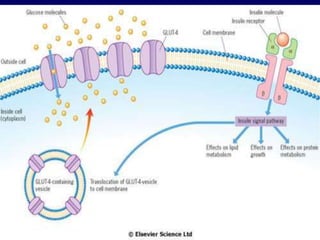
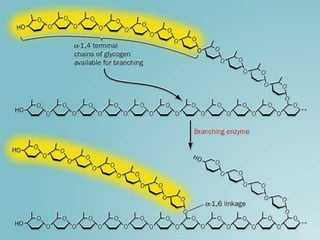
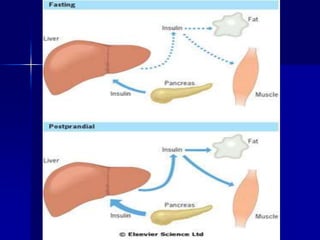
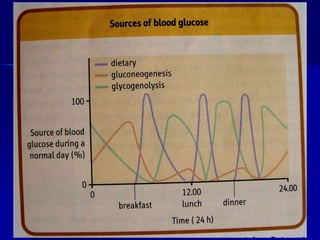
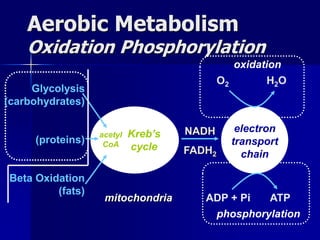
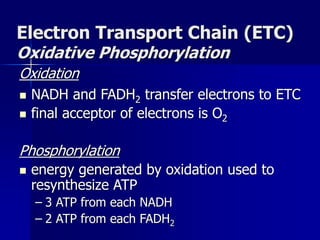
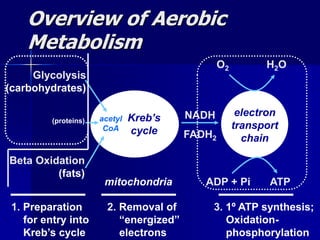
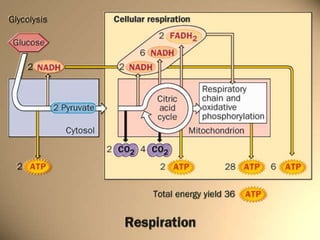
 Carbohydrates are the largest source of dietary
calories.
 The major cabohydrates are starch, lactose and
sucrose
 The main carbihydrates in body metabolism is
glucose
 transported to muscle (and other tissues) via blood
 stored in liver and muscle as glycogen
 ATP produced more quickly from CHO than from fats
or proteins
 CHO stores can be depleted
Carbohydrates (Fuels)
Digestion
 Starch digestion begins in mouth by the
salivary α-amylase which converts starch to
smaller polysaccharides called α-dextrins
 Pancreatic α-amylase continue the digestion of
α-dextrins into maltose, maltotriose &
oligosaccharides called limited dextrins
 Digestion of maltose, maltotriose, sucrose &
lactose continues by disaccharidases attached
to the membrane of surface of the brush
border (microvilli)of intestinal epithelial cells
 The monosaccharides produced are
transported by into the intestinal cells
Disaccharidases
 Glucoamylase : Glycoprotein
attached to the luminal
membrane with two catalytic
activities. An exoglucosidase
specific for α-1-4 glycosidic
bonds, acts at the non-reducing
ends of limited dextrins releasing
glucose up to isomaltose.
Disaccharidases
 Sucrase-Isomaltase Complex: Similar to
glusamylase attached to membrane with two
polypeptides protrudes into the intestinal lumina,
an intestinal protease clips it into two separate
subunits that remain attached to each other.
Each subunit site has a catalytic site that differs
in substrate specificity. The sucrose maltase site
accounts for 100% of intestinal ability to
hydrolyze sucrose in addition to maltase activity.
The isomaltase-maltase site accounts for almost
all activity to hydrolyze α 1-6 bonds in addition to
maltase activity.
Disaccharidases
 Trehalase: one catalytic site and
hydrolyzes the glycosidic bond in
trehalose (disaccharide of two glycosyl
units attached by their anomeric
carbons)
 Lactase-Glucosyl Ceramidase Complex:
glycoprotein found in the brush border
that has two calaytic sites extending in
the intestinal lumin. It hydrolyzes lactose
and the B-bonds betweeen glucose or
galactose and ceramide in glycolipids.
Dietary Fiber
 Composed principally of polysaccharides which
can not be digested by human enzymes of
intestinal tract
 Derivatives of lignan ( cellulose, hemicellulose,
lignin, pectin s, mucilages & gums)
 Bacterial flora of the colon metabolize the
fibers to gases(H2,CO2,CH4) & short chain fatty
acids
 Fatty acids are absorbed by colonic cells
 Fibers is seen to soften the stool, thereby
reducing pressure on colonic wall & enhancing
expulsion of feces
Absorption of carbohydrates
 Sugars are transported
across the intestinal
epithelial cells into the
blood
 Not all complex sugars
are digested in the
same rate within the
intestine
 Glycemic index of the
food is an indication of
how rapidly blood
glucose level rises after
consumption
Whole weat 100
pasta 67
cornflakes 121
potatoes 120
Ice cream 69
fruits 52
Glucose Absorption
 Two types of glucose transport
proteins are present in the intestinal
cells
– Na+ dependent: an active transport
which depends on cotransport of sodium
and glucose
– Facilitated : passive transport known as
Glut 1 -4
 Cell membranes are not inherently permeable to
glucose. There are many glucose transporters.
 GLUT- 1 enables basal non- insulin stimulated
glucose uptake (erythrocytes)
 GLUT- 2 transport glucose into beta cells, a pre-
requisite for glucose sensing.
 GLUT- 3 enables non- insulin mediated glucose
uptake into brain.
 GLUT- 4 enables much of the peripheral action of
insulin (muscles, adipose)
Glucose transporters
Glycogen Metabolism
Glycogenolysis
 Occurs mainly in liver & muscles
 Both pathways in the liver & muscle
are the same
 End product in liver is glucose, while in
muscle is glucose 6 phosphate
Glycogenesis
electron
transport
chain
Aerobic Metabolism
Oxidation Phosphorylation
Kreb’s
cycle
Glycolysis
(carbohydrates)
(proteins)
Beta Oxidation
(fats)
NADH
FADH2
O2 H2O
ADP + Pi ATP
acetyl
CoA
mitochondria
oxidation
phosphorylation
 uses only CHO
 occurs in sarcoplasm
 first step is glucose transport into tissues
 after entry, 2 ATP are used (with glucose)
 glucose (C6) is split into two C3 molecules
 final product is pyruvate
 4 ATP are synthesized
 pyruvate forms either lactate or enters
mitochondria
Glycolysis
glucose
ATP
ATP
PFK
4 ATP
pyruvate
lactate acetyl CoA
mitochondria
glycogenolysis
sarcolemma
blood
glycolysis
Overview of Glycolysis
Glycolysis
Electron Transport Chain (ETC)
Oxidative Phosphorylation
Oxidation
 NADH and FADH2 transfer electrons to ETC
 final acceptor of electrons is O2
Phosphorylation
 energy generated by oxidation used to
resynthesize ATP
– 3 ATP from each NADH
– 2 ATP from each FADH2
1,3 DPG
2,3 DPG mutase
2,3 DPG
2,3 DPG phosphatase
2-PG
2,3 DPG synthesis & degradation
ADP
ATP
Regulation of Glycolysis
Hexokinase
 Tissue specific isoenzyme, low Km
value, inhibited by G-6-P, in
muscles, brain, RBC and adipose
tissue.
 Liver isoenzyme (glucokinase) has
high Km value, not inhibited by G-
6-P
Phosphofructokinase(PFK-1)
 Allosteric enzyme, catalyze rate
limiting step
 Has six binding sites
– 2 for substrates (ATP & F-6-P)
– 4 allosteric regulatory sites
 ATP & Citrates are inhibitors
 AMP & F2,6bp are stimulatory
PFK-2
 Not glycolytic enzyme, synthesizes F-2,6 bp,
has two domains, a kinase & phosphatase
 In skeletal muscles, F-6-P activates the kinase
domain and this increases F2-6-bp
concentration
 In liver, PFK-2 regulated by phosphorylation,
which when near amino terminal decreases the
activity of kinase & increases activity of
phosphatase (CAMP)
 Cardiac isoenzyme, phosphorylation near the
carboxylic terminal in response to adrenergic
activator or AMP increases the kinase activity
Pyruvate Kinase
 Tissue specific isoenzyme
 Brain & muscle contains no allosteric
site and thus do not contribute toward
regulation of glycolysis.
 In liver, it is regulated by
phosphorylation & dephosphorylation
by CAMP-dependent kinases. It is also
inhibited by allosteric regulators (F-1-
6bp & ATP).
Lactate Dehydrogenase
 Tetramer composed of A-subunits (M-
skeletal) and also B subunits (H-heart).
 Different tissues produce different
amounts of the two subunits (M4, M3H
……….H4)
 M4 facilitates conversion of pyruvate into
lactate in skeletal muscles
 M4 facilitates conversion of lactate into
pyruvate in the heart.
 lactate formation
 enters mitochondria (i.e. Kreb’s cycle)
 formation of Kreb’s cycle intermediates
Pyruvate goes in one of three directions
Metabolic Fate of Pyruvate
 primary function is to reduce NAD+ and FAD
 acetyl CoA (C2) combines with a C4
molecule forming a C6 molecule
 C6 molecule is partially degraded back to a
C4 molecule
 each loss of C gives off a CO2
Kreb’s Cycle
(Citric Acid Cycle)
Regulation of TCA Cycle
Citrate Synthetase
Has no alosteric regulators
Oxaloacetate concentration
activates the enzyme
Citrate concentration
inhibits the enzyme
Isocitrate Dehydrogenase
 Rate limiting step
 Allosteric, activated by ADP & inhibited
by NADH
 Binding of ADP to one subunit causes
the activation of other subunits
(positive cooperativity)
 Binding of ADP shift Km to a lower
value
 Small change in ADP brings about
large change in the rate.
α-ketoglutrate Dehydrogenase
 No allosteric regulators
 Product inhibition by NADH and
succinyl CoA
 It may also be inhibited by GTP
 In contracting heart muscle, the
release of Ca2+ may provide activation
of both enzymes when ATP is rapidly
hydrolyzed.
NADH
 Plays a central role in Regulation
 Rate of oxidation of NADH depends
on oxidative phosphorylation
 It inhibits all dehydrogenases in TCA
& pyruvate dehydrogenase and thus
regulates entry point of acetyl CoA
electron
transport
chain
Overview of Aerobic
Metabolism
Kreb’s
cycle
(proteins)
NADH
FADH2
O2 H2O
ADP + Pi ATP
acetyl
CoA
1. Preparation
for entry into
Kreb’s cycle
2. Removal of
“energized”
electrons
3. 1º ATP synthesis;
Oxidation-
phosphorylation
mitochondria
Beta Oxidation
(fats)
Glycolysis
(carbohydrates)
Gluconeogenesis
 Sites include liver & kidney while
substrates include, amino acids,
lactate, pyruvate, glycerol.
 Cori & alanine cycles for transport of
intermediates between site of
production of these metabolites and
site of synthesis.
 Many enzymes of glycolysis are
common to gluconeogenesis.
Gluconeogenesis(1)
 Irrversible enzymes of glycolysis are
replaced by gluconeogenesis
enzymes.
1. Pyruvate kinase – pyruvate
carboxylase & PEPCK
2. PFK ---- F 2,6 diphosphatase
3. Glucokinase --- Glu 6 phosphatase
Gluconeogenesis(2)
Gluconeogenesis - Bypass Enzymes
Glucose
oxaloacetate
Glucose-6-Phosphate
Fructose-6-Phosphate
Fructose 1,6 Bisphosphate
DHAP + Glyceraldehyde-3-P
Glyceraldehyde-3-P
Pyruvate
PEP
2-Phosphoglycerate
3-Phosphoglycerate
1,3-BPG
Gluconeogenesis - Bypass Enzymes
pyruvate + CO2 + ATP + H2O  oxaloacetate + ADP,Pi + 2H+
oxaloacetate + GTP  PEP + GDP + CO2
10. Pyruvate carboxylase & PEP carboxykinase
(+) acetylCoA & (-) ADP
3.Fructose 1,6-bisphosphatase
(-) fructose 2,6-bisphosphate (low fasting – high Fed)
(-) AMP
fructose 1,6 bisphosphate + H2O  fructose 6-phosphate + Pi
1. Glucose 6-phosphatase
glucose 6-phosphate + H2O  glucose + Pi
GLUCONEOGENESIS-Liver
2Pyruvate + 4ATP + 2NADH
2GTP
Glucose + 4ADP + 2NAD+
2GDP
to blood
 Galactose metabolism occurs in liver.
 Galactose UDP-galactose
GK
Uridyl transferase
UDP- glucose
Galactose metabolism
 Occurs in liver & adipose tissue
 Fructose Fructose 6 phos
fructokinase
Glucose 6 phos
Fructose metabolism
 The plasma glucose concentration reflects the
balance between intake, tissue utilization &
endogeneous production .
 Insulin promotes up take of glucose thus decreasing
plasma glucose while glucagon stimulates both the
release of glucose from glycogen stores & its denovo
synthesis, thus causing an increase in plasma
glucose.
 Glucose stimulates the secretion of insulin &
suppresses the secretion of glucagon.
Glucose Homeostasis
 Insulin acts on three main targets, liver, adipose &
muscles.
 In liver insulin stimulates, glycolysis, glycogenesis &
lipogenesis & suppresses lipolysis.
 In peripheral tissues, insulin induces lipoprotein
lipase activity & thus stimulates triglyceride synthesis.
 In muscles, insulin increases glucose & amino acid
transport & glycogen synthesis.
Metabolic effects of insulin
 Glucagon main effect is the mobilization of the fuel
reserves for the maintenance of the blood glucose
level between meals.
 Glucagon inhibits glucose- utilizing pathways and the
storage of metabolic fuels.
 It acts on liver, to stimulate glycogenolysis and inhibit
glycogenesis, glycolysis and lipogenesis.
 Gluconeogenesis and ketogenesis are then activated
 Epinephrine has effects similar to glucagon in the
liver but works through a different receptor. It
promotes an increase in blood glucose in response to
stress
Metabolic effects of Glucagon
 The glucose level in the vicinity of the B- cell is
sensed by the transporter GLUT- 2. Glucose is carried
into the cell, where it is phophorylated into G-6- P by
glucokinase which also is a part of the glucose
sensing mechanism. Increased G-6- P increases
glucose utilization and ATP production in the B- cell.
This changes the flux of ions across the cell
membrane, depolarizes the cell and increases the
concentration of Ca2+. Hence insulin is exocytosed.
 Insulin secretion is biphasic. The first phase occurs
over 10- 15 minutes of stimulation which release the
preformed insulin. The second phase, which lasts up
to 2 hours, is the release of newly synthesized
insulin.
Stimulation of insulin secretion by glucose
 Insulin secretion is also stimulated by gastrointestinal
hormones (insulinotropic peptide, cholecystokinin)
and amino acids, such as leucine, arginine, and
lysine. Thus, the insulin response to orally
administered glucose is greater than to an
intravenous infusion.
Stimulation of insulin secretion by glucose
 Hypoglycemia is defined as a blood glucose
concentration below 2.5 mmol/ L ( 45 mg/dl).
 Epinephrine and glucagon are released, resulting in a
stress response, the manifestation of which may
include sweating, trembling, increased heart rate and
feeling of hunger. If blood glucose continues to fall,
brain function is compromised (neuroglycopenia).
 Hypoglycemia in healthy individuals is usually mild
and may occur during exercise, after a period of
fasting or due to alcohol ingestion.
 Hypoglycemia may be caused by a rare insulin
secreting tumor of the beta- cells ( insulinoma) or
overdose of exogenous insulin.
Hypoglycemia
 Alcohol is metabolized primarily in the liver. Two steps
metabolism of alcohol is relatively unregulated, leading
to a rapid increase in hepatic NADH. This shifts the
equilibrium of LDH catalyzed reaction towards lactate
formation ( lacticacidemia). Also shifts cytosolic
oxaloacetate towards malate formation, reducing
gluconeogenesis from TCA. In addition DHAP is shifted
toward glycerol- 3- phosphate formation and thus
reducing gluconeogenesis from glycerol.
 The low blood glucose leads to a stress response (
rapid heart beat, clammy skin), an effort to enhance
stimulation of gluconeogenesis combined action of
glucagon and epinephrine. Rapid breathing is
physiological response to metabolic acidosis.
Alcohol Excess and Hypoglycemia 2
 Maintaining near normal blood glucose levels
prevents the development of late complications of
diabetes. A recently completed landmark clinical
study, the Diabetes Control Complications trial , has
shown that the development of late complications of
diabetes in type I diabetes is related to long term
glycemia. This study has also shown that in patients
who have complications, good control of glycemic
delays further development of retinopathy,
nephropathy and neuropathy. Similar results were
obtained for type 2 diabetic patients during the UK
Prospective Diabetes Study completed in 1998. Thus
the aim of treatment of diabetes should be the
achievement of blood levels as close to normal as
possible, without precipitating hypoglycemia.
The importance of good glycemic control
 The entry of glucose into brain, peripheral nerve
tissue, kidney, intestine, lens and RBC does not
depend on insulin action.
 During hyperglycemia, the intracellular level of
glucose in these cells is high, which promotes the
non- enzymatic attachment of glucose to protein
molecules.
 Glycation involves glucose and alpha- amino terminal
amino acid and ε- amino groups of lysine residues.
 Hemoglobin, albumin and collagen become glycated
which effects their function.
 For instance, glycation of apolipoprotein B slows
down the rate of receptor dependent metabolism of
LDL.
Protein modification by glucose
 The measurement of blood glucose remains the most
important laboratory test in diabetes.
 As erythrocytes age, there is gradual conversion of a
fraction of native hemoglobin ( HbA) to its glycated
form, HbA1C, so that an older red cell, a greater
fraction of HbA exist as HbA1C.
 HbA1C concentration in blood reflects the time –
averaged level of glycemia over the 3-6 weeks
preceding the measurement.
 The normal concentration of HbA1C is 4-6% of HbA.
Levels below 7% indicate acceptable control of
diabetes. Higher levels suggest poor control.
Glycated Hemoglobin (HbA1C)
0
50
100
150
200
250
6 7 8 9 10 11 12 13
MBG
 Glucose can be reduced to sorbitol by the action of aldose
reductase. Sorbitol is further oxidized by sorbitol
dehydrogenase to fructose. Since aldose reductase has a
high Km for glucose, the pathway is not very active at
normal glucose level.
 In hyperglycemia, however, glucose levels in insulin
independent tissues, such as the RBC, nerve and lens,
increase and consequently there is an increase in the activity
of the polyol pathway with depletion of NADPH.
 Like glucose, sorbitol exerts an osmotic effect. This is
thought to play a role in the development of diabetic
cataracts.
 In addition, the high level of sorbitol decreases cellular
uptake of another alcohol, myoinositol, which in turn causes
a decrease in the activity of membrane Na+/ K+ ATPase. This
in turn effects nerve function and, along with hypoxia and
reduced nerve blood, contributes to the development of
diabetic neuropathy. Drugs inhibiting aldose reductase
improve nerve function in diabetes.
The Polyol Pathway
 Comments: A number of drugs, particularly primaquine
and related antimalarials, undergo reactions in the cell,
producing large quantities of superoxide and H2O2.
Superoxide dismutase converts superoxide into H2O2,
which is inactivated by glutathione peroxidase using
NADPH. Some persons have genetic defect in G6PD,
typically yielding an unstable enzyme that has a
shorter life in the RBC. Therefore insufficient
production of NADPH under stress, the cell ability to
recycle GSSG to GSH is impaired and drug induced
oxidative stress leads to lysis of RBC’s and hemolytic
anemia. If the hemolysis is severe enough Hb spills
over into the urine, resulting in hematuria and dark
colored urine. Older cells, which can’t synthesize and
replace their enzyme are therefore particularly
affected. Genetically the deficiency is X- linked. Favism
is associated with G6PD deficiency.
Glucose 6 phosphate dehydrogenase deficiency 2
0
0.5
1
1.5
2
2.5
3
3.5
4
4.5
5
ATP ADP AMP
Rest
Exercise
Changes in ATP, ADP, and AMP concentrations in skeletal muscle

CHO metabolism MDBC803.ppt

  • 1.
     Carbohydrates arethe largest source of dietary calories.  The major cabohydrates are starch, lactose and sucrose  The main carbihydrates in body metabolism is glucose  transported to muscle (and other tissues) via blood  stored in liver and muscle as glycogen  ATP produced more quickly from CHO than from fats or proteins  CHO stores can be depleted Carbohydrates (Fuels)
  • 2.
    Digestion  Starch digestionbegins in mouth by the salivary α-amylase which converts starch to smaller polysaccharides called α-dextrins  Pancreatic α-amylase continue the digestion of α-dextrins into maltose, maltotriose & oligosaccharides called limited dextrins  Digestion of maltose, maltotriose, sucrose & lactose continues by disaccharidases attached to the membrane of surface of the brush border (microvilli)of intestinal epithelial cells  The monosaccharides produced are transported by into the intestinal cells
  • 3.
    Disaccharidases  Glucoamylase :Glycoprotein attached to the luminal membrane with two catalytic activities. An exoglucosidase specific for α-1-4 glycosidic bonds, acts at the non-reducing ends of limited dextrins releasing glucose up to isomaltose.
  • 4.
    Disaccharidases  Sucrase-Isomaltase Complex:Similar to glusamylase attached to membrane with two polypeptides protrudes into the intestinal lumina, an intestinal protease clips it into two separate subunits that remain attached to each other. Each subunit site has a catalytic site that differs in substrate specificity. The sucrose maltase site accounts for 100% of intestinal ability to hydrolyze sucrose in addition to maltase activity. The isomaltase-maltase site accounts for almost all activity to hydrolyze α 1-6 bonds in addition to maltase activity.
  • 5.
    Disaccharidases  Trehalase: onecatalytic site and hydrolyzes the glycosidic bond in trehalose (disaccharide of two glycosyl units attached by their anomeric carbons)  Lactase-Glucosyl Ceramidase Complex: glycoprotein found in the brush border that has two calaytic sites extending in the intestinal lumin. It hydrolyzes lactose and the B-bonds betweeen glucose or galactose and ceramide in glycolipids.
  • 6.
    Dietary Fiber  Composedprincipally of polysaccharides which can not be digested by human enzymes of intestinal tract  Derivatives of lignan ( cellulose, hemicellulose, lignin, pectin s, mucilages & gums)  Bacterial flora of the colon metabolize the fibers to gases(H2,CO2,CH4) & short chain fatty acids  Fatty acids are absorbed by colonic cells  Fibers is seen to soften the stool, thereby reducing pressure on colonic wall & enhancing expulsion of feces
  • 7.
    Absorption of carbohydrates Sugars are transported across the intestinal epithelial cells into the blood  Not all complex sugars are digested in the same rate within the intestine  Glycemic index of the food is an indication of how rapidly blood glucose level rises after consumption Whole weat 100 pasta 67 cornflakes 121 potatoes 120 Ice cream 69 fruits 52
  • 8.
    Glucose Absorption  Twotypes of glucose transport proteins are present in the intestinal cells – Na+ dependent: an active transport which depends on cotransport of sodium and glucose – Facilitated : passive transport known as Glut 1 -4
  • 9.
     Cell membranesare not inherently permeable to glucose. There are many glucose transporters.  GLUT- 1 enables basal non- insulin stimulated glucose uptake (erythrocytes)  GLUT- 2 transport glucose into beta cells, a pre- requisite for glucose sensing.  GLUT- 3 enables non- insulin mediated glucose uptake into brain.  GLUT- 4 enables much of the peripheral action of insulin (muscles, adipose) Glucose transporters
  • 11.
  • 13.
    Glycogenolysis  Occurs mainlyin liver & muscles  Both pathways in the liver & muscle are the same  End product in liver is glucose, while in muscle is glucose 6 phosphate
  • 16.
  • 21.
    electron transport chain Aerobic Metabolism Oxidation Phosphorylation Kreb’s cycle Glycolysis (carbohydrates) (proteins) BetaOxidation (fats) NADH FADH2 O2 H2O ADP + Pi ATP acetyl CoA mitochondria oxidation phosphorylation
  • 23.
     uses onlyCHO  occurs in sarcoplasm  first step is glucose transport into tissues  after entry, 2 ATP are used (with glucose)  glucose (C6) is split into two C3 molecules  final product is pyruvate  4 ATP are synthesized  pyruvate forms either lactate or enters mitochondria Glycolysis
  • 24.
    glucose ATP ATP PFK 4 ATP pyruvate lactate acetylCoA mitochondria glycogenolysis sarcolemma blood glycolysis Overview of Glycolysis
  • 25.
  • 27.
    Electron Transport Chain(ETC) Oxidative Phosphorylation Oxidation  NADH and FADH2 transfer electrons to ETC  final acceptor of electrons is O2 Phosphorylation  energy generated by oxidation used to resynthesize ATP – 3 ATP from each NADH – 2 ATP from each FADH2
  • 28.
    1,3 DPG 2,3 DPGmutase 2,3 DPG 2,3 DPG phosphatase 2-PG 2,3 DPG synthesis & degradation ADP ATP
  • 29.
  • 30.
    Hexokinase  Tissue specificisoenzyme, low Km value, inhibited by G-6-P, in muscles, brain, RBC and adipose tissue.  Liver isoenzyme (glucokinase) has high Km value, not inhibited by G- 6-P
  • 33.
    Phosphofructokinase(PFK-1)  Allosteric enzyme,catalyze rate limiting step  Has six binding sites – 2 for substrates (ATP & F-6-P) – 4 allosteric regulatory sites  ATP & Citrates are inhibitors  AMP & F2,6bp are stimulatory
  • 34.
    PFK-2  Not glycolyticenzyme, synthesizes F-2,6 bp, has two domains, a kinase & phosphatase  In skeletal muscles, F-6-P activates the kinase domain and this increases F2-6-bp concentration  In liver, PFK-2 regulated by phosphorylation, which when near amino terminal decreases the activity of kinase & increases activity of phosphatase (CAMP)  Cardiac isoenzyme, phosphorylation near the carboxylic terminal in response to adrenergic activator or AMP increases the kinase activity
  • 37.
    Pyruvate Kinase  Tissuespecific isoenzyme  Brain & muscle contains no allosteric site and thus do not contribute toward regulation of glycolysis.  In liver, it is regulated by phosphorylation & dephosphorylation by CAMP-dependent kinases. It is also inhibited by allosteric regulators (F-1- 6bp & ATP).
  • 38.
    Lactate Dehydrogenase  Tetramercomposed of A-subunits (M- skeletal) and also B subunits (H-heart).  Different tissues produce different amounts of the two subunits (M4, M3H ……….H4)  M4 facilitates conversion of pyruvate into lactate in skeletal muscles  M4 facilitates conversion of lactate into pyruvate in the heart.
  • 39.
     lactate formation enters mitochondria (i.e. Kreb’s cycle)  formation of Kreb’s cycle intermediates Pyruvate goes in one of three directions Metabolic Fate of Pyruvate
  • 42.
     primary functionis to reduce NAD+ and FAD  acetyl CoA (C2) combines with a C4 molecule forming a C6 molecule  C6 molecule is partially degraded back to a C4 molecule  each loss of C gives off a CO2 Kreb’s Cycle (Citric Acid Cycle)
  • 47.
  • 48.
    Citrate Synthetase Has noalosteric regulators Oxaloacetate concentration activates the enzyme Citrate concentration inhibits the enzyme
  • 49.
    Isocitrate Dehydrogenase  Ratelimiting step  Allosteric, activated by ADP & inhibited by NADH  Binding of ADP to one subunit causes the activation of other subunits (positive cooperativity)  Binding of ADP shift Km to a lower value  Small change in ADP brings about large change in the rate.
  • 50.
    α-ketoglutrate Dehydrogenase  Noallosteric regulators  Product inhibition by NADH and succinyl CoA  It may also be inhibited by GTP  In contracting heart muscle, the release of Ca2+ may provide activation of both enzymes when ATP is rapidly hydrolyzed.
  • 51.
    NADH  Plays acentral role in Regulation  Rate of oxidation of NADH depends on oxidative phosphorylation  It inhibits all dehydrogenases in TCA & pyruvate dehydrogenase and thus regulates entry point of acetyl CoA
  • 54.
    electron transport chain Overview of Aerobic Metabolism Kreb’s cycle (proteins) NADH FADH2 O2H2O ADP + Pi ATP acetyl CoA 1. Preparation for entry into Kreb’s cycle 2. Removal of “energized” electrons 3. 1º ATP synthesis; Oxidation- phosphorylation mitochondria Beta Oxidation (fats) Glycolysis (carbohydrates)
  • 56.
  • 57.
     Sites includeliver & kidney while substrates include, amino acids, lactate, pyruvate, glycerol.  Cori & alanine cycles for transport of intermediates between site of production of these metabolites and site of synthesis.  Many enzymes of glycolysis are common to gluconeogenesis. Gluconeogenesis(1)
  • 59.
     Irrversible enzymesof glycolysis are replaced by gluconeogenesis enzymes. 1. Pyruvate kinase – pyruvate carboxylase & PEPCK 2. PFK ---- F 2,6 diphosphatase 3. Glucokinase --- Glu 6 phosphatase Gluconeogenesis(2)
  • 60.
    Gluconeogenesis - BypassEnzymes Glucose oxaloacetate Glucose-6-Phosphate Fructose-6-Phosphate Fructose 1,6 Bisphosphate DHAP + Glyceraldehyde-3-P Glyceraldehyde-3-P Pyruvate PEP 2-Phosphoglycerate 3-Phosphoglycerate 1,3-BPG
  • 61.
    Gluconeogenesis - BypassEnzymes pyruvate + CO2 + ATP + H2O  oxaloacetate + ADP,Pi + 2H+ oxaloacetate + GTP  PEP + GDP + CO2 10. Pyruvate carboxylase & PEP carboxykinase (+) acetylCoA & (-) ADP 3.Fructose 1,6-bisphosphatase (-) fructose 2,6-bisphosphate (low fasting – high Fed) (-) AMP fructose 1,6 bisphosphate + H2O  fructose 6-phosphate + Pi 1. Glucose 6-phosphatase glucose 6-phosphate + H2O  glucose + Pi
  • 62.
    GLUCONEOGENESIS-Liver 2Pyruvate + 4ATP+ 2NADH 2GTP Glucose + 4ADP + 2NAD+ 2GDP to blood
  • 63.
     Galactose metabolismoccurs in liver.  Galactose UDP-galactose GK Uridyl transferase UDP- glucose Galactose metabolism
  • 64.
     Occurs inliver & adipose tissue  Fructose Fructose 6 phos fructokinase Glucose 6 phos Fructose metabolism
  • 65.
     The plasmaglucose concentration reflects the balance between intake, tissue utilization & endogeneous production .  Insulin promotes up take of glucose thus decreasing plasma glucose while glucagon stimulates both the release of glucose from glycogen stores & its denovo synthesis, thus causing an increase in plasma glucose.  Glucose stimulates the secretion of insulin & suppresses the secretion of glucagon. Glucose Homeostasis
  • 66.
     Insulin actson three main targets, liver, adipose & muscles.  In liver insulin stimulates, glycolysis, glycogenesis & lipogenesis & suppresses lipolysis.  In peripheral tissues, insulin induces lipoprotein lipase activity & thus stimulates triglyceride synthesis.  In muscles, insulin increases glucose & amino acid transport & glycogen synthesis. Metabolic effects of insulin
  • 67.
     Glucagon maineffect is the mobilization of the fuel reserves for the maintenance of the blood glucose level between meals.  Glucagon inhibits glucose- utilizing pathways and the storage of metabolic fuels.  It acts on liver, to stimulate glycogenolysis and inhibit glycogenesis, glycolysis and lipogenesis.  Gluconeogenesis and ketogenesis are then activated  Epinephrine has effects similar to glucagon in the liver but works through a different receptor. It promotes an increase in blood glucose in response to stress Metabolic effects of Glucagon
  • 68.
     The glucoselevel in the vicinity of the B- cell is sensed by the transporter GLUT- 2. Glucose is carried into the cell, where it is phophorylated into G-6- P by glucokinase which also is a part of the glucose sensing mechanism. Increased G-6- P increases glucose utilization and ATP production in the B- cell. This changes the flux of ions across the cell membrane, depolarizes the cell and increases the concentration of Ca2+. Hence insulin is exocytosed.  Insulin secretion is biphasic. The first phase occurs over 10- 15 minutes of stimulation which release the preformed insulin. The second phase, which lasts up to 2 hours, is the release of newly synthesized insulin. Stimulation of insulin secretion by glucose
  • 69.
     Insulin secretionis also stimulated by gastrointestinal hormones (insulinotropic peptide, cholecystokinin) and amino acids, such as leucine, arginine, and lysine. Thus, the insulin response to orally administered glucose is greater than to an intravenous infusion. Stimulation of insulin secretion by glucose
  • 70.
     Hypoglycemia isdefined as a blood glucose concentration below 2.5 mmol/ L ( 45 mg/dl).  Epinephrine and glucagon are released, resulting in a stress response, the manifestation of which may include sweating, trembling, increased heart rate and feeling of hunger. If blood glucose continues to fall, brain function is compromised (neuroglycopenia).  Hypoglycemia in healthy individuals is usually mild and may occur during exercise, after a period of fasting or due to alcohol ingestion.  Hypoglycemia may be caused by a rare insulin secreting tumor of the beta- cells ( insulinoma) or overdose of exogenous insulin. Hypoglycemia
  • 71.
     Alcohol ismetabolized primarily in the liver. Two steps metabolism of alcohol is relatively unregulated, leading to a rapid increase in hepatic NADH. This shifts the equilibrium of LDH catalyzed reaction towards lactate formation ( lacticacidemia). Also shifts cytosolic oxaloacetate towards malate formation, reducing gluconeogenesis from TCA. In addition DHAP is shifted toward glycerol- 3- phosphate formation and thus reducing gluconeogenesis from glycerol.  The low blood glucose leads to a stress response ( rapid heart beat, clammy skin), an effort to enhance stimulation of gluconeogenesis combined action of glucagon and epinephrine. Rapid breathing is physiological response to metabolic acidosis. Alcohol Excess and Hypoglycemia 2
  • 72.
     Maintaining nearnormal blood glucose levels prevents the development of late complications of diabetes. A recently completed landmark clinical study, the Diabetes Control Complications trial , has shown that the development of late complications of diabetes in type I diabetes is related to long term glycemia. This study has also shown that in patients who have complications, good control of glycemic delays further development of retinopathy, nephropathy and neuropathy. Similar results were obtained for type 2 diabetic patients during the UK Prospective Diabetes Study completed in 1998. Thus the aim of treatment of diabetes should be the achievement of blood levels as close to normal as possible, without precipitating hypoglycemia. The importance of good glycemic control
  • 73.
     The entryof glucose into brain, peripheral nerve tissue, kidney, intestine, lens and RBC does not depend on insulin action.  During hyperglycemia, the intracellular level of glucose in these cells is high, which promotes the non- enzymatic attachment of glucose to protein molecules.  Glycation involves glucose and alpha- amino terminal amino acid and ε- amino groups of lysine residues.  Hemoglobin, albumin and collagen become glycated which effects their function.  For instance, glycation of apolipoprotein B slows down the rate of receptor dependent metabolism of LDL. Protein modification by glucose
  • 74.
     The measurementof blood glucose remains the most important laboratory test in diabetes.  As erythrocytes age, there is gradual conversion of a fraction of native hemoglobin ( HbA) to its glycated form, HbA1C, so that an older red cell, a greater fraction of HbA exist as HbA1C.  HbA1C concentration in blood reflects the time – averaged level of glycemia over the 3-6 weeks preceding the measurement.  The normal concentration of HbA1C is 4-6% of HbA. Levels below 7% indicate acceptable control of diabetes. Higher levels suggest poor control. Glycated Hemoglobin (HbA1C)
  • 75.
    0 50 100 150 200 250 6 7 89 10 11 12 13 MBG
  • 76.
     Glucose canbe reduced to sorbitol by the action of aldose reductase. Sorbitol is further oxidized by sorbitol dehydrogenase to fructose. Since aldose reductase has a high Km for glucose, the pathway is not very active at normal glucose level.  In hyperglycemia, however, glucose levels in insulin independent tissues, such as the RBC, nerve and lens, increase and consequently there is an increase in the activity of the polyol pathway with depletion of NADPH.  Like glucose, sorbitol exerts an osmotic effect. This is thought to play a role in the development of diabetic cataracts.  In addition, the high level of sorbitol decreases cellular uptake of another alcohol, myoinositol, which in turn causes a decrease in the activity of membrane Na+/ K+ ATPase. This in turn effects nerve function and, along with hypoxia and reduced nerve blood, contributes to the development of diabetic neuropathy. Drugs inhibiting aldose reductase improve nerve function in diabetes. The Polyol Pathway
  • 79.
     Comments: Anumber of drugs, particularly primaquine and related antimalarials, undergo reactions in the cell, producing large quantities of superoxide and H2O2. Superoxide dismutase converts superoxide into H2O2, which is inactivated by glutathione peroxidase using NADPH. Some persons have genetic defect in G6PD, typically yielding an unstable enzyme that has a shorter life in the RBC. Therefore insufficient production of NADPH under stress, the cell ability to recycle GSSG to GSH is impaired and drug induced oxidative stress leads to lysis of RBC’s and hemolytic anemia. If the hemolysis is severe enough Hb spills over into the urine, resulting in hematuria and dark colored urine. Older cells, which can’t synthesize and replace their enzyme are therefore particularly affected. Genetically the deficiency is X- linked. Favism is associated with G6PD deficiency. Glucose 6 phosphate dehydrogenase deficiency 2
  • 80.
    0 0.5 1 1.5 2 2.5 3 3.5 4 4.5 5 ATP ADP AMP Rest Exercise Changesin ATP, ADP, and AMP concentrations in skeletal muscle

Editor's Notes

  • #61 There are four additional “bypass” enzymes required in addition to all the same “reversible” enzymes of glycolysis.
  • #63 This slide outlines the net reaction (What?) of gluconeogenesis, which is an anabolic pathway.