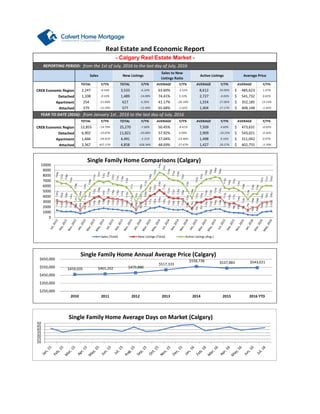
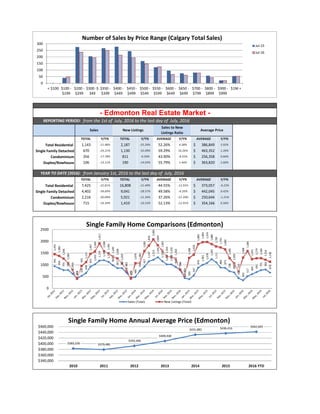
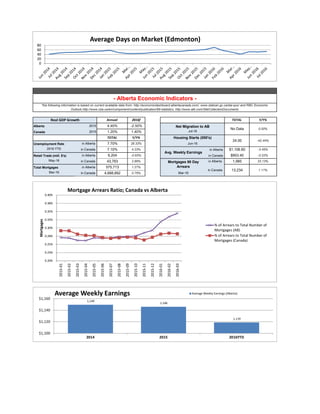
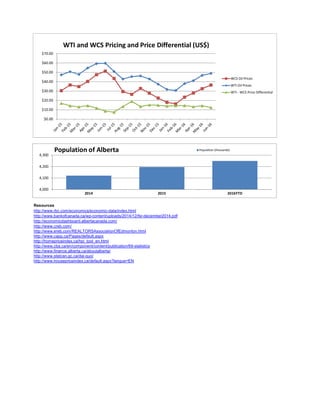
CREB Economic Region
Detached
Apartment
Attached
2016
CREB Economic Region
Detached
Apartment
Attached
1,498 9.16% 311,042$
11,821 -20.08% 57.92% 0.09% 2,909 -18.25% 543,021$
0.97%
2,367 427.17% 4,858 628.34% 48.69% -27.67% 1,427 29.27% 402,755$ -3.70%
1,666 -24.41% 4,491 -3.15% 37.04% -23.46%
Real Estate and Economic Report
Sales New Listings
Sales to New
Listings Ratio
Active Listings Average Price
1,108 -9.33% 1,489 -14.08% 74.41% 5.53%
TOTAL Y/Y% TOTAL Y/Y% AVERAGE Y/Y%
from the 1st of July, 2016 to the last day of July, 2016
-9.54% 3,533 -6.24% 63.60% -3.52%
REPORTING PERIOD:
AVERAGE Y/Y%Y/Y%
2,727 -0.04% 541,732$ 0.02%
254 -21.60% 617 6.20% 41.17% -26.18% 1,554 27.06% 352,185$
AVERAGE
8,612 20.99% 485,623$ 1.07%2,247
13.14%
- Calgary Real Estate Market -
408,148$ -2.42%577 -13.49% 65.68% -2.42% 1,404 27.17%
from January 1st , 2016 to the last day of July, 2016
379 -15.59%
-0.43%
12,855
TOTAL Y/Y% TOTAL Y/Y% AVERAGE Y/Y%
YEAR TO DATE (2016):
-0.02%
AVERAGE Y/Y% AVERAGE Y/Y%
-14.79% 25,270 -7.68% 50.45% -8.41% 7,509 4.60% 473,631$
6,902 -19.07%
$459,035 $465,202 $479,880
$517,333
$558,738 $537,883 $543,021
$250,000
$350,000
$450,000
$550,000
$650,000
2010 2011 2012 2013 2014 2015 2016 YTD
Single Family Home Annual Average Price (Calgary)
0
1000
2000
3000
4000
5000
6000
7000
8000
9000
10000
Single Family Home Comparisons (Calgary)
Sales (Total) New Listings (Total) Active Listings (Avg.)
20
25
30
35
40
45
50
Single Family Home Average Days on Market (Calgary)
Total Residential
Single Family Detached
Condominium
Duplex/Rowhouse
2016
Total Residential
Single Family Detached
Condominium
Duplex/Rowhouse 715 -24.34% 1,410 -10.53% 52.13% -12.91% 354,166$ 0.56%
4,402 -34.69% 9,041 -28.57% 49.58% -6.20% 442,045$ 0.42%
2,216 -30.09% 5,921 -11.34% 37.26% -21.20% 250,644$ -1.21%
YEAR TO DATE (2016): from January 1st, 2016 to the last day of July, 2016
AVERAGE Y/Y%
7,425 -32.81% 16,808 -21.49% 44.55% -12.91%
TOTAL Y/Y%
373,057$ -0.22%
TOTAL Y/Y% AVERAGE Y/Y%
356 -17.78% 811 -9.59% 43.90% -8.55% 256,358$ 0.66%
106 -13.11% 190 -14.03% 55.79% 1.44% 363,820$ 2.66%
3.92%
670 -24.21% 1,130 -35.09% 59.29% 16.26% 463,352$ 1.26%
1,143 -21.98% 2,187 -25.26% 52.26% 4.38% 386,849$
TOTAL Y/Y% TOTAL Y/Y% AVERAGE Y/Y% AVERAGE
REPORTING PERIOD: from the 1st of July, 2016 to the last day of July, 2016
Sales New Listings
Y/Y%
Sales to New
Listings Ratio
Average Price
- Edmonton Real Estate Market -
$383,226 $379,485
$392,446
$409,438
$431,882 $436,416 $442,045
$340,000
$360,000
$380,000
$400,000
$420,000
$440,000
$460,000
2010 2011 2012 2013 2014 2015 2016 YTD
Single Family Home Annual Average Price (Edmonton)
941
854
773
782
623
419
528
648
923
1,022
1,179
1,198
1,125
983
857
863
673
436
485
747
917
1,147
1,213
1,324
1,158
1,019
1,020
908
777
439
390
547
876
1,001
1,078
1,243
1,111
884
873
728
680
435
342
517
605
691
775
802
670
1,455
1,380
1,266
1,082
769
409
955
1,115
1,467
1,569
1,911
1,586
1,491
1,349
1,268
1,059
783
415
1,070
1,082
1,585
1,818
2,085
1,829
1,601
1,354
1,335
1,260
794
534
1,298
1,428
1,883
1,964
1,974
1,886
1,782
1,741
1,660
1,283
1,059
719
1,308
1,584
1,241
1,279
1,283
1,216
1,130
0
500
1000
1500
2000
2500
Single Family Home Comparisons (Edmonton)
Sales (Total) New Listings (Total)
0
50
100
150
200
250
300
< $100 $100 -
$199
$200 -
$299
$300 -$
349
$350 -
$399
$400 -
$449
$450 -
$499
$500 -
$549
$550 -
$599
$600 -
$649
$650 -
$699
$700 -
$799
$800 -
$899
$900 -
$999
$1M +
Jul-15
Jul-16
Number of Sales by Price Range (Calgary Total Sales)
Alberta
Canada
Unemployment Rate
2016 YTD in Alberta
Retail Trade (mill. $'s) in Canada
May-16
Total Mortgages
Mar-16
-2.50%
1.27%
0.75%
28.33% Jun-16
$1,106.60 -3.45%
$953.40 -0.22%
1,985Mortgages 90 Day
Arrears
Mar-16
Avg. Weekly Earnings
13,234 1.11%in Canada
Housing Starts (000's)
2015 1.20%
33.13%in Alberta
No Data 0.00%
24.00
4.40%
-42.44%
in Canada 4,688,892
43,763
7.10% 4.23%
2.89%
1.40%
in Alberta
in Alberta 7.70%
in Canada
2015
Real GDP Growth Annual
Y/Y%TOTAL
Net Migration to AB
Jul-16
575,713
-0.93%in Alberta 6,204
in Canada
*the following information is based on current available data from: http://economicdashboard.albertacanada.com/, www.statcan.gc.ca/dai-quo/ and RBC Economic
Outlook,http://www.cba.ca/en/component/content/publication/69-statistics, http://www.atb.com/SiteCollectionDocuments
- Alberta Economic Indicators -
TOTAL Y/Y%2016f
0
20
40
60
80
Average Days on Market (Edmonton)
1,149
1,146
1,119
$1,100
$1,120
$1,140
$1,160
2014 2015 2016YTD
Average Weekly Earnings Average Weekly Earnings (Alberta)
0.20%
0.23%
0.25%
0.28%
0.30%
0.33%
0.35%
0.38%
0.40%
2015-01
2015-02
2015-03
2015-04
2015-05
2015-06
2015-07
2015-08
2015-09
2015-10
2015-11
2015-12
2016-01
2016-02
2016-03
Mortgages
% of Arrears to Total Number of
Mortgages (AB)
% of Arrears to Total Number of
Mortgages (Canada)
Mortgage Arrears Ratio; Canada vs Alberta
Resources
http://economicdashboard.albertacanada.com/
http://www.creb.com/
http://www.ereb.com/REALTORSAssociationOfEdmonton.html
http://www.capp.ca/Pages/default.aspx
http://homepriceindex.ca/hpi_tool_en.html
http://www.cba.ca/en/component/content/publication/69-statistics
http://www.finance.alberta.ca/aboutalberta/
http://www.statcan.gc.ca/dai-quo/
http://www.housepriceindex.ca/default.aspx?langue=EN
http://www.bankofcanada.ca/wp-content/uploads/2014/12/fsr-december2014.pdf
http://www.rbc.com/economics/economic-data/index.html
$0.00
$10.00
$20.00
$30.00
$40.00
$50.00
$60.00
$70.00
WCS Oil Prices
WTI Oil Prices
WTI - WCS Price Differential
WTI and WCS Pricing and Price Differential (US$)
4,000
4,100
4,200
4,300
2014 2015 2016YTD
Population of Alberta Population (thousands)

Chmic economic report july 2016

  • 1.
    CREB Economic Region Detached Apartment Attached 2016 CREBEconomic Region Detached Apartment Attached 1,498 9.16% 311,042$ 11,821 -20.08% 57.92% 0.09% 2,909 -18.25% 543,021$ 0.97% 2,367 427.17% 4,858 628.34% 48.69% -27.67% 1,427 29.27% 402,755$ -3.70% 1,666 -24.41% 4,491 -3.15% 37.04% -23.46% Real Estate and Economic Report Sales New Listings Sales to New Listings Ratio Active Listings Average Price 1,108 -9.33% 1,489 -14.08% 74.41% 5.53% TOTAL Y/Y% TOTAL Y/Y% AVERAGE Y/Y% from the 1st of July, 2016 to the last day of July, 2016 -9.54% 3,533 -6.24% 63.60% -3.52% REPORTING PERIOD: AVERAGE Y/Y%Y/Y% 2,727 -0.04% 541,732$ 0.02% 254 -21.60% 617 6.20% 41.17% -26.18% 1,554 27.06% 352,185$ AVERAGE 8,612 20.99% 485,623$ 1.07%2,247 13.14% - Calgary Real Estate Market - 408,148$ -2.42%577 -13.49% 65.68% -2.42% 1,404 27.17% from January 1st , 2016 to the last day of July, 2016 379 -15.59% -0.43% 12,855 TOTAL Y/Y% TOTAL Y/Y% AVERAGE Y/Y% YEAR TO DATE (2016): -0.02% AVERAGE Y/Y% AVERAGE Y/Y% -14.79% 25,270 -7.68% 50.45% -8.41% 7,509 4.60% 473,631$ 6,902 -19.07% $459,035 $465,202 $479,880 $517,333 $558,738 $537,883 $543,021 $250,000 $350,000 $450,000 $550,000 $650,000 2010 2011 2012 2013 2014 2015 2016 YTD Single Family Home Annual Average Price (Calgary) 0 1000 2000 3000 4000 5000 6000 7000 8000 9000 10000 Single Family Home Comparisons (Calgary) Sales (Total) New Listings (Total) Active Listings (Avg.) 20 25 30 35 40 45 50 Single Family Home Average Days on Market (Calgary)
  • 2.
    Total Residential Single FamilyDetached Condominium Duplex/Rowhouse 2016 Total Residential Single Family Detached Condominium Duplex/Rowhouse 715 -24.34% 1,410 -10.53% 52.13% -12.91% 354,166$ 0.56% 4,402 -34.69% 9,041 -28.57% 49.58% -6.20% 442,045$ 0.42% 2,216 -30.09% 5,921 -11.34% 37.26% -21.20% 250,644$ -1.21% YEAR TO DATE (2016): from January 1st, 2016 to the last day of July, 2016 AVERAGE Y/Y% 7,425 -32.81% 16,808 -21.49% 44.55% -12.91% TOTAL Y/Y% 373,057$ -0.22% TOTAL Y/Y% AVERAGE Y/Y% 356 -17.78% 811 -9.59% 43.90% -8.55% 256,358$ 0.66% 106 -13.11% 190 -14.03% 55.79% 1.44% 363,820$ 2.66% 3.92% 670 -24.21% 1,130 -35.09% 59.29% 16.26% 463,352$ 1.26% 1,143 -21.98% 2,187 -25.26% 52.26% 4.38% 386,849$ TOTAL Y/Y% TOTAL Y/Y% AVERAGE Y/Y% AVERAGE REPORTING PERIOD: from the 1st of July, 2016 to the last day of July, 2016 Sales New Listings Y/Y% Sales to New Listings Ratio Average Price - Edmonton Real Estate Market - $383,226 $379,485 $392,446 $409,438 $431,882 $436,416 $442,045 $340,000 $360,000 $380,000 $400,000 $420,000 $440,000 $460,000 2010 2011 2012 2013 2014 2015 2016 YTD Single Family Home Annual Average Price (Edmonton) 941 854 773 782 623 419 528 648 923 1,022 1,179 1,198 1,125 983 857 863 673 436 485 747 917 1,147 1,213 1,324 1,158 1,019 1,020 908 777 439 390 547 876 1,001 1,078 1,243 1,111 884 873 728 680 435 342 517 605 691 775 802 670 1,455 1,380 1,266 1,082 769 409 955 1,115 1,467 1,569 1,911 1,586 1,491 1,349 1,268 1,059 783 415 1,070 1,082 1,585 1,818 2,085 1,829 1,601 1,354 1,335 1,260 794 534 1,298 1,428 1,883 1,964 1,974 1,886 1,782 1,741 1,660 1,283 1,059 719 1,308 1,584 1,241 1,279 1,283 1,216 1,130 0 500 1000 1500 2000 2500 Single Family Home Comparisons (Edmonton) Sales (Total) New Listings (Total) 0 50 100 150 200 250 300 < $100 $100 - $199 $200 - $299 $300 -$ 349 $350 - $399 $400 - $449 $450 - $499 $500 - $549 $550 - $599 $600 - $649 $650 - $699 $700 - $799 $800 - $899 $900 - $999 $1M + Jul-15 Jul-16 Number of Sales by Price Range (Calgary Total Sales)
  • 3.
    Alberta Canada Unemployment Rate 2016 YTDin Alberta Retail Trade (mill. $'s) in Canada May-16 Total Mortgages Mar-16 -2.50% 1.27% 0.75% 28.33% Jun-16 $1,106.60 -3.45% $953.40 -0.22% 1,985Mortgages 90 Day Arrears Mar-16 Avg. Weekly Earnings 13,234 1.11%in Canada Housing Starts (000's) 2015 1.20% 33.13%in Alberta No Data 0.00% 24.00 4.40% -42.44% in Canada 4,688,892 43,763 7.10% 4.23% 2.89% 1.40% in Alberta in Alberta 7.70% in Canada 2015 Real GDP Growth Annual Y/Y%TOTAL Net Migration to AB Jul-16 575,713 -0.93%in Alberta 6,204 in Canada *the following information is based on current available data from: http://economicdashboard.albertacanada.com/, www.statcan.gc.ca/dai-quo/ and RBC Economic Outlook,http://www.cba.ca/en/component/content/publication/69-statistics, http://www.atb.com/SiteCollectionDocuments - Alberta Economic Indicators - TOTAL Y/Y%2016f 0 20 40 60 80 Average Days on Market (Edmonton) 1,149 1,146 1,119 $1,100 $1,120 $1,140 $1,160 2014 2015 2016YTD Average Weekly Earnings Average Weekly Earnings (Alberta) 0.20% 0.23% 0.25% 0.28% 0.30% 0.33% 0.35% 0.38% 0.40% 2015-01 2015-02 2015-03 2015-04 2015-05 2015-06 2015-07 2015-08 2015-09 2015-10 2015-11 2015-12 2016-01 2016-02 2016-03 Mortgages % of Arrears to Total Number of Mortgages (AB) % of Arrears to Total Number of Mortgages (Canada) Mortgage Arrears Ratio; Canada vs Alberta
  • 4.