Download as PDF, PPTX
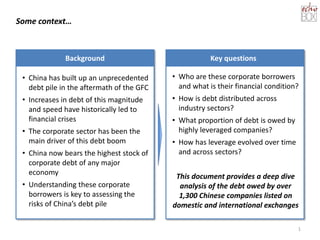
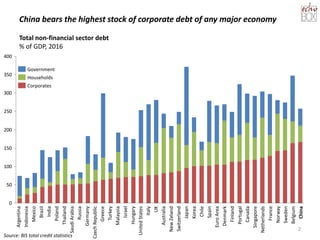
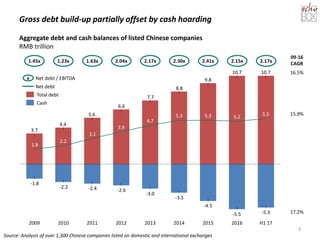
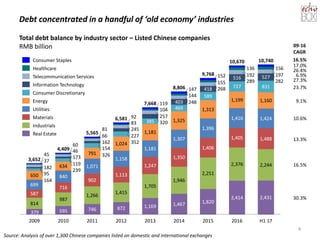
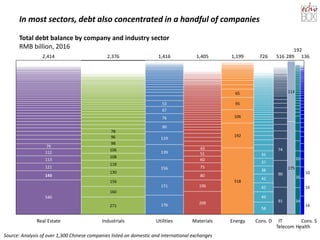
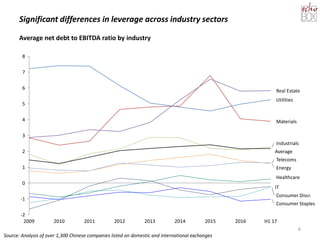
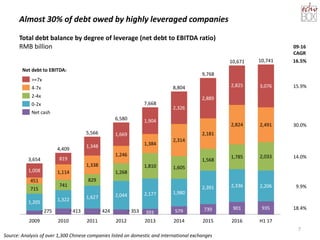
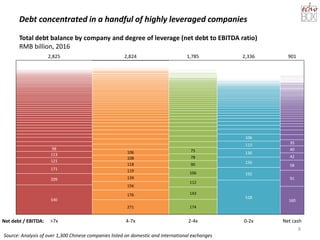


The document analyzes China's unprecedented corporate debt, which is now the highest among major economies, primarily driven by the corporate sector. It reviews the financial conditions and leverage of over 1,300 companies, revealing that significant debt is concentrated in a few 'old economy' industries and among highly leveraged firms. Key findings include sharp increases in debt levels and the risks associated with this rising leverage across various sectors.


