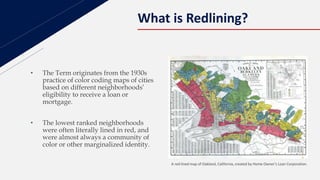
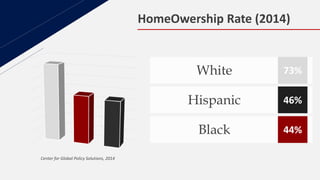
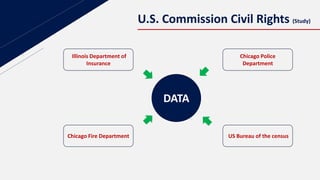
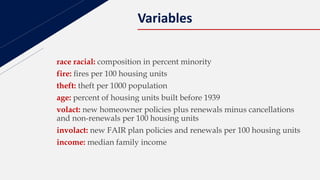
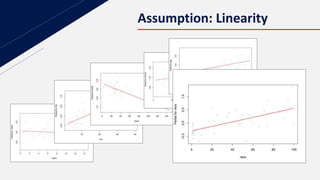
Insurance Redlining
Ch icago
Presenter
Malik Hassan Qayyum
Data Analytics Graduate Student At Drew University
1
What is Redlining?
• The Term originates from the 1930s
practice of color coding maps of cities
based on different neighborhoods’
eligibility to receive a loan or
mortgage.
• The lowest ranked neighborhoods
were often literally lined in red, and
were almost always a community of
color or other marginalized identity.
A red lined map of Oakland, California, created by Home Owner’s Loan Corporation.
HomeOwership Rate (2014)
Center for Global Policy Solutions, 2014
73%White
46%Hispanic
44%Black
U.S. Commission Civil Rights (Study)
DATA
Illinois Department of
Insurance
Chicago Fire Department
Chicago Police
Department
US Bureau of the census
Variables
race racial: composition in percent minority
fire: res per 100 housing units
theft: theft per 1000 population
age: percent of housing units built before 1939
volact: new homeowner policies plus renewals minus cancellations
and non-renewals per 100 housing units
involact: new FAIR plan policies and renewals per 100 housing units
income: median family income
Business Goal!
Initial Data Analysis
ch = chicago
ch$income = ch$income/1000
summary(ch)
## race fire theft age
## Min. : 1.00 Min. : 2.00 Min. : 3.00 Min. : 2.00
## 1st Qu.: 3.75 1st Qu.: 5.65 1st Qu.: 22.00 1st Qu.:48.60
## Median :24.50 Median :10.40 Median : 29.00 Median :65.00
## Mean :34.99 Mean :12.28 Mean : 32.36 Mean :60.33
## 3rd Qu.:57.65 3rd Qu.:16.05 3rd Qu.: 38.00 3rd Qu.:77.30
## Max. :99.70 Max. :39.70 Max. :147.00 Max. :90.10
## volact involact income
## Min. : 0.50 Min. :0.0000 Min. : 5.583
## 1st Qu.: 3.10 1st Qu.:0.0000 1st Qu.: 8.447
## Median : 5.90 Median :0.4000 Median :10.694
## Mean : 6.53 Mean :0.6149 Mean :10.696
## 3rd Qu.: 9.65 3rd Qu.:0.9000 3rd Qu.:11.989
## Max. :14.30 Max. :2.2000 Max. :21.480
summary(chicago)
## race fire theft age
## Min. : 1.00 Min. : 2.00 Min. : 3.00 Min. : 2.00
## 1st Qu.: 3.75 1st Qu.: 5.65 1st Qu.: 22.00 1st Qu.:48.60
## Median :24.50 Median :10.40 Median : 29.00 Median :65.00
## Mean :34.99 Mean :12.28 Mean : 32.36 Mean :60.33
## 3rd Qu.:57.65 3rd Qu.:16.05 3rd Qu.: 38.00 3rd Qu.:77.30
## Max. :99.70 Max. :39.70 Max. :147.00 Max. :90.10
## volact involact income
## Min. : 0.50 Min. :0.0000 Min. : 5583
## 1st Qu.: 3.10 1st Qu.:0.0000 1st Qu.: 8447
## Median : 5.90 Median :0.4000 Median :10694
## Mean : 6.53 Mean :0.6149 Mean :10696
## 3rd Qu.: 9.65 3rd Qu.:0.9000 3rd Qu.:11989
## Max. :14.30 Max. :2.2000 Max. :21480
Initial Data Analysis
Assumption: Linearity
Assumption: Normality
Assumption: Constant Variance
Collinearity Check
vif(X)
## race fire theft age volact income
## 3.491088 2.798840 1.684571 2.266203 4.851903 3.153110
Model without Volact performs well as it have relatively high VIF
Income also proved to be insignificant
Influential Observations
After validating by removing and adding back different outliers
No Influential Observations
Final Model
involact ~ 0.007628 race
+ 0.039080 fire
+ (-1.415081) poly(theft,3) 1
+ (-0.074267) poly(theft,3) 2
+ (0.562725) poly(theft,3) 3
+ 0.005282 age
R-squared: 0.7603, Adjusted R-squared: 0.7244
References
• Jackson, Kenneth T. Crabgrass Frontier:
The Suburbanization of the United States.
New York: Oxford UP, 1985. Print.
• Squires, Gregory D. “Racial Profiling, Insurance Style:
Insurance Redlining and the Uneven Development of Metropolitan
Areas.” Journal of Urban Affairs 25.4 (2003): 391-410. Print.
• Badger, Emily. “Redlining: Still a thing.” The Washington Post. WP Company, 28
May 2015. Web. 19 Dec. 2016.
• Tootell, G. M. B. “Redlining in Boston: Do Mortgage Lenders Discriminate
Against Neighborhoods?” The Quarterly Journal of Economics 111.4 (1996):
1049-079. Print.
Full Report
www.doctordatah.com/Chicago-redlining-regression-report
A ny Qu estion s?
Thank You 

Chicago Insurance Redlining - Presentation

  • 1.
    Insurance Redlining Ch icago Presenter MalikHassan Qayyum Data Analytics Graduate Student At Drew University 1
  • 2.
    What is Redlining? •The Term originates from the 1930s practice of color coding maps of cities based on different neighborhoods’ eligibility to receive a loan or mortgage. • The lowest ranked neighborhoods were often literally lined in red, and were almost always a community of color or other marginalized identity. A red lined map of Oakland, California, created by Home Owner’s Loan Corporation.
  • 3.
    HomeOwership Rate (2014) Centerfor Global Policy Solutions, 2014 73%White 46%Hispanic 44%Black
  • 4.
    U.S. Commission CivilRights (Study) DATA Illinois Department of Insurance Chicago Fire Department Chicago Police Department US Bureau of the census
  • 5.
    Variables race racial: compositionin percent minority fire: res per 100 housing units theft: theft per 1000 population age: percent of housing units built before 1939 volact: new homeowner policies plus renewals minus cancellations and non-renewals per 100 housing units involact: new FAIR plan policies and renewals per 100 housing units income: median family income
  • 6.
  • 7.
    Initial Data Analysis ch= chicago ch$income = ch$income/1000 summary(ch) ## race fire theft age ## Min. : 1.00 Min. : 2.00 Min. : 3.00 Min. : 2.00 ## 1st Qu.: 3.75 1st Qu.: 5.65 1st Qu.: 22.00 1st Qu.:48.60 ## Median :24.50 Median :10.40 Median : 29.00 Median :65.00 ## Mean :34.99 Mean :12.28 Mean : 32.36 Mean :60.33 ## 3rd Qu.:57.65 3rd Qu.:16.05 3rd Qu.: 38.00 3rd Qu.:77.30 ## Max. :99.70 Max. :39.70 Max. :147.00 Max. :90.10 ## volact involact income ## Min. : 0.50 Min. :0.0000 Min. : 5.583 ## 1st Qu.: 3.10 1st Qu.:0.0000 1st Qu.: 8.447 ## Median : 5.90 Median :0.4000 Median :10.694 ## Mean : 6.53 Mean :0.6149 Mean :10.696 ## 3rd Qu.: 9.65 3rd Qu.:0.9000 3rd Qu.:11.989 ## Max. :14.30 Max. :2.2000 Max. :21.480 summary(chicago) ## race fire theft age ## Min. : 1.00 Min. : 2.00 Min. : 3.00 Min. : 2.00 ## 1st Qu.: 3.75 1st Qu.: 5.65 1st Qu.: 22.00 1st Qu.:48.60 ## Median :24.50 Median :10.40 Median : 29.00 Median :65.00 ## Mean :34.99 Mean :12.28 Mean : 32.36 Mean :60.33 ## 3rd Qu.:57.65 3rd Qu.:16.05 3rd Qu.: 38.00 3rd Qu.:77.30 ## Max. :99.70 Max. :39.70 Max. :147.00 Max. :90.10 ## volact involact income ## Min. : 0.50 Min. :0.0000 Min. : 5583 ## 1st Qu.: 3.10 1st Qu.:0.0000 1st Qu.: 8447 ## Median : 5.90 Median :0.4000 Median :10694 ## Mean : 6.53 Mean :0.6149 Mean :10696 ## 3rd Qu.: 9.65 3rd Qu.:0.9000 3rd Qu.:11989 ## Max. :14.30 Max. :2.2000 Max. :21480
  • 8.
  • 9.
  • 10.
  • 11.
  • 12.
    Collinearity Check vif(X) ## racefire theft age volact income ## 3.491088 2.798840 1.684571 2.266203 4.851903 3.153110 Model without Volact performs well as it have relatively high VIF Income also proved to be insignificant
  • 13.
    Influential Observations After validatingby removing and adding back different outliers No Influential Observations
  • 14.
    Final Model involact ~0.007628 race + 0.039080 fire + (-1.415081) poly(theft,3) 1 + (-0.074267) poly(theft,3) 2 + (0.562725) poly(theft,3) 3 + 0.005282 age R-squared: 0.7603, Adjusted R-squared: 0.7244
  • 15.
    References • Jackson, KennethT. Crabgrass Frontier: The Suburbanization of the United States. New York: Oxford UP, 1985. Print. • Squires, Gregory D. “Racial Profiling, Insurance Style: Insurance Redlining and the Uneven Development of Metropolitan Areas.” Journal of Urban Affairs 25.4 (2003): 391-410. Print. • Badger, Emily. “Redlining: Still a thing.” The Washington Post. WP Company, 28 May 2015. Web. 19 Dec. 2016. • Tootell, G. M. B. “Redlining in Boston: Do Mortgage Lenders Discriminate Against Neighborhoods?” The Quarterly Journal of Economics 111.4 (1996): 1049-079. Print. Full Report www.doctordatah.com/Chicago-redlining-regression-report
  • 16.
    A ny Question s? Thank You 

Editor's Notes

  • #3 THE TERM REDLINING, or red-lining, originates from the 1930s practice of color coding maps of cities based on different neighborhoods’ eligibility to receive a loan or mortgage. The lowest ranked neighborhoods were often literally lined in red, and were almost always a community of color or other marginalized identity. Redlining began in 1935 when the Home Owner’s Loan Corporation began producing maps of virtually every major city upon request of the Federal Home Loan Bank Board. Neighborhoods were color coded based on their desirability, from “A - First Grade” to “D - Fourth Grade.” Most often the “D” ranking neighborhoods were black communities, or other communities of minorities, while the “A” ranking neighborhoods were affluent white suburbs.1 The maps were used by both public and private banks and loan offices to directly discriminate and refuse loans to residents of the “D” neighborhoods. The Fair Housing Act of 1968 made discrimination during the process of selling a house illegal, yet redlining was not effectively outlawed until 1977. The Home Mortgage Disclosure Act of 1975 required transparency thus making redlining unfeasible, and was followed by the Community Reinvestment Act of 1977 that finally prohibited it