1. CHI-SQUARE TEST
Adapted by Anne F. Maben from "Statistics for the Social Sciences" by Vicki Sharp
The chi-square (I) test is used to determine whether there is a significant difference between the expected
frequencies and the observed frequencies in one or more categories. Do the number of individuals or objects that
fall in each category differ significantly from the number you would expect? Is this difference between the
expected and observed due to sampling error, or is it a real difference?
Chi-Square Test Requirements
1. Quantitative data.
2. One or more categories.
3. Independent observations.
4. Adequate sample size (at least 10).
5. Simple random sample.
6. Data in frequency form.
7. All observations must be used.
Expected Frequencies
When you find the value for chi square, you determine whether the observed frequencies differ significantly
from the expected frequencies. You find the expected frequencies for chi square in three ways:
I . You hypothesize that all the frequencies are equal in each category. For example, you might expect that
half of the entering freshmen class of 200 at Tech College will be identified as women and half as men. You
figure the expected frequency by dividing the number in the sample by the number of categories. In this exam
pie, where there are 200 entering freshmen and two categories, male and female, you divide your sample of
200 by 2, the number of categories, to get 100 (expected frequencies) in each category.
2. You determine the expected frequencies on the basis of some prior knowledge. Let's use the Tech College
example again, but this time pretend we have prior knowledge of the frequencies of men and women in each
category from last year's entering class, when 60% of the freshmen were men and 40% were women. This
year you might expect that 60% of the total would be men and 40% would be women. You find the expected
frequencies by multiplying the sample size by each of the hypothesized population proportions. If the
freshmen total were 200, you would expect 120 to be men (60% x 200) and 80 to be women (40% x 200).
Now let's take a situation, find the expected frequencies, and use the chi-square test to solve the problem.
Situation
Thai, the manager of a car dealership, did not want to stock cars that were bought less frequently because of
their unpopular color. The five colors that he ordered were red, yellow, green, blue, and white. According to Thai,
the expected frequencies or number of customers choosing each color should follow the percentages of last year.
She felt 20% would choose yellow, 30% would choose red, 10% would choose green, 10% would choose blue,
and 30% would choose white. She now took a random sample of 150 customers and asked them their color
preferences. The results of this poll are shown in Table 1 under the column labeled observed frequencies."
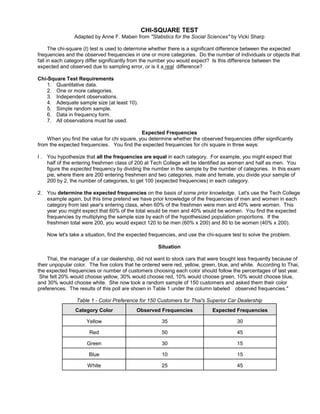
Table 1 - Color Preference for 150 Customers for Thai's Superior Car Dealership
Category Color Observed Frequencies Expected Frequencies
Yellow 35 30
Red 50 45
Green 30 15
Blue 10 15
White 25 45
2. The expected frequencies in Table 1 are figured from last year's percentages. Based on the percentages for
last year, we would expect 20% to choose yellow. Figure the expected frequencies for yellow by taking 20% of
the 150 customers, getting an expected frequency of 30 people for this category. For the color red we would
expect 30% out of 150 or 45 people to fall in this category. Using this method, Thai figured out the expected
frequencies 30, 45, 15, 15, and 45. Obviously, there are discrepancies between the colors preferred by customers
in the poll taken by Thai and the colors preferred by the customers who bought their cars last year. Most striking
is the difference in the green and white colors. If Thai were to follow the results of her poll, she would stock twice
as many green cars than if she were to follow the customer color preference for green based on last year's sales.
In the case of white cars, she would stock half as many this year. What to do??? Thai needs to know whether or
not the discrepancies between last year's choices (expected frequencies) and this year's preferences on the basis
of his poll (observed frequencies) demonstrate a real change in customer color preferences. It could be that the
differences are simply a result of the random sample she chanced to select. If so, then the population of cus-
tomers really has not changed from last year as far as color preferences go. The null hypothesis states that there
is no significant difference between the expected and observed frequencies. The alternative hypothesis states
they are different. The level of significance (the point at which you can say with 95% confidence that the
difference is NOT due to chance alone) is set at .05 (the standard for most science experiments.) The chi-square
formula used on these data is
2 2
X = (O - E) where O is the Observed Frequency in each category
E E is the Expected Frequency in the corresponding category
is sum of
df is the "degree of freedom" (n-1)
2
X is Chi Square
PROCEDURE
2
We are now ready to use our formula for X and find out if there is a significant difference between the
observed and expected frequencies for the customers in choosing cars. We will set up a worksheet; then you will
follow the directions to form the columns and solve the formula.
1. Directions for Setting Up Worksheet for Chi Square
2 2
Category O E (O - E) (O - E) (O - E)
E
yellow 35 30 5 25 0.83
red 50 45 5 25 0.56
green 30 15 15 225 15
blue 10 15 -5 25 1.67
white 25 45 -20 400 8.89
2
X = 26.95
2. After calculating the Chi Square value, find the "Degrees of Freedom." (DO NOT SQUARE THE NUMBER
YOU GET, NOR FIND THE SQUARE ROOT - THE NUMBER YOU GET FROM COMPLETING THE
CALCULATIONS AS ABOVE IS CHI SQUARE.)
Degrees of freedom (df) refers to the number of values that are free to vary after restriction has been
placed on the data. For instance, if you have four numbers with the restriction that their sum has to be 50,
then three of these numbers can be anything, they are free to vary, but the fourth number definitely is
restricted. For example, the first three numbers could be 15, 20, and 5, adding up to 40; then the fourth
number has to be 10 in order that they sum to 50. The degrees of freedom for these values are then three.
The degrees of freedom here is defined as N - 1, the number in the group minus one restriction (4 - I ).
3. Find the table value for Chi Square. Begin by finding the df found in step 2 along the left hand side of the
table. Run your fingers across the proper row until you reach the predetermined level of significance (.05) at
3. the column heading on the top of the table. The table value for Chi Square in the correct box of 4 df and
P=.05 level of significance is 9.49.
4. If the calculated chi-square value for the set of data you are analyzing (26.95) is equal to or greater than the
table value (9.49 ), reject the null hypothesis. There IS a significant difference between the data sets that
cannot be due to chance alone. If the number you calculate is LESS than the number you find on the table,
than you can probably say that any differences are due to chance alone.
In this situation, the rejection of the null hypothesis means that the differences between the expected
frequencies (based upon last year's car sales) and the observed frequencies (based upon this year's poll
taken by Thai) are not due to chance. That is, they are not due to chance variation in the sample Thai took;
there is a real difference between them. Therefore, in deciding what color autos to stock, it would be to Thai's
advantage to pay careful attention to the results of her poll!
The steps in using the chi-square test may be summarized as follows:
Chi-Square I. Write the observed frequencies in column O
Test Summary 2. Figure the expected frequencies and write them in column E.
3. Use the formula to find the chi-square value:
4. Find the df. (N-1)
5. Find the table value (consult the Chi Square Table.)
6. If your chi-square value is equal to or greater than the table value, reject the null
hypothesis: differences in your data are not due to chance alone
For example, the reason observed frequencies in a fruit fly genetic breeding lab did not match expected
frequencies could be due to such influences as:
• Mate selection (certain flies may prefer certain mates)
• Too small of a sample size was used
• Incorrect identification of male or female flies
• The wrong genetic cross was sent from the lab
• The flies were mixed in the bottle (carrying unexpected alleles)