1. POSSIBLE OCCURRENCES OF TRANSITION ZONES AND RESIDUAL
OIL ZONES BELOW OIL-WATER CONTACTS IN MATURE OIL FIELDS,
SOUTHEAST SASKATCHEWAN
Chengyu Yang and Hairuo Qing
University of Regina
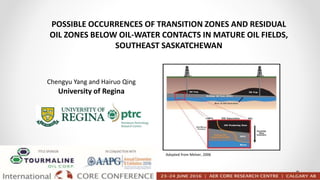
Adopted from Melzer, 2006
2. The gradational nature of the transition zone (TZ) is interrupted by a thick, relatively constant, low oil saturation zone—Residual
oil zone (ROZ)
Oil saturation profiles of ROZ. (a) average oil saturation profile adopted from a Wasson Denver Unit well in the Permian Basin (modified from
Koperna and Kuuskraa, 2006). (b) average oil saturation profile adopted from Seminole San Andres Unit in the Permian Basin (modified from
Trentham et al., 2010, 2012). (c) water saturation profile adopted from the Nubian sandstone reservoir in the Zei Bay field of the Gulf of Suez, Egypt
(modified from Elshahawi, 1999).
Transition Zone & Residual Oil Zone
TZ forms under capillary force ROZ occurs under certain geological and hydrodynamic conditions,
and may be recoverable using tertiary recovery techniques
3. Illustration of possible origins for ROZ (modified from Melzer, 2006)
Origins of ROZ
Melzer (2006) proposed three possible origins for
ROZ :
Type 1 ROZ is formed from the original oil trap
subject to post-entrapment regional tilt.
Type 2 ROZ is created when the original oil
escapes due to the breaching of its upper seal.
Type 3 ROZ results from a change of hydrodynamic
conditions in the underlying aquifer.
4. Objective
Perform a preliminary investigation
of possible occurrence of the
TZ/ROZ in southeast
Saskatchewan.
• Reviewed geological history
related to ROZ
• Identified 4 existing pools that
possibly have TZ/ROZ
potential.
- Well log
- Core samples
- fluorescence test of cuttings
- DSTs and etc.
• Estimated the potential of the
possible TZ/ROZ
Map of major oil pools in the Williston Basin, southeast Saskatchewan
(GeoSCOUT database).
Rosebank Alida pool
Bellegarde Tilston pool
Frys Tilston-Souris Valley
pool
Un-named Souris
Valley pool
5. A typical basement subsidence profile of the Williston Basin generated at well location 6-9-7-13W2
(modified from Olajide and Bend, in press).
Geological Background Related to ROZ
—The geological background of the Williston Basin might have preserved the possibility of ROZ
Water driving force of the representative Mississippian Madison Group aquifers in Southeast
Saskatchwan, showing the water flows generally travel from west to east (modified from
Palombi, 2008)
• Mayor oil producer—the Madison Group, oil generated and migrated during the Late Cretaceous – the Early Tertiary time.
• Basin being experiencing intermittent tectonic uplifts since the Late Cretaceous
• Subsurface water flows in the Mississippian strata might be result of Laramide Orogeny (Late Qretaceous) and Laurentide ice-sheet retreat
(Quaternary).
6. Oil and water saturation analysis using well log data
Oil saturation calculated from well logs in the Bellegarde Tilston pool area suggesting the occurrence of a TZ/ROZ below the traditional OWC.
An interval about 30 meters
thick with oil saturation ranging
from 0% to more than 40% is
present from the Lower Tilston
to the uppermost Souris Valley
ROZ/TZ
7. Exemplary Pickett plots adopted from the Bellegarde
Tilston pool area
Exemplary Pickett plots adopted from the Frys Tilston-Souris
Valley pool area
Pickett crossplots
Separations between the resistivity of different zones illustrate that the resistivity of the possible TZ/ROZs is, to
some degree, affected by hydrocarbons.
8. Evidences on cores from possible ROZ
Cores from the Alida Bed in Well 4-14-5-32W1, the Rosebank Alida pool.
• DST below OWC recovered only water
• Oil stains below OWC
• Core derived oil saturation (about 10%) below OWC
(GeoSCOUT database)
• Fractures and dissolutions that may indicate
occurrence of water flow(s)
Cores from the possible
TZ/ROZ in dry hole 4-36-73-
1W1, the Frys Tilson-Souris
Valley pool area
Cores from the possible
TZ/ROZ in dry hole 9-17-6-
31W1, the Bellegarde Tilston
pool area.
9. Fluorescence test of drill cuttings
Fluorescence test of Well 4-33-008-31W1, 990m ~1080m, every 5
meters, adopted from the un-named Souris Valley pool area.
Fluorescence of Well 16-33-4-32W1, 3640 ft ~ 3730 ft (1109.5 m ~1137 m), every 5
feet.
Strong fluorescence test agrees
with the oil saturation profile, on
the presence of oil for about 40
meters below the OWC
Strong fluorescence indicates the
presence of oil between the OWC
and bottom seal.
10. Tilted OWC As suggested by Hubbert (1953), the accumulations of oil under hydrodynamic conditions will invariably
exhibit tilted oil-water interface. This can be described by the equation below:
𝑑𝑧
𝑑𝑥
=
𝜌 𝑤
𝜌 𝑤 − 𝜌 𝑜
𝑑ℎ
𝑑𝑥
Cross section across the Rosebank Alida showing titled OWC
Where:
dz/dx = slope of the oil-water contact
w = density of the water
o = density of the oil
dh/dx = potentiometric gradient
11. Sulfur water (H2S in water) and Oil shows reported by DST in dry
holes in surrounding non-producing areas
Well locations in the Rosebank Alida pool and surrounding areas where
DSTs recovered sulfur water and/or water with hydrocarbon shows.
H2S is the most conspicuous and abundant product of bacterial
sulfate reduction (BSR) and thermochemical sulfate reduction (TSR)
The paleo-temperature of the Mississippian Mission Canyon
Formation in the Williston Basin had never reached the threshold for
TSR (100 oC) but might be optimum for BSR (20 oC ~ 40oC).
BSR sulfur water may be indicative of water flow and ROZ
A typical basement subsidence profile of the Williston Basin generated at well
location 6-9-7-13W2 (modified from Olajide and Bend, in press).
Never high
enough for
TSR
12. Inversed oil saturation
Post-entrapment water flows may be
responsible for this. It swept through the
zone below OWC, taking away initial oil
accumulation. Porous reservoir tends to lose
oil more easily.
• Above OWC, high oil saturation in the
porous reservoir above OWC
• Below OWC, oil saturation is lower in
porous reservoir than in tighter
reservoir.
Usually, the porous reservoir is likely to be
more permeable than tighter reservoir, and
thereby tends to have higher oil saturation.
Oil saturation profile of well 14-28-8-31W1, un-named Souris Valley
pool area.
13. Preliminary Estimation of the Oil Reserves within Identified TZ/ROZ
Pool*
OOIP in MPZ (MMbl)
adopted from GeoSCOUT database
OIP in TZ/ROZ (MMbls)
Bellegarde Tilston 13.8 7.7
Frys Tilston-Souris Valley 36.4 20.6
Rosebank Alida 126.4 61
Total 176.6 89.3
Estimates of OIP of TZ/ROZ
* The un-named Souris Valley pool is not included because necessary pool information
(such as producing area) is not available.
14. Discussions and Conclusions
• The basin underwent post-entrapment uplifts (Olajide and Bend, in press) and hydrodynamic flows
(Palombi, 2010) that may induce changes of the geological conditions of existing oil pools, and thus
create ROZ.
• 4 pools with TZ/ROZ potential are identified and the thickness of identified TZ/ROZ is up to 47
meters. Evidences include log-based oil saturation profiles, fluorescence tests, cores from possible
TZ/ROZ, sulfur water and tilted OWC.
• The OIP of TZ/ROZs was estimated to be approximately half the amount of the oil within the
associated MPZs.
• No conclusive interpretation can be made on the origin of the identified TZ/ROZ, although tilted
OWCs, sulfur water, dissolutions and “inversed” oil saturation profile may imply that the identified oil
bearing zones are possibly ROZ related to water flows.
• There may be other ROZs undiscovered.