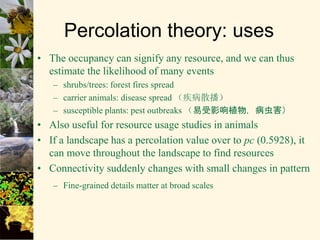
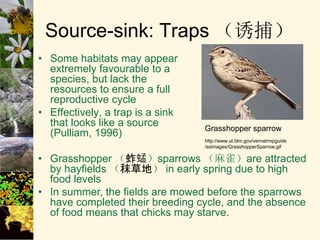
6. Percolation theory
• The number & size of lattices (格子) are related to P
(probability of a cell being occupied by the target species
(目标物种)
Gardner et al, 1992
P = 0.4 (no percolation)
49 clusters
Largest cluster = 18
cells
P = 0.6 (some percolation)
17 clusters
Largest cluster = 163
cells
P = 0.8 (fully
percolated)
1 clusters
Largest cluster = 320
cells
• From this we can calculate landscape boundaries (total &
inner edges) – useful for edge effect assessment in
conservation.
7.
8. Percolation theory: uses
• The occupancy can signify any resource, and we can thus
estimate the likelihood of many events
– shrubs/trees: forest fires spread
– carrier animals: disease spread (疾病散播)
– susceptible plants: pest outbreaks (易受影响植物,病虫害)
• Also useful for resource usage studies in animals
• If a landscape has a percolation value over to pc (0.5928), it
can move throughout the landscape to find resources
• Connectivity suddenly changes with small changes in pattern
– Fine-grained details matter at broad scales
9.
10. Source-sink model
• Patch in the landscape maybe a source or sink in terms
of different ecological processes.
• We can define the source and sink to quantify certain
flow of different objects.
• Individuals will tend to move from sources to sinks to
avoid overpopulation of their areas
• Patch quality is often related to size – the source effect is
greater for large patches with increased per capita
production.
• Long-term studies needed to determine whether a patch
is source or sink.
11. Source-sink: Traps (诱捕)
• Some habitats may appear
extremely favourable to a
species, but lack the
resources to ensure a full
reproductive cycle
• Effectively, a trap is a sink
that looks like a source
(Pulliam, 1996)
• Grasshopper (蚱蜢)sparrows (麻雀)are attracted
by hayfields (秣草地) in early spring due to high
food levels
• In summer, the fields are mowed before the sparrows
have completed their breeding cycle, and the absence
of food means that chicks may starve.
Grasshopper sparrow
http://www.ut.blm.gov/vernalrmpguide
/ssimages/GrasshopperSparrow.gif
12. Missing carbon sink
• For years, one of the biggest mysteries in climate science has
been the question of what ultimately happens to the carbon
emitted by motor vehicles, factories, deforestation, and other
sources.
• Of the approximately 8 billion tons of carbon emitted each year,
about 40 percent accumulates in the atmosphere and about 30
percent is absorbed by the oceans.
• Scientists believe that terrestrial ecosystems, especially trees,
take up the remainder. But where?
• Carbon capture and storage
• Carbon sequestration
13. Source-sink model
• Carbon—sink loss
• Results suggest that Chinese forests released about 0.68 petagram
(十亿吨) of carbon between 1949 and 1980.
• Carbon storage increased significantly after the late 1970s from
4.38 to 4.75 petagram of carbon by 1998, mainly due to forest
expansion and regrowth.
• Since the mid-1970s, planted forests (afforestation and
reforestation) have sequestered 0.45 petagram of carbon.
• This suggested that carbon sequestration through forest
management practices addressed in the Kyoto Protocol could help
offset industrial carbon dioxide emissions.
----Science,22 JUNE 2001 VOL 292
13
14. The concepts of “source” and “sink” could be employed to
the research of landscape pattern and ecological processes.
The main contents includes:
• (1) In the research of pattern and process, different
landscape types can be divided into two kinds of
landscape, “source” landscape and “sink” landscape.
“Source” landscape is a landscape type which contributes
positively to the development of the ecological process,
while a “sink” landscape is one which is unhelpful to the
development of the ecological process.
Source-sink landscape theory and its ecological significance
Liding CHEN , Bojie FU, Wenwu ZHAO
15. Source-sink landscape theory and its ecological significance
Liding CHEN , Bojie FU, Wenwu ZHAO
• (2) “Source” landscape and “sink” landscape are
recognized with regard to the special ecological process. If
the studied ecological process were changed, “source”
landscape could become “sink” landscape. Therefore, the
ecological process should be clarified before “source” or
“sink” landscape were defined.
• (3) The key point to distinguish “source” landscape from
“sink” landscape is to identify the effect of landscape on
ecological process. The positive effect is made by
“source” landscape, and the negative effect is made by
“sink” landscape.
16. • (4) For the same ecological process, different “source”
landscapes have different positive effects, and different “sink”
landscapes have different negative effects. It is required to
determine the weight of different landscape types on ecological
processes.
• (5) Source-sink principle could be applied to non-point source
pollution control, biologic diversity protection, heat island
effect of city, and so on. For the different study area, the
landscape evaluation models need be built respectively, because
different ecological process is corresponding with different
source-sink landscape and evaluation model.
• The source-sink principle will be helpful for the further study of
landscape pattern and ecological process, and can give a base
for designing landscape indices.
Source-sink landscape theory and its ecological significance
Liding CHEN , Bojie FU, Wenwu ZHAO
17. Summary
• Organism–space interaction:
• Hierarchy theory: all systems and processes in a landscape are
components of higher-level systems
• Island biogeography: The number of species on an island is a
function of island size and proximity to the main population body
• Metapopulation: locally dynamic but regionally stable population.
Migration between fragments may allow species to repopulate areas
after local extinctions
• Diffusion theory: in a homogeneous landscape, population
dispersion is related to the population growth rate and the rate at
which it can move
• Percolation theory: in a fragmented landscape, movement rate is
related to the integrity of the landscape. Over a critical threshold,
organisms can move freely through the landscape.
• Source: Area with a net surplus of individuals, from which
migration occurs; Sink: Area with net deficit in the growth rate that
receives immigrants.
18. References
• O’Neill, R.V., Milne, B.T., Turner, M.G. & Garnder, R.I.I. (1988)
Resource utilization and landscape pattern. Landscape Ecology
2:63-69.
• Turner, M.G., Gardner, R.H. & O’Neill, R.V. (2001) Landscape
Ecology in Theory and Practice: Pattern and Process. Springer-
Verlag, New York 401pp.
• Farina, A. (1998) Principles and Methods in Landscape Ecology.
Chapman & Hall, London
• MacArthur, R.H. & Wilson, E.O. (1967) The Theory of Island
Biogeography. Princeton University Press, Oxford, UK
• Hanski, I. (1981) Coexistence of competitors in patchy
environments with and without predation. Oikos 37:306-312
• Toft, C.A. & Schoener, T.W. (1983) Perspectives on Landscape
Ecology. Proceedings of the International Congress of the
Netherlands Society for Landscape Ecology. PUDOC, Wageningen,
The Netherlands
• Turner, M.G., Gardner, R.H. & O’Neill, R.V. (2001) Landscape
Ecology in Theory and Practice: Pattern and Process. Springer-
Verlag, New York 401pp