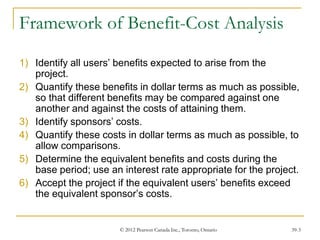
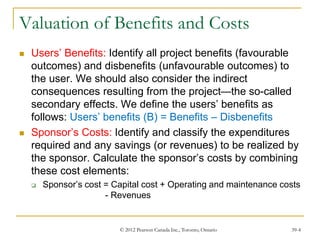
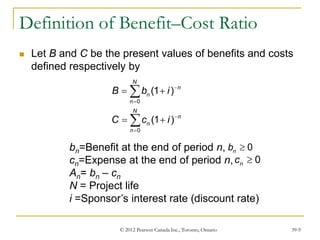
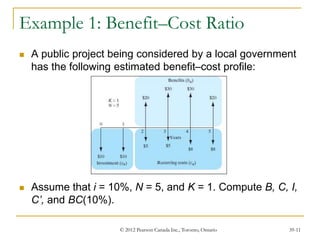
© 2012 Pearson Canada Inc., Toronto, Ontario 39-1
Economic Analysis in
the Public Sector and
Benefit-Cost Ratios
© 2012 Pearson Canada Inc., Toronto, Ontario 39-2
Benefit-Cost Analysis
 Benefit-cost analysis is commonly used to evaluate
public projects.
 Benefits of a nonmonetary nature need to be
quantified in dollar terms as much as possible and
factored into the analysis.
© 2012 Pearson Canada Inc., Toronto, Ontario 39-3
Framework of Benefit-Cost Analysis
1) Identify all users’ benefits expected to arise from the
project.
2) Quantify these benefits in dollar terms as much as possible,
so that different benefits may be compared against one
another and against the costs of attaining them.
3) Identify sponsors’ costs.
4) Quantify these costs in dollar terms as much as possible, to
allow comparisons.
5) Determine the equivalent benefits and costs during the
base period; use an interest rate appropriate for the project.
6) Accept the project if the equivalent users’ benefits exceed
the equivalent sponsor’s costs.
© 2012 Pearson Canada Inc., Toronto, Ontario 39-4
Valuation of Benefits and Costs
 Users’ Benefits: Identify all project benefits (favourable
outcomes) and disbenefits (unfavourable outcomes) to
the user. We should also consider the indirect
consequences resulting from the project—the so-called
secondary effects. We define the users’ benefits as
follows: Users’ benefits (B) = Benefits – Disbenefits
 Sponsor’s Costs: Identify and classify the expenditures
required and any savings (or revenues) to be realized by
the sponsor. Calculate the sponsor’s costs by combining
these cost elements:
 Sponsor’s cost = Capital cost + Operating and maintenance costs
- Revenues
© 2012 Pearson Canada Inc., Toronto, Ontario 39-5
Valuation of Benefits and Costs
 Social Discount Rate: Two views of the basis for
determining the social discount rate prevail:
1. Projects without private counterparts. The social
discount rate should reflect only the prevailing
government borrowing rate.
2. Projects with private counterparts. The social discount
rate should represent the rate that could have been
earned had the funds not been removed from the private
sector.
© 2012 Pearson Canada Inc., Toronto, Ontario 39-6
Quantifying Benefits and Costs
 We can illustrate the process of quantifying the benefits and
costs associated with provincial inspection systems for motor
vehicles.
 Users’ Benefits
 Primary benefits. Deaths and injuries related to motor-vehicle accidents
impose financial costs on individuals and society. Preventing such costs
through the inspection program has the following primary benefits:
1. Retention of contributions to society that might be lost due to an
individual’s death.
2. Retention of productivity that might be lost while an individual
recuperates from an accident.
3. Savings of medical, legal, and insurance services.
4. Savings on property replacement or repair costs.
© 2012 Pearson Canada Inc., Toronto, Ontario 39-7
Quantifying Benefits and Costs
 Users’ Benefits
 Secondary benefits. Some secondary benefits are not measurable (e.g.,
the avoidance of pain and suffering); others can be quantified. Both
types of benefits should be considered. A list of secondary benefits is as
follows:
1. Savings of income of families and friends of accident victims who might
otherwise be tending to the victims.
2. Avoidance of air and noise pollution and savings on fuel costs.
3. Savings on enforcement and administrative costs related to the
investigation of accidents.
4. Avoidance of pain and suffering.
© 2012 Pearson Canada Inc., Toronto, Ontario 39-8
Quantifying Benefits and Costs
 Users’ Disbenefits
1. Cost of spending time to have a vehicle inspected (including travel time), as
opposed to devoting that time to an alternative endeavour (opportunity cost).
2. Cost of inspection fees.
3. Cost of repairs that would not have been made if the inspection had not been
performed.
4. Value of time expended in repairing the vehicle (including travel time).
5. Cost in time and direct payment for reinspection.
 Sponsor’s Costs
1. Capital investments in inspection facilities.
2. Operating and maintenance costs associated with inspection facilities.
(These include all direct and indirect labour, personnel, and administrative
costs.)
 Sponsor’s Revenues or Savings
1. Inspection fee
© 2012 Pearson Canada Inc., Toronto, Ontario 39-9
Definition of Benefit–Cost Ratio
 Let B and C be the present values of benefits and costs
defined respectively by
0
0
(1 )
(1 )
N
n
n
n
N
n
n
n
B b i
C c i




 
 


bn=Benefit at the end of period n,
cn=Expense at the end of period n,
An= bn – cn
N = Project life
i =Sponsor’s interest rate (discount rate)
0
n
b 
0
n
c 
© 2012 Pearson Canada Inc., Toronto, Ontario 39-10
0
1
(1 )
' (1 )
The / ratio is defined as
( ) , ' 0
'
K
n
n
n
N
n
n
n K
I c i
C c i
B C
B B
BC i I C
C I C



 
 
 
   



Equivalent capital investment
at n = 0
Equivalent O&M costs
at n = 0
Sponsor’s Cost
© 2012 Pearson Canada Inc., Toronto, Ontario 39-11
Example 1: Benefit–Cost Ratio
 A public project being considered by a local government
has the following estimated benefit–cost profile:
 Assume that i = 10%, N = 5, and K = 1. Compute B, C, I,
C’, and BC(10%).
© 2012 Pearson Canada Inc., Toronto, Ontario 39-12
Example 1: Solution
= $20( / , 10%, 2) + $30( / , 1%, 3)
+$30( / , 10%, 4) + $20( / , 10%, 5)
= $71.98
= $10 + $10( / , 10%, 1) + $5( / , 10%, 2) + $5( / , 10%, 3)
+ $8( / , 10%, 4)+ $8( / , 10%, 5)
=$37.41
= $10 + $10(
B P F P F
P F P F
C P F P F P F
P F P F
I P
 
/ , 10%, 1)
= $19.09
’ = –
= $18.3
71.98
10% 1.92 1, Accept the project.
$19.09 $18.32
F
C C I
BC   

© 2012 Pearson Canada Inc., Toronto, Ontario 39-13
Incremental Analysis Based on BC(i)
1. If one or more alternatives have B/C ratios greater than unity,
eliminate any alternatives with a B/C ratio less than unity.
2. Arrange the remaining alternatives in increasing order of the
denominator (I + C’). the alternative with the smallest
denominator should be the first (j), the alternative with the
second smallest denominator should be second (k), and so
forth.
3. Compute the incremental differences for each term (B, I, and
C’) for the paired alternatives ( j, k) in the list:
' ' '
k j
k J
k j
B B B
I I I
C C C
  
  
  
© 2012 Pearson Canada Inc., Toronto, Ontario 39-14
Incremental Analysis Based on BC(i) (continued)
4. Compute the BC(i) on incremental investment by evaluating
If BC(i)k-j > 1, select alternative k.
5. Compare the alternative selected with the next one on the list
by computing the incremental benefit–cost ratio. Continue the
process until you reach the bottom of the list. The alternative
selected during the last pairing is the best one.
6. If ΔI + ΔC’ = 0, we cannot use the benefit-cost ratio. When
this happens, just select the project with the largest B value.
7. In situations where public projects with unequal service lives
are to be compared, compute all component values (B, I, and
C’) on an annual basis.
( )
'
k j
B
BC i
I C



  
© 2012 Pearson Canada Inc., Toronto, Ontario 39-15
Example 2: Incremental Benefit-Cost
Ratios
 Consider three investment projects: A1, A2, and A3. Each project
has the same service life, and the present worth of each component
value (B, I, and C’) is computed at 10% as follows:
a) If all three projects are independent, which would be selected on
the basis of BC(i)?
b) If the three projects are mutually exclusive, which would be the best
alternative?
A1 A2 A3
I $5,000 $20,000 $14,000
B 12,000 35,000 21,000
C’ 4,000 8,000 1,000
PW(i) $3,000 $7,000 $6,000
© 2012 Pearson Canada Inc., Toronto, Ontario 39-16
Example 2: Solution (a)
 Since PW(i)1 , PW(i)2, and PW(i)3 are positive, all of the
projects are acceptable if they are independent. Also, the
BC(i) values for each project are greater than unity, so
the use of the benefit–cost ratio criterion leads to the
same accept/reject conclusion as does the NPW
criterion:
A1 A2 A3
BC(i) 1.33 1.25 1.40
© 2012 Pearson Canada Inc., Toronto, Ontario 39-17
Example 2: Solution (b)
 Arrange the projects in increasing order of their
denominators (I + C’) for the BC(i) criterion
Ranking Base A1 A3 A2
I +C’ $9,000 $15,000 $28,000
2 3
$35,000 $21
,000
( )
($20,000 $14,000) ($8,000 $1
,000)
1.08 1
, select A2.
BC i 


  
 
3 1
$21
,000 $12,000
( )
($14,000 $5,000) ($1
,000 $4,000)
1.5 1
, select A3.
BC i 


  
 
© 2012 Pearson Canada Inc., Toronto, Ontario 39-18
Summary
Benefit–cost analysis is commonly used to evaluate public
projects. Several facets unique to public-project analysis
are neatly addressed by benefit–cost analysis. An
alternative way of expressing the worthiness of a public
project is to compare the user’s benefits (B) with the
sponsor’s cost (C) by taking the ratio B/C.

Chapter_13.ppt

  • 1.
    © 2012 PearsonCanada Inc., Toronto, Ontario 39-1 Economic Analysis in the Public Sector and Benefit-Cost Ratios
  • 2.
    © 2012 PearsonCanada Inc., Toronto, Ontario 39-2 Benefit-Cost Analysis  Benefit-cost analysis is commonly used to evaluate public projects.  Benefits of a nonmonetary nature need to be quantified in dollar terms as much as possible and factored into the analysis.
  • 3.
    © 2012 PearsonCanada Inc., Toronto, Ontario 39-3 Framework of Benefit-Cost Analysis 1) Identify all users’ benefits expected to arise from the project. 2) Quantify these benefits in dollar terms as much as possible, so that different benefits may be compared against one another and against the costs of attaining them. 3) Identify sponsors’ costs. 4) Quantify these costs in dollar terms as much as possible, to allow comparisons. 5) Determine the equivalent benefits and costs during the base period; use an interest rate appropriate for the project. 6) Accept the project if the equivalent users’ benefits exceed the equivalent sponsor’s costs.
  • 4.
    © 2012 PearsonCanada Inc., Toronto, Ontario 39-4 Valuation of Benefits and Costs  Users’ Benefits: Identify all project benefits (favourable outcomes) and disbenefits (unfavourable outcomes) to the user. We should also consider the indirect consequences resulting from the project—the so-called secondary effects. We define the users’ benefits as follows: Users’ benefits (B) = Benefits – Disbenefits  Sponsor’s Costs: Identify and classify the expenditures required and any savings (or revenues) to be realized by the sponsor. Calculate the sponsor’s costs by combining these cost elements:  Sponsor’s cost = Capital cost + Operating and maintenance costs - Revenues
  • 5.
    © 2012 PearsonCanada Inc., Toronto, Ontario 39-5 Valuation of Benefits and Costs  Social Discount Rate: Two views of the basis for determining the social discount rate prevail: 1. Projects without private counterparts. The social discount rate should reflect only the prevailing government borrowing rate. 2. Projects with private counterparts. The social discount rate should represent the rate that could have been earned had the funds not been removed from the private sector.
  • 6.
    © 2012 PearsonCanada Inc., Toronto, Ontario 39-6 Quantifying Benefits and Costs  We can illustrate the process of quantifying the benefits and costs associated with provincial inspection systems for motor vehicles.  Users’ Benefits  Primary benefits. Deaths and injuries related to motor-vehicle accidents impose financial costs on individuals and society. Preventing such costs through the inspection program has the following primary benefits: 1. Retention of contributions to society that might be lost due to an individual’s death. 2. Retention of productivity that might be lost while an individual recuperates from an accident. 3. Savings of medical, legal, and insurance services. 4. Savings on property replacement or repair costs.
  • 7.
    © 2012 PearsonCanada Inc., Toronto, Ontario 39-7 Quantifying Benefits and Costs  Users’ Benefits  Secondary benefits. Some secondary benefits are not measurable (e.g., the avoidance of pain and suffering); others can be quantified. Both types of benefits should be considered. A list of secondary benefits is as follows: 1. Savings of income of families and friends of accident victims who might otherwise be tending to the victims. 2. Avoidance of air and noise pollution and savings on fuel costs. 3. Savings on enforcement and administrative costs related to the investigation of accidents. 4. Avoidance of pain and suffering.
  • 8.
    © 2012 PearsonCanada Inc., Toronto, Ontario 39-8 Quantifying Benefits and Costs  Users’ Disbenefits 1. Cost of spending time to have a vehicle inspected (including travel time), as opposed to devoting that time to an alternative endeavour (opportunity cost). 2. Cost of inspection fees. 3. Cost of repairs that would not have been made if the inspection had not been performed. 4. Value of time expended in repairing the vehicle (including travel time). 5. Cost in time and direct payment for reinspection.  Sponsor’s Costs 1. Capital investments in inspection facilities. 2. Operating and maintenance costs associated with inspection facilities. (These include all direct and indirect labour, personnel, and administrative costs.)  Sponsor’s Revenues or Savings 1. Inspection fee
  • 9.
    © 2012 PearsonCanada Inc., Toronto, Ontario 39-9 Definition of Benefit–Cost Ratio  Let B and C be the present values of benefits and costs defined respectively by 0 0 (1 ) (1 ) N n n n N n n n B b i C c i           bn=Benefit at the end of period n, cn=Expense at the end of period n, An= bn – cn N = Project life i =Sponsor’s interest rate (discount rate) 0 n b  0 n c 
  • 10.
    © 2012 PearsonCanada Inc., Toronto, Ontario 39-10 0 1 (1 ) ' (1 ) The / ratio is defined as ( ) , ' 0 ' K n n n N n n n K I c i C c i B C B B BC i I C C I C                 Equivalent capital investment at n = 0 Equivalent O&M costs at n = 0 Sponsor’s Cost
  • 11.
    © 2012 PearsonCanada Inc., Toronto, Ontario 39-11 Example 1: Benefit–Cost Ratio  A public project being considered by a local government has the following estimated benefit–cost profile:  Assume that i = 10%, N = 5, and K = 1. Compute B, C, I, C’, and BC(10%).
  • 12.
    © 2012 PearsonCanada Inc., Toronto, Ontario 39-12 Example 1: Solution = $20( / , 10%, 2) + $30( / , 1%, 3) +$30( / , 10%, 4) + $20( / , 10%, 5) = $71.98 = $10 + $10( / , 10%, 1) + $5( / , 10%, 2) + $5( / , 10%, 3) + $8( / , 10%, 4)+ $8( / , 10%, 5) =$37.41 = $10 + $10( B P F P F P F P F C P F P F P F P F P F I P   / , 10%, 1) = $19.09 ’ = – = $18.3 71.98 10% 1.92 1, Accept the project. $19.09 $18.32 F C C I BC    
  • 13.
    © 2012 PearsonCanada Inc., Toronto, Ontario 39-13 Incremental Analysis Based on BC(i) 1. If one or more alternatives have B/C ratios greater than unity, eliminate any alternatives with a B/C ratio less than unity. 2. Arrange the remaining alternatives in increasing order of the denominator (I + C’). the alternative with the smallest denominator should be the first (j), the alternative with the second smallest denominator should be second (k), and so forth. 3. Compute the incremental differences for each term (B, I, and C’) for the paired alternatives ( j, k) in the list: ' ' ' k j k J k j B B B I I I C C C         
  • 14.
    © 2012 PearsonCanada Inc., Toronto, Ontario 39-14 Incremental Analysis Based on BC(i) (continued) 4. Compute the BC(i) on incremental investment by evaluating If BC(i)k-j > 1, select alternative k. 5. Compare the alternative selected with the next one on the list by computing the incremental benefit–cost ratio. Continue the process until you reach the bottom of the list. The alternative selected during the last pairing is the best one. 6. If ΔI + ΔC’ = 0, we cannot use the benefit-cost ratio. When this happens, just select the project with the largest B value. 7. In situations where public projects with unequal service lives are to be compared, compute all component values (B, I, and C’) on an annual basis. ( ) ' k j B BC i I C      
  • 15.
    © 2012 PearsonCanada Inc., Toronto, Ontario 39-15 Example 2: Incremental Benefit-Cost Ratios  Consider three investment projects: A1, A2, and A3. Each project has the same service life, and the present worth of each component value (B, I, and C’) is computed at 10% as follows: a) If all three projects are independent, which would be selected on the basis of BC(i)? b) If the three projects are mutually exclusive, which would be the best alternative? A1 A2 A3 I $5,000 $20,000 $14,000 B 12,000 35,000 21,000 C’ 4,000 8,000 1,000 PW(i) $3,000 $7,000 $6,000
  • 16.
    © 2012 PearsonCanada Inc., Toronto, Ontario 39-16 Example 2: Solution (a)  Since PW(i)1 , PW(i)2, and PW(i)3 are positive, all of the projects are acceptable if they are independent. Also, the BC(i) values for each project are greater than unity, so the use of the benefit–cost ratio criterion leads to the same accept/reject conclusion as does the NPW criterion: A1 A2 A3 BC(i) 1.33 1.25 1.40
  • 17.
    © 2012 PearsonCanada Inc., Toronto, Ontario 39-17 Example 2: Solution (b)  Arrange the projects in increasing order of their denominators (I + C’) for the BC(i) criterion Ranking Base A1 A3 A2 I +C’ $9,000 $15,000 $28,000 2 3 $35,000 $21 ,000 ( ) ($20,000 $14,000) ($8,000 $1 ,000) 1.08 1 , select A2. BC i         3 1 $21 ,000 $12,000 ( ) ($14,000 $5,000) ($1 ,000 $4,000) 1.5 1 , select A3. BC i        
  • 18.
    © 2012 PearsonCanada Inc., Toronto, Ontario 39-18 Summary Benefit–cost analysis is commonly used to evaluate public projects. Several facets unique to public-project analysis are neatly addressed by benefit–cost analysis. An alternative way of expressing the worthiness of a public project is to compare the user’s benefits (B) with the sponsor’s cost (C) by taking the ratio B/C.