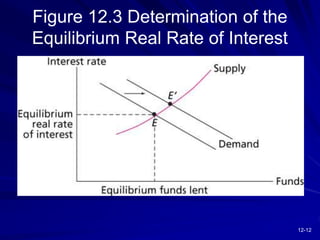
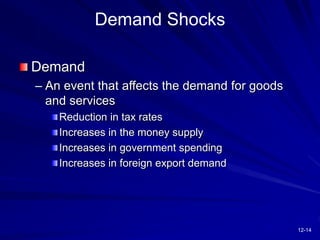
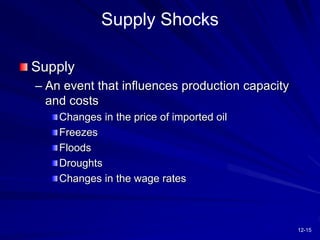
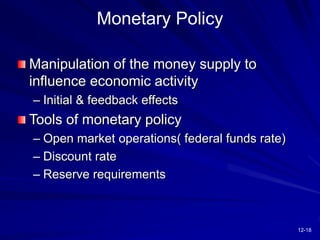
McGraw-Hill/Irwin © 2008 The McGraw-Hill Companies, Inc., All Rights Reserved.
Macroeconomic and
Industry Analysis
CHAPTER 12
12-2
Framework of Analysis
Fundamental Analysis
Approach to Fundamental Analysis
– Domestic and global economic analysis
– Industry analysis
– Company analysis
Why use the top-down approach
12-3
12.1 THE GLOBAL ECONOMY
12-4
Global Economic Considerations
Performance in countries and regions is
highly variable
Political risk
Exchange rate risk
– Sales
– Profits
– Stock returns
12-5
Table 12.1 Economic Performance, 2006
12-6
Figure 12.1 Change in Real Exchange
Rate: Dollar Versus Major Currencies.
1999-2006
12-7
12.2 THE DOMESTIC MACROECONOMY
12-8
Key Economic Variables
Gross domestic product
Employment
Inflation
Interest rates
Budget Deficits
Consumer sentiment
12-9
Figure 12.2 S&P 500
Versus EPS Estimate
12-10
12.3 INTEREST RATES
12-11
Factors Determining the Level of Interest
Rates
Supply of funds from savers
Demand for funds from businesses
Government’s net supply and/or demand
for funds
Expected rate of inflation
12-12
Figure 12.3 Determination of the
Equilibrium Real Rate of Interest
12-13
12.4 DEMAND AND SUPPLY SHOCKS
12-14
Demand Shocks
Demand
– An event that affects the demand for goods
and services
Reduction in tax rates
Increases in the money supply
Increases in government spending
Increases in foreign export demand
12-15
Supply Shocks
Supply
– An event that influences production capacity
and costs
Changes in the price of imported oil
Freezes
Floods
Droughts
Changes in the wage rates
12-16
12.5 FEDERAL GOVERNMENT
POLICY
12-17
Fiscal Policy
Government spending and taxing actions
– Direct policy
– Slowly implemented
12-18
Monetary Policy
Manipulation of the money supply to
influence economic activity
– Initial & feedback effects
Tools of monetary policy
– Open market operations( federal funds rate)
– Discount rate
– Reserve requirements
12-19
Supply-Side Policies
Supply-siders focus on incentives and
marginal tax rates
Lowering tax rates will
– elicit more investment
– Improve incentives to work
12-20
12. 6 BUSINESS CYCLES
12-21
The Business Cycle
Recurring patterns of recession and
recovery—business cycles
– Peak
– Trough
Industry relationship to business cycles
– Cyclical
– Defensive
12-22
Leading Indicators - tend to rise and fall
in advance of the economy
Examples
– Avg. weekly hours of production workers
– Stock Prices
– Initial claims for unemployment
– Manufacturer’s new orders
Economic Indicators
12-23
Coincident Indicators - indicators that tend
to change directly with the economy
Examples
– Industrial production
– Manufacturing and trade sales
Economic Indicators (cont)
12-24
Lagging Indicators - indicators that tend
to follow the lag economic performance
Examples
– Ratio of trade inventories to sales
– Ratio of consumer installment credit
outstanding to personal income
Economic Indicators (cont)
12-25
Figure 12.6 Economic Calendar at Yahoo!
12-26
12.7 INDUSTRYANALYSIS
12-27
Industry Analysis
Performance can vary widely across
industries
ROE can range from 10.6% for electronic
equipment to 29.2% for the cigarette
industry
12-28
Figure 12.7 Return on Equity
12-29
Figure 12.8 Industry Stock Price
Performance, 2006
12-30
Defining an Industry
Where to draw the line between one
industry and another
– Money-center banks: Variation by
Size
Focus
region
12-31
Figure 12.9 ROE of Major Banks, 2007
12-32
North American Industry Classification
System or NAICS Codes
Codes assigned to group firms for
statistical analysis
Industry classifications are never perfect
12-33
Sensitivity to Business Cycle
Factors affecting sensitivity of earnings to
business cycles
– Sensitivity of sales of the firm’s product to the
business cycles
– Operating leverage
– Financial leverage
12-34
Figure 12.10 Industry Cyclicality
12-35
Figure 12.11 A Stylized Depiction
of the Business Cycle
12-36
Sector Rotation
Selecting Industries in line with the stage
of the business cycle
Peak – natural resource firms
Contraction – defensive firms
Trough – equipment, transportation and
construction firms
Expanding – cyclical industries
12-37
Industry Life Cycles
Stage Sales Growth
Start-up Rapid & Increasing
Consolidation Stable
Maturity Slowing
Relative Decline Minimal or Negative
12-38
Figure 12.12 The Industry Life Cycle
12-39
Industry Structure and Performance
Threat of Entry
Rivalry between existing competitors
Pressure from substitute products
Bargaining power of buyers
Bargaining power of suppliers

Chapter_012.ppt