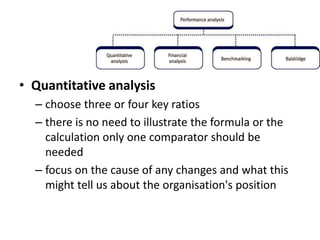
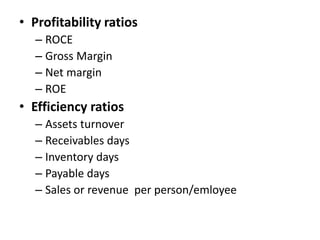
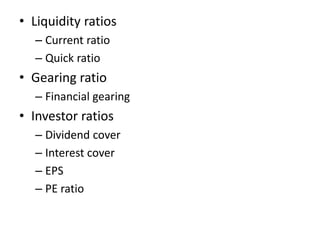
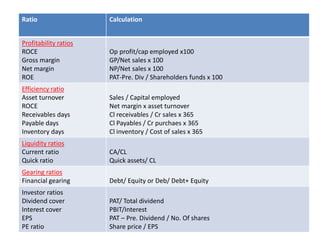
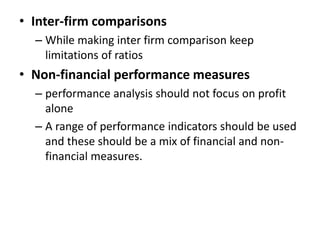
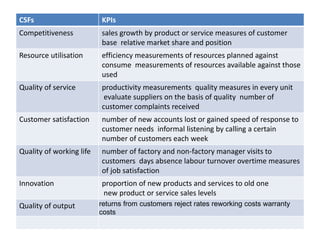
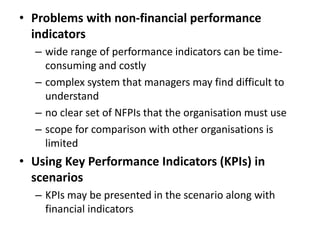
Chapter 4
Performance Analysis
This chapter covers the following:
1. Quantitative analysis
2. Financial Analysis
3. Benchmarking
4. Baldrige model
• Quantitative analysis
– choose three or four key ratios
– there is no need to illustrate the formula or the
calculation only one comparator should be
needed
– focus on the cause of any changes and what this
might tell us about the organisation's position
• Profitability ratios
– ROCE
– Gross Margin
– Net margin
– ROE
• Efficiency ratios
– Assets turnover
– Receivables days
– Inventory days
– Payable days
– Sales or revenue per person/emloyee
• Liquidity ratios
– Current ratio
– Quick ratio
• Gearing ratio
– Financial gearing
• Investor ratios
– Dividend cover
– Interest cover
– EPS
– PE ratio
Ratio Calculation
Profitability ratios
ROCE
Gross margin
Net margin
ROE
Op profit/cap employed x100
GP/Net sales x 100
NP/Net sales x 100
PAT-Pre. Div / Shareholders funds x 100
Efficiency ratio
Asset turnover
ROCE
Receivables days
Payable days
Inventory days
Sales / Capital employed
Net margin x asset turnover
Cl receivables / Cr sales x 365
Cl Payables / Cr purchaes x 365
Cl inventory / Cost of sales x 365
Liquidity ratios
Current ratio
Quick ratio
CA/CL
Quick assets/ CL
Gearing ratios
Financial gearing Debt/ Equity or Deb/ Debt+ Equity
Investor ratios
Dividend cover
Interest cover
EPS
PE ratio
PAT/ Total dividend
PBIT/Interest
PAT – Pre. Dividend / No. Of shares
Share price / EPS
• Inter-firm comparisons
– While making inter firm comparison keep
limitations of ratios
• Non-financial performance measures
– performance analysis should not focus on profit
alone
– A range of performance indicators should be used
and these should be a mix of financial and non-
financial measures.
CSFs KPIs
Competitiveness sales growth by product or service measures of customer
base relative market share and position
Resource utilisation efficiency measurements of resources planned against
consume measurements of resources available against those
used
Quality of service productivity measurements quality measures in every unit
evaluate suppliers on the basis of quality number of
customer complaints received
Customer satisfaction number of new accounts lost or gained speed of response to
customer needs informal listening by calling a certain
number of customers each week
Quality of working life number of factory and non-factory manager visits to
customers days absence labour turnover overtime measures
of job satisfaction
Innovation proportion of new products and services to old one
new product or service sales levels
Quality of output returns from customers reject rates reworking costs warranty
costs
• Problems with non-financial performance
indicators
– wide range of performance indicators can be time-
consuming and costly
– complex system that managers may find difficult to
understand
– no clear set of NFPIs that the organisation must use
– scope for comparison with other organisations is
limited
• Using Key Performance Indicators (KPIs) in
scenarios
– KPIs may be presented in the scenario along with
financial indicators
2. Benchmarking
• Why benchmark?
– Benchmarking is the process of systematic comparison
of a service, practice or process.
– Its use is to provide a target for action in order to
improve competitive position.
• The strategic role of benchmarking
– In strategic analysis it can be used in value chain
analysis to compare one company's values to another
– In making strategic choices
– In putting strategy into action
– There will be links between benchmarking, critical
success factors (CSFs) and key performance indicators
(KPIs).
• Types of benchmarking
– Internal benchmarking
– Competitive benchmarking
– Generic benchmarking
• Benefits and dangers of benchmarking
– The main benefits include:
• improved understanding of environmental pressures
• improved competitive position
• a creative process of change
• a target to motivate and improve operations
• increased rate of organisational learning
– Dangers of benchmarking
• not always reveal the reasons for good/poor performance
• benchmarking exercise can appear to threaten staff
3. Multi variable performance analysis
– Organisations should combine financial and non-
financial performance measures in order to
provide a broader view of the organisation’s
performance and position. There are different
tools one such tool is
• The balanced scorecard
– This suggests that appraise performance from four
perspectives
• a financial perspective
• a customer perspective
• an innovation perspective
• an internal business process perspective
• Baldrige performance excellence
– This was developed by Malcom Baldrige as a way of
measuring and rewarding those organisations that
have performed better than their contemporaries
– The Baldrige model assesses across seven categories
• Leadership
• Strategy
• Customers
• Workforce
• Operations
• Results
• Measurement, analysis, and knowledge management
• https://docs.google.com/forms/d/e/1FAIpQLS
eSURtv5fq0NDW5ZSZJ15jw9aaZhTImfxlrU1hy
OmJz3iOD0w/viewform?usp=pp_url

Chapter 4 Performance analysis.pptx

  • 1.
    Chapter 4 Performance Analysis Thischapter covers the following: 1. Quantitative analysis 2. Financial Analysis 3. Benchmarking 4. Baldrige model
  • 2.
    • Quantitative analysis –choose three or four key ratios – there is no need to illustrate the formula or the calculation only one comparator should be needed – focus on the cause of any changes and what this might tell us about the organisation's position
  • 3.
    • Profitability ratios –ROCE – Gross Margin – Net margin – ROE • Efficiency ratios – Assets turnover – Receivables days – Inventory days – Payable days – Sales or revenue per person/emloyee
  • 4.
    • Liquidity ratios –Current ratio – Quick ratio • Gearing ratio – Financial gearing • Investor ratios – Dividend cover – Interest cover – EPS – PE ratio
  • 5.
    Ratio Calculation Profitability ratios ROCE Grossmargin Net margin ROE Op profit/cap employed x100 GP/Net sales x 100 NP/Net sales x 100 PAT-Pre. Div / Shareholders funds x 100 Efficiency ratio Asset turnover ROCE Receivables days Payable days Inventory days Sales / Capital employed Net margin x asset turnover Cl receivables / Cr sales x 365 Cl Payables / Cr purchaes x 365 Cl inventory / Cost of sales x 365 Liquidity ratios Current ratio Quick ratio CA/CL Quick assets/ CL Gearing ratios Financial gearing Debt/ Equity or Deb/ Debt+ Equity Investor ratios Dividend cover Interest cover EPS PE ratio PAT/ Total dividend PBIT/Interest PAT – Pre. Dividend / No. Of shares Share price / EPS
  • 6.
    • Inter-firm comparisons –While making inter firm comparison keep limitations of ratios • Non-financial performance measures – performance analysis should not focus on profit alone – A range of performance indicators should be used and these should be a mix of financial and non- financial measures.
  • 7.
    CSFs KPIs Competitiveness salesgrowth by product or service measures of customer base relative market share and position Resource utilisation efficiency measurements of resources planned against consume measurements of resources available against those used Quality of service productivity measurements quality measures in every unit evaluate suppliers on the basis of quality number of customer complaints received Customer satisfaction number of new accounts lost or gained speed of response to customer needs informal listening by calling a certain number of customers each week Quality of working life number of factory and non-factory manager visits to customers days absence labour turnover overtime measures of job satisfaction Innovation proportion of new products and services to old one new product or service sales levels Quality of output returns from customers reject rates reworking costs warranty costs
  • 8.
    • Problems withnon-financial performance indicators – wide range of performance indicators can be time- consuming and costly – complex system that managers may find difficult to understand – no clear set of NFPIs that the organisation must use – scope for comparison with other organisations is limited • Using Key Performance Indicators (KPIs) in scenarios – KPIs may be presented in the scenario along with financial indicators
  • 9.
    2. Benchmarking • Whybenchmark? – Benchmarking is the process of systematic comparison of a service, practice or process. – Its use is to provide a target for action in order to improve competitive position. • The strategic role of benchmarking – In strategic analysis it can be used in value chain analysis to compare one company's values to another – In making strategic choices – In putting strategy into action – There will be links between benchmarking, critical success factors (CSFs) and key performance indicators (KPIs).
  • 10.
    • Types ofbenchmarking – Internal benchmarking – Competitive benchmarking – Generic benchmarking • Benefits and dangers of benchmarking – The main benefits include: • improved understanding of environmental pressures • improved competitive position • a creative process of change • a target to motivate and improve operations • increased rate of organisational learning – Dangers of benchmarking • not always reveal the reasons for good/poor performance • benchmarking exercise can appear to threaten staff
  • 11.
    3. Multi variableperformance analysis – Organisations should combine financial and non- financial performance measures in order to provide a broader view of the organisation’s performance and position. There are different tools one such tool is • The balanced scorecard – This suggests that appraise performance from four perspectives • a financial perspective • a customer perspective • an innovation perspective • an internal business process perspective
  • 12.
    • Baldrige performanceexcellence – This was developed by Malcom Baldrige as a way of measuring and rewarding those organisations that have performed better than their contemporaries – The Baldrige model assesses across seven categories • Leadership • Strategy • Customers • Workforce • Operations • Results • Measurement, analysis, and knowledge management
  • 13.