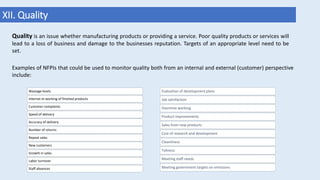
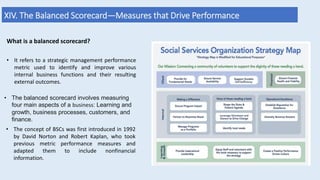
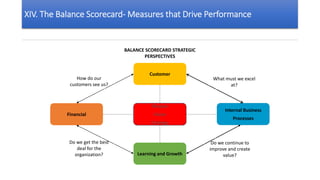
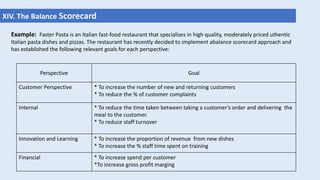
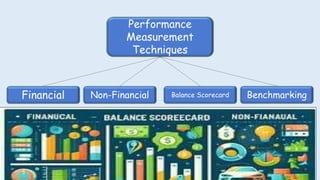
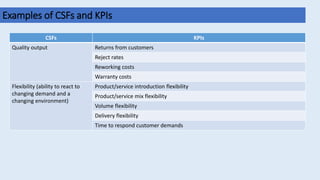
This document discusses various techniques for measuring business performance, including financial and non-financial metrics. It describes key performance indicators that can measure critical success factors like competitiveness, quality, innovation, and customer satisfaction. Financial measures discussed include return on capital employed, return on sales, gross margin, and liquidity ratios like the current ratio and acid test ratio. Non-financial factors that can affect performance are also summarized, such as economic conditions, government regulations, and differences between private and public sector organizations.


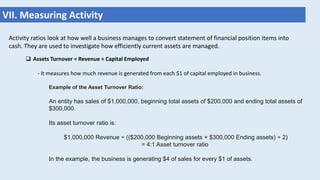
![VIII. Measuring Risk
Capital Gearing (leverage)
- This ratio calculates the relationship between borrowed capital (debt) and owner’s capital (equity).
- Example: In order to fund a new project, ABC Inc. finds that
it is unable to sell new shares to equity investors at a
reasonable price. Instead, ABC looks to the debt market and
secures a USD $15,000,000 loan with one year to maturity. At
present, ABC Inc. has $2,000,000 of equity value.
*** The gearing ratio would thus be 7.5x—[$15 million in total
debt + equity, divided by $2 million in shareholders' equity]. ABC
would certainly be considered a highly geared firm.
Capital Gearing = non-current liabilities (debt) ÷ ordinary shareholders funds (equity) %](https://image.slidesharecdn.com/performancemeasurement20240306-240312060901-ab0b8f15/85/Performance-measurement_____________________________-21-320.jpg)