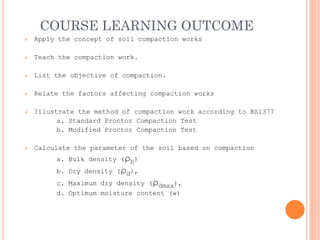
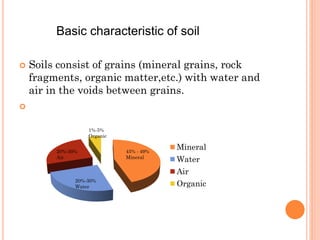
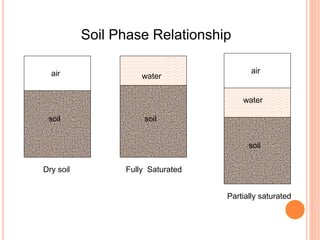
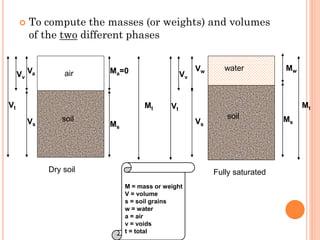
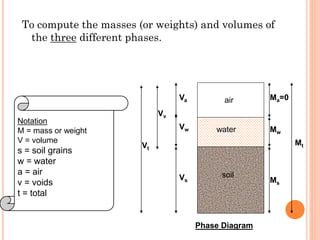
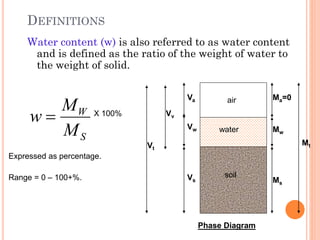
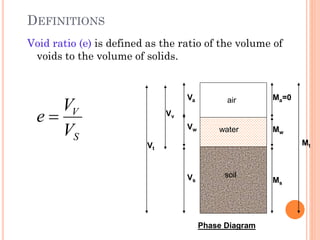
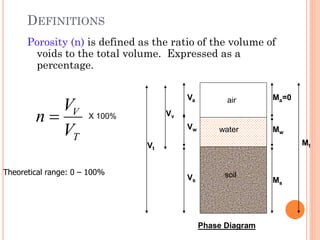
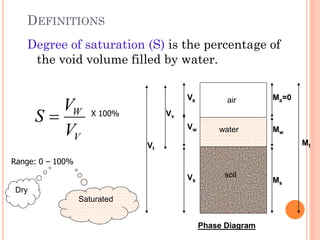
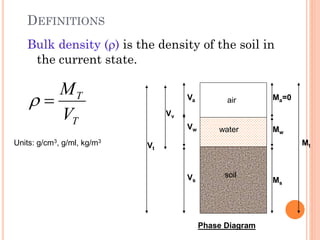
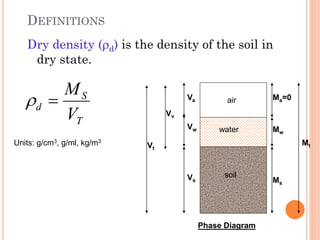
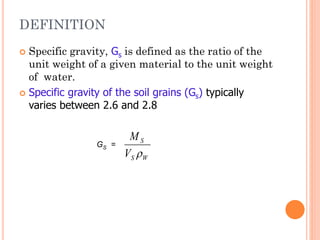
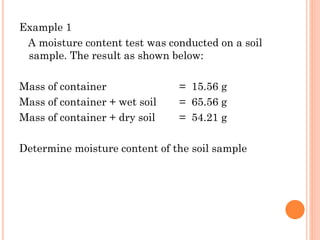
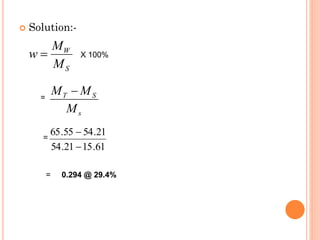
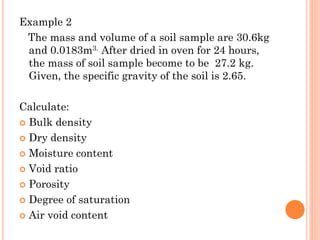
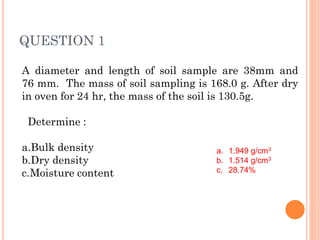
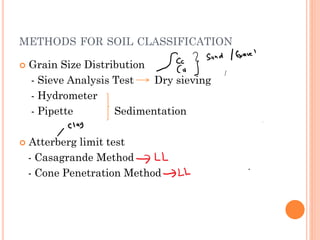
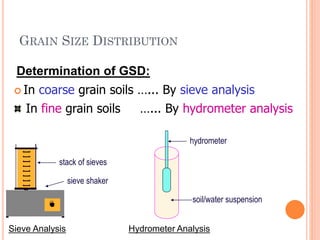
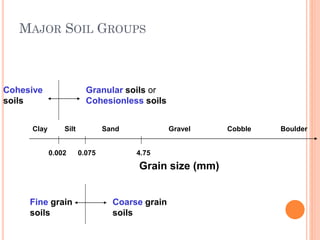
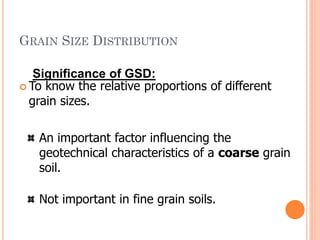
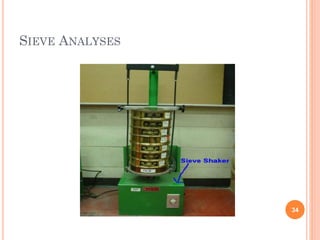
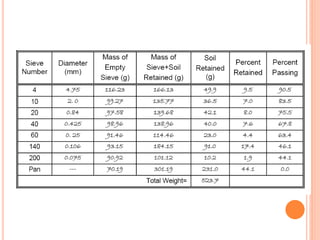
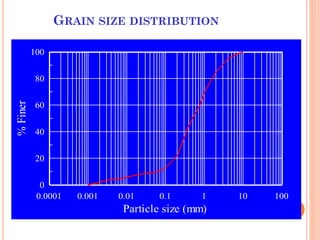
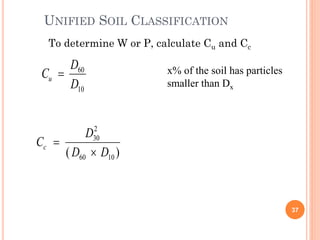
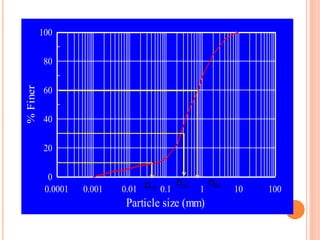
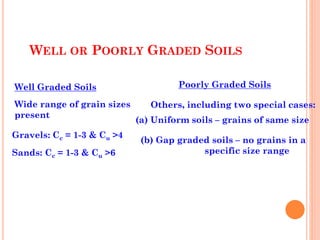
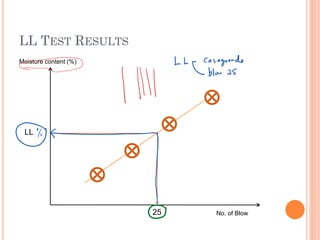
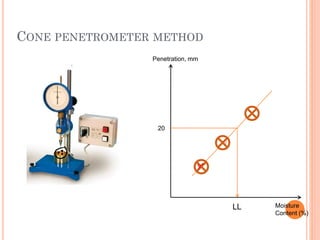
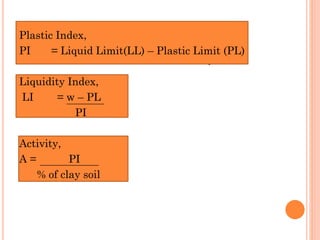
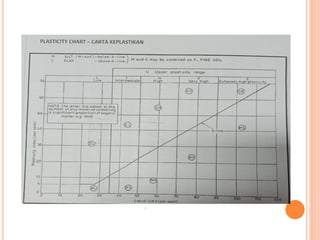
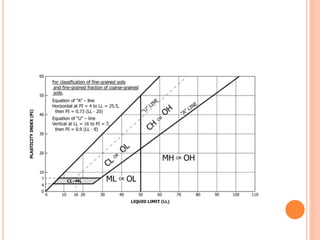
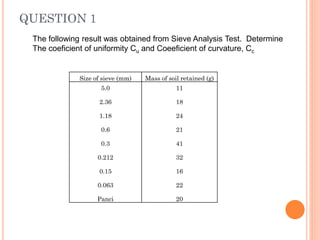
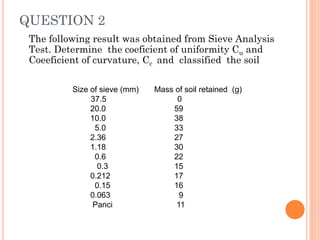
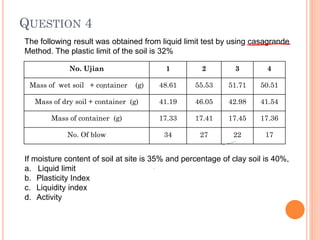
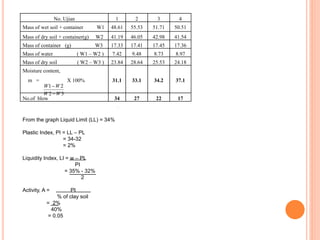
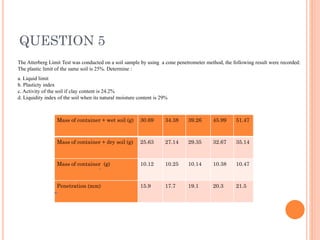
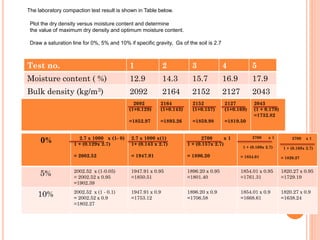
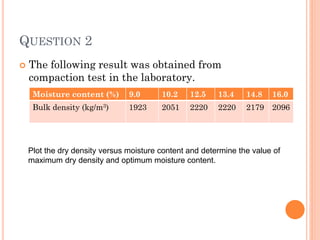
CHAPTER 3
BASIC CHARACTERISTIC OF SOIL
COURSE LEARNING OUTCOME
➢ Understand basic characteristics of soils
➢ Explain the characteristic of soil
a. Phase relationship of the soil
b. Phase relationship in compaction work.
➢ Calculate the soil properties
a. Bulk density (ρb)
b. Saturated density (ρsaturated)
c. Dry density (ρd)
d. Dry unit weight ( Îłd )
e. Moisture content (w)
f. Void ratio (e)
g. Porosity (n)
h. Degree of saturation (Sr)
i. Air ratio (Ar)
j. Specific gravity (Gs)
COURSE LEARNING OUTCOME
➢ Learn the following methods for soil classification
➢ Explain soil particle size analysis
a. Wet Sieve
b. Dry sieve
➢ Construct soil particle distribution curve.
➢ Identify various characteristics of uniform gradation curves, non uniform
gradation and well and poorly graded soil and effective size (D10), (D30),
(D60).
➢ Calculate coefficient of uniformity (Cu) and coefficient of curvature(Cc).
➢ Define Atterberg Limits
a. Plastic Limit (PL)
b. Liquid Limit (LL)
c. Shrinkage Limit (SL)
➢ Compute the PL and LL using Casagrande Method and Cone Penetration Test to
calculate the Plasticity Index (PI), Liquid Index (LI), Activity Index(A).
➢ Identify the classification of soil based on USCS (Unified Soil Classification
System) and BSCS (British Soil Classification System).
COURSE LEARNING OUTCOME
➢ Apply the concept of soil compaction works
➢ Teach the compaction work.
➢ List the objective of compaction.
➢ Relate the factors affecting compaction works
➢ Illustrate the method of compaction work according to BS1377
a. Standard Proctor Compaction Test
b. Modified Proctor Compaction Test
➢ Calculate the parameter of the soil based on compaction
a. Bulk density (ρb)
b. Dry density (ρd),
c. Maximum dry density (ρdmax),
d. Optimum moisture content (w)
 Soils consist of grains (mineral grains, rock
fragments, organic matter,etc.) with water and
air in the voids between grains.

Basic characteristic of soil
Mineral
Water
Air
Organic
45% - 49%
Mineral
20%-30%
Water
20%-30%
Air
1%-5%
Organic
Soil Phase Relationship
air
soil
water
soil
soil
air
water
Dry soil Fully Saturated
Partially saturated
 To compute the masses (or weights) and volumes
of the two different phases
air
soil
water
soil
Va
Vs Vs
Vw
Ma=0
Ms
Ms
Mw
Mt
Mt Vt
Vt
Dry soil Fully saturated
M = mass or weight
V = volume
s = soil grains
w = water
a = air
v = voids
t = total
Vv Vv
To compute the masses (or weights) and volumes of
the three different phases.
8
soil
air
water
Vs
Va Ma=0
Ms
Mw
Mt
Vw
Vv
Vt
Phase Diagram
Notation
M = mass or weight
V = volume
s = soil grains
w = water
a = air
v = voids
t = total
DEFINITIONS
Water content (w) is also referred to as water content
and is defined as the ratio of the weight of water to
the weight of solid.
9
soil
air
water
Vs
Va Ma=0
Ms
Mw
Mt
Vw
Vv
Vt
Phase Diagram
S
W
M
M
w =
Expressed as percentage.
Range = 0 – 100+%.
X 100%
DEFINITIONS
Void ratio (e) is defined as the ratio of the volume of
voids to the volume of solids.
10
soil
air
water
Vs
Va Ma=0
Ms
Mw
Mt
Vw
Vv
Vt
Phase Diagram
S
V
V
V
e =
DEFINITIONS
Porosity (n) is defined as the ratio of the volume of
voids to the total volume. Expressed as a
percentage.
11
soil
air
water
Vs
Va Ma=0
Ms
Mw
Mt
Vw
Vv
Vt
Phase Diagram
T
V
V
V
n = X 100%
Theoretical range: 0 – 100%
DEFINITIONS
Degree of saturation (S) is the percentage of
the void volume filled by water.
12
soil
air
water
Vs
Va Ma=0
Ms
Mw
Mt
Vw
Vv
Vt
Phase Diagram
V
W
V
V
S =
Range: 0 – 100%
X 100%
Dry
Saturated
DEFINITIONS
Bulk density () is the density of the soil in
the current state.
13
soil
air
water
Vs
Va Ma=0
Ms
Mw
Mt
Vw
Vv
Vt
Phase Diagram
T
T
V
M
=

Units: g/cm3, g/ml, kg/m3
Air void content, A =
T
a
V
V
Air void content (A) is defined as the ratio of the
volume of air to the total volume. Expressed as a
percentage.
soil
air
water
Vs
Va Ma=0
Ms
Mw
Mt
Vw
Vv
Vt
X 100%
DEFINITIONS
Saturated density (sat) is the density of the
soil when the voids are filled with water.
15
Submerged density (’) is the effective density
of the soil when it is submerged.
’ = sat - w
DEFINITIONS
Dry density (d) is the density of the soil in
dry state.
16
soil
air
water
Vs
Va Ma=0
Ms
Mw
Mt
Vw
Vv
Vt
Phase Diagram
T
S
d
V
M
=

Units: g/cm3, g/ml, kg/m3
DEFINITION
 Specific gravity, Gs is defined as the ratio of the
unit weight of a given material to the unit weight
of water.
 Specific gravity of the soil grains (Gs) typically
varies between 2.6 and 2.8
W
S
S
V
M

GS =
Example 1
A moisture content test was conducted on a soil
sample. The result as shown below:
Mass of container = 15.56 g
Mass of container + wet soil = 65.56 g
Mass of container + dry soil = 54.21 g
Determine moisture content of the soil sample
 Solution:-
S
W
M
M
w = X 100%
s
S
T
M
M
M −
61
.
15
21
.
54
21
.
54
55
.
65
−
−
=
=
= 0.294 @ 29.4%
Example 2
The mass and volume of a soil sample are 30.6kg
and 0.0183m3. After dried in oven for 24 hours,
the mass of soil sample become to be 27.2 kg.
Given, the specific gravity of the soil is 2.65.
Calculate:
 Bulk density
 Dry density
 Moisture content
 Void ratio
 Porosity
 Degree of saturation
 Air void content
QUESTION 1
A diameter and length of soil sample are 38mm and
76 mm. The mass of soil sampling is 168.0 g. After dry
in oven for 24 hr, the mass of the soil is 130.5g.
Determine :
a.Bulk density
b.Dry density
c.Moisture content
a. 1.949 g/cm3
b. 1.514 g/cm3
c. 28.74%
QUESTION 2
The mass and volume of a soil are 290 kg and 0.15
m3. After dried in oven the mass of the soil is
250 kg. If specific gravity,GS of the soil is 2.65,
Determine:-
 Moisture content
 Dry density
 Void ratio
 Porosity
a. 16%
b. 1666.67kg/m3
c. 0.591
d. 37.13%
QUESTION 3
A dry soil has a volume of 30.0 ml. A porosity and
specific gravity are 35% and 2.73.
Determine :-
 Dry density
 Void ratio
 Air void content a. 1.775 g/ml
b. 0.5385
c. 35%
QUESTION 4
A fully saturated soil has a volume 40.5 ml and
mass 59.2g. After dried in oven, the mass of the
soil is 48.3g. The specific graity of the soil is 2.7.
Determine:-
a. Bulk density
b. Moisture content
c. Void ratio
d. Porosity.
a. 1.4g/ml
b. 22.57%
c. 1.264
d. 55.83%
QUESTION 5
The mass of the soil sample is 23g. After dried in
oven for 24 hr the mass of the soil is 20g. Dry
density of the soil is 1.67 g/ml.
Determine:-
a. Void ratio
b. Porosity
c. Air void content
Given Spesific gravity of the soil is 2.68
a. 0.605
b. 37.68%
c. 12.63%
QUESTION 6
The following data was obtained from moisture content
test conducted on fully saturated soil.
Mass of container = 27.35 g
Mass of container + wet soil = 58.25
Mass of container + dry soil = 50.55 g
Determine:-
a. Moisture content
b. Void ratio
c. Bulk density
d. Dry density
Given, the Specific gravity of the soil is 2.7.
a. 33.19%
b. 0.896
c. 1.897g/ml
d. 1.424g/ml
QUESTION 7
A undistubed soil sample was taken from the proposed construction
site. The following data was obtained from the soil sample.
Volume of the soil = 1.664 X 10⁻³ m3
Mass of container = 1.864 kg
Mass of container + wet soil = 5.018 kg
Mass of container + dry soil = 4.328
Given, GS = 2.69,
Determine;-
a. Bulk density
b. Dry density
c. Moisture content
d. Void ratio
e. Porosity
f. Degree of saturation
g. Air void content
a. 1895.43kg/m3
b. 1480.77kg/m3
c. 28%
d. 0.817
e. 44.95%
f. 92.25%
g. 3.49%
CHAPTER 2
BASIC CHARACTERISTIS OF SOIL
CC304 GEOTECHNICS1
METHODS FOR SOIL CLASSIFICATION
 Grain Size Distribution
- Sieve Analysis Test Dry sieving
- Hydrometer
- Pipette Sedimentation
 Atterberg limit test
- Casagrande Method
- Cone Penetration Method
GRAIN SIZE DISTRIBUTION
 In coarse grain soils …... By sieve analysis
30
Determination of GSD:
In fine grain soils …... By hydrometer analysis
Sieve Analysis Hydrometer Analysis
soil/water suspension
hydrometer
stack of sieves
sieve shaker
GRAIN SIZE DISTRIBUTION
- SIEVE ANALYSIS TEST
• This test is performed to determine the percentage of
different grain sizes contained within a soil.
• The mechanical or sieve analysis is performed to
determine the distribution of the coarser, larger-sized
particles, and the hydrometer method is used to
determine the distribution of the finer particles.
• The distribution of different grain sizes affects the
engineering properties of soil.
• Grain size analysis provides the grain size distribution,
and it is required in classifying the soil.
MAJOR SOIL GROUPS
32
0.002 4.75
0.075
Grain size (mm)
Boulder
Clay Silt Sand Gravel Cobble
Fine grain
soils
Coarse grain
soils
Granular soils or
Cohesionless soils
Cohesive
soils
GRAIN SIZE DISTRIBUTION
 To know the relative proportions of different
grain sizes.
33
An important factor influencing the
geotechnical characteristics of a coarse grain
soil.
Not important in fine grain soils.
Significance of GSD:
SIEVE ANALYSES
34
35
36
GRAIN SIZE DISTRIBUTION
0.0001 0.001 0.01 0.1 1 10 100
0
20
40
60
80
100
Particle size (mm)
%
Finer
37
UNIFIED SOIL CLASSIFICATION
To determine W or P, calculate Cu and Cc
C
D
D
u = 60
10
C
D
D D
c =

30
2
60 10
( )
x% of the soil has particles
smaller than Dx
0.0001 0.001 0.01 0.1 1 10 100
0
20
40
60
80
100
Particle size (mm)
%
Finer
D60
D30
D10
WELL OR POORLY GRADED SOILS
39
Well Graded Soils Poorly Graded Soils
Wide range of grain sizes
present
Gravels: Cc = 1-3 & Cu >4
Sands: Cc = 1-3 & Cu >6
Others, including two special cases:
(a) Uniform soils – grains of same size
(b) Gap graded soils – no grains in a
specific size range
ATTERBERG LIMITS
40
Border line water contents, separating the
different states of a fine grained soil
Liquid
limit
Shrinkage
limit
Plastic
limit
0
water content
liquid
semi-
solid
brittle-
solid
plastic
41
Atterberg limit test is to determine the
plastic and liquid limits of a fine grained
soil. The Atterberg limits are based on the
moisture content of the soil.
Shrinkage limit Plastic limit Liquid limit
Moisture content ( %)
solid semisolid
plastic liquid
 The plastic limit: is the moisture content that
defines where the soil changes from a semi-solid
to a plastic (flexible) state.
 The liquid limit: is the moisture content that
defines where the soil changes from a plastic to a
viscous fluid state.
 Shrinkage limit : is the moisture content that
define where the soil change from solid to
semisolid state.
ATTERBERG LIMITS
 Casagrande Method
LL TEST RESULTS
Moisture content (%)
No. of Blow
LL
25
45
Plastic Limit
The minimum water content at which a soil will
just begin to crumble when it is rolled into a
thread of approximately 3 mm in diameter.
CONE PENETROMETER METHOD
20
Penetration, mm
Moisture
Content (%)
LL
Plastic Index,
PI = Liquid Limit(LL) – Plastic Limit (PL)
Liquidity Index,
LI = w – PL
PI
Activity,
A = PI
% of clay soil
QUESTION 1
Size of sieve (mm) Mass of soil retained (g)
5.0
2.36
1.18
0.6
0.3
0.212
0.15
0.063
Panci
11
18
24
21
41
32
16
22
20
The following result was obtained from Sieve Analysis Test. Determine
The coeficient of uniformity Cu and Coeeficient of curvature, Cc
QUESTION 2
The following result was obtained from Sieve Analysis
Test. Determine the coeficient of uniformity Cu and
Coeeficient of curvature, Cc and classified the soil
Size of sieve (mm) Mass of soil retained (g)
37.5 0
20.0 59
10.0 38
5.0 33
2.36 27
1.18 30
0.6 22
0.3 15
0.212 17
0.15 16
0.063 9
Panci 11
QUESTION 4
No. Ujian 1 2 3 4
Mass of wet soil + container (g) 48.61 55.53 51.71 50.51
Mass of dry soil + container (g) 41.19 46.05 42.98 41.54
Mass of container (g) 17.33 17.41 17.45 17.36
No. Of blow 34 27 22 17
The following result was obtained from liquid limit test by using casagrande
Method. The plastic limit of the soil is 32%
If moisture content of soil at site is 35% and percentage of clay soil is 40%,
a. Liquid limit
b. Plasticity Index
c. Liquidity index
d. Activity
No. Ujian 1 2 3 4
Mass of wet soil + container W1 48.61 55.53 51.71 50.51
Mass of dry soil + container(g) W2 41.19 46.05 42.98 41.54
Mass of container (g) W3 17.33 17.41 17.45 17.36
Mass of water ( W1 – W2 ) 7.42 9.48 8.73 8.97
Mass of dry soil ( W2 – W3 ) 23.84 28.64 25.53 24.18
Moisture content,
m = X 100% 31.1 33.1 34.2 37.1
No.of blow 34 27 22 17
3
2
2
1
W
W
W
W
−
−
From the graph Liquid Limit (LL) = 34%
Plastic Index, PI = LL – PL
= 34-32
= 2%
Liquidity Index, LI = w – PL
PI
= 35% - 32%
2
Activity, A = PI
% of clay soil
= 2%
40%
= 0.05
QUESTION 5
Mass of container + wet soil (g) 30.69 34.38 39.26 45.99 51.47
Mass of container + dry soil (g) 25.63 27.14 29.35 32.67 35.14
Mass of container (g) 10.12 10.25 10.14 10.38 10.47
Penetration (mm) 15.9 17.7 19.1 20.3 21.5
The Atterberg Limit Test was conducted on a soil sample by using a cone penetrometer method, the following result were recorded:
The plastic limit of the same soil is 25%. Determine :
a. Liquid limit
b. Plasticty index
c. Activity of the soil if clay content is 24.2%
d. Liquidity index of the soil when its natural moisture content is 29%
SOLUTION:
i. From the graph, Liquid limit (LL) = 57%
ii. Plasticity Index, PI = LL – PL = 57 – 25 = 32%
iii. Activity of the soil, A = PI / % of clay
= 32 / 24.2
= 1.32
iv. Liquidity index, LI = (w – PL) / PI
= (29 – 25) / 32
= 0.125
Moisture content (%) 32.6 42.9 51.6 59.8 66.2
Penetration (mm) 15.9 17.7 19.1 20.3 21.5
COMPACTION
•Definition:
Compaction is a process that brings about an
increase in soil density or unit weight, accompanied
by a decrease in air volume. There is usually no
change in water content
•The degree of compaction is measured by dry unit
weight and depends on the water content and
compactive effort (weight of hammer, number of
impacts, weight of roller, number of passes).
•the maximum dry unit weight occurs at an
optimum water content
• Compaction is employed in the construction of
road bases, runways, earth dams, embankments
and reinforced earth walls. In some cases,
compaction may be used to prepare a level
surface for building construction.
OBJECTIVE OF COMPACTION
 Compaction can be applied to improve the
properties of an existing soil or in the process of
placing fill.
 The main objectives are to:
 increase shear strength and therefore bearing
capacity
 increase stiffness and therefore reduce future
settlement
 decrease voids ratio and so permeability, thus
reducing potential frost heave
FACTOR AFFECTING COMPACTION
 Nature and type of soil, i.e. sand or clay, grading,
plasticity
 Water content at the time of compaction
 Site conditions, e.g. weather, type of site, layer
thickness
 Compactive effort: type of plant (weight,
vibration, number of passes)
Effect of soil type
 Well-graded granular soils can be compacted to higher
densities than uniform or silty soils.
 Clays of high plasticity may have water contents over 30%
and achieve similar densities (and therefore strengths) to
those of lower plasticity with water contents below 20%.
 As the % of fines and the plasticity of a soil increases, the
compaction curve becomes flatter and therefore less
sensitive to moisture content. Equally, the maximum dry
density will be relatively low.
Effect of water content
 Moisture content is important in soil compaction.
 If the water content of the soil is low, the soil is
difficult to compacted.
 By increasing the water content of the soil it
improve the workability of compaction process.
 If water content exceed the optimum moisture
content, the soil particles are separately
Effect of increased compactive effort
 The compactive effort will be greater when using
a heavier roller on site or a heavier rammer in
the laboratory. With greater compactive effort:
- maximum dry density increases
- optimum water content decreases
- air-voids content remains almost the same.
Soil Compaction in the Lab:
Standard Proctor Test Modified Proctor Test
Soil Compaction in the Lab:
1- Standard Proctor Test
ASTM D-698 or AASHTO T-99
2- Modified Proctor Test
ASTM D-1557 or AASHTO T-180
Energy = 12,375 foot-pounds per cubic foot
Energy = 56,520 foot-pounds per cubic foot
Moisture
Content
Dry Density
gd max
Compaction
Curve for Standard
Proctor
(OMC)
gd max
Zero Air Void Curve
Sr < 100%
Zero Air Void Curve
Sr =100%
Zero Air Void Curve
Sr = 60%
Compaction
Curve for
Modified
Proctor
DRY-DENSITY/WATER-CONTENT
RELATIONSHIP
• The maximum dry density occurs at an
optimum water content
• The curve is drawn with axes of dry density and
water content and the controlling values are
values read off:
- ρd(max) = maximum dry density
- wopt = optimum water content
• Different curves are obtained for different
compactive efforts
Bulk
density, 
(Mg/mÂł)
1.84 2.00 2.10 2.12 2.09 2.05
Water
content, w
0.084 0.106 0.129 0.144 0.166 0.186
Dry
density, d
(Mg/mÂł)
1.70 1.81 1.86 1.851 1.79 1.73
EXAMPLE 1
Based on the data given, determine:
a. the maximum dry density and optimum moisture content
QUESTION 1
a. Described compaction in term of civil
engineering disciplines
b. Described THREE (3) factors affecting
compaction
c. The laboratory compaction test result is shown
in Table below.
Test no. 1 2 3 4 5
Moisture content ( %) 12.9 14.3 15.7 16.9 17.9
Bulk density (kg/m3) 2092 2164 2152 2127 2043
Plot the dry density versus moisture content and determine
the value of maximum dry density and optimum moisture content
Test no. 1 2 3 4 5
Moisture content ( %) 12.9 14.3 15.7 16.9 17.9
Bulk density (kg/m3) 2092 2164 2152 2127 2043
Test no. 1 2 3 4 5
Moisture content ( %) 12.9 14.3 15.7 16.9 17.9
Bulk density (kg/m3) 2092 2164 2152 2127 2043
The laboratory compaction test result is shown in Table below.
2092
(1+0.129)
=1852.97
2164
(1+0.143)
=1893.26
2152
(1+0.157)
=1859.98
2127
(1+0.169)
=1819.50
2043
(1 + 0.179)
=1732.82
0% 2.7 x 1000 x (1- 0)
1 + (0.129x 2.7)
= 2002.52
2.7 x 1000 x(1)
1+ (0.143 x 2.7)
= 1947.91
2700 x 1
1 + (0.157x 2.7)
= 1896.20
2700 x 1
1 + (0.169x 2.7)
= 1854.01
2700 x 1
1 + (0.169x 2.7)
= 1820.27
5% 2002.52 x (1-0.05)
= 2002.52 x 0.95
=1902.39
1947.91 x 0.95
=1850.51
1896.20 x 0.95
=1801.40
1854.01 x 0.95
=1761.31
1820.27 x 0.95
=1729.19
10% 2002.52 x (1 - 0.1)
= 2002.52 x 0.9
=1802.27
1947.91 x 0.9
=1753.12
1896.20 x 0.9
=1706.58
1854.01 x 0.9
=1668.61
1820.27 x 0.9
=1638.24
Plot the dry density versus moisture content and determine
the value of maximum dry density and optimum moisture content.
Draw a saturation line for 0%, 5% and 10% if specific gravity, Gs of the soil is 2.7
QUESTION 2
 The following result was obtained from
compaction test in the laboratory.
Moisture content (%) 9.0 10.2 12.5 13.4 14.8 16.0
Bulk density (kg/m3) 1923 2051 2220 2220 2179 2096
Plot the dry density versus moisture content and determine the value of
maximum dry density and optimum moisture content.

chapter 3 -basic characteristic of soil-print.pdf

  • 1.
  • 2.
    COURSE LEARNING OUTCOME ➢Understand basic characteristics of soils ➢ Explain the characteristic of soil a. Phase relationship of the soil b. Phase relationship in compaction work. ➢ Calculate the soil properties a. Bulk density (ρb) b. Saturated density (ρsaturated) c. Dry density (ρd) d. Dry unit weight ( γd ) e. Moisture content (w) f. Void ratio (e) g. Porosity (n) h. Degree of saturation (Sr) i. Air ratio (Ar) j. Specific gravity (Gs)
  • 3.
    COURSE LEARNING OUTCOME ➢Learn the following methods for soil classification ➢ Explain soil particle size analysis a. Wet Sieve b. Dry sieve ➢ Construct soil particle distribution curve. ➢ Identify various characteristics of uniform gradation curves, non uniform gradation and well and poorly graded soil and effective size (D10), (D30), (D60). ➢ Calculate coefficient of uniformity (Cu) and coefficient of curvature(Cc). ➢ Define Atterberg Limits a. Plastic Limit (PL) b. Liquid Limit (LL) c. Shrinkage Limit (SL) ➢ Compute the PL and LL using Casagrande Method and Cone Penetration Test to calculate the Plasticity Index (PI), Liquid Index (LI), Activity Index(A). ➢ Identify the classification of soil based on USCS (Unified Soil Classification System) and BSCS (British Soil Classification System).
  • 4.
    COURSE LEARNING OUTCOME ➢Apply the concept of soil compaction works ➢ Teach the compaction work. ➢ List the objective of compaction. ➢ Relate the factors affecting compaction works ➢ Illustrate the method of compaction work according to BS1377 a. Standard Proctor Compaction Test b. Modified Proctor Compaction Test ➢ Calculate the parameter of the soil based on compaction a. Bulk density (ρb) b. Dry density (ρd), c. Maximum dry density (ρdmax), d. Optimum moisture content (w)
  • 5.
     Soils consistof grains (mineral grains, rock fragments, organic matter,etc.) with water and air in the voids between grains.  Basic characteristic of soil Mineral Water Air Organic 45% - 49% Mineral 20%-30% Water 20%-30% Air 1%-5% Organic
  • 6.
  • 7.
     To computethe masses (or weights) and volumes of the two different phases air soil water soil Va Vs Vs Vw Ma=0 Ms Ms Mw Mt Mt Vt Vt Dry soil Fully saturated M = mass or weight V = volume s = soil grains w = water a = air v = voids t = total Vv Vv
  • 8.
    To compute themasses (or weights) and volumes of the three different phases. 8 soil air water Vs Va Ma=0 Ms Mw Mt Vw Vv Vt Phase Diagram Notation M = mass or weight V = volume s = soil grains w = water a = air v = voids t = total
  • 9.
    DEFINITIONS Water content (w)is also referred to as water content and is defined as the ratio of the weight of water to the weight of solid. 9 soil air water Vs Va Ma=0 Ms Mw Mt Vw Vv Vt Phase Diagram S W M M w = Expressed as percentage. Range = 0 – 100+%. X 100%
  • 10.
    DEFINITIONS Void ratio (e)is defined as the ratio of the volume of voids to the volume of solids. 10 soil air water Vs Va Ma=0 Ms Mw Mt Vw Vv Vt Phase Diagram S V V V e =
  • 11.
    DEFINITIONS Porosity (n) isdefined as the ratio of the volume of voids to the total volume. Expressed as a percentage. 11 soil air water Vs Va Ma=0 Ms Mw Mt Vw Vv Vt Phase Diagram T V V V n = X 100% Theoretical range: 0 – 100%
  • 12.
    DEFINITIONS Degree of saturation(S) is the percentage of the void volume filled by water. 12 soil air water Vs Va Ma=0 Ms Mw Mt Vw Vv Vt Phase Diagram V W V V S = Range: 0 – 100% X 100% Dry Saturated
  • 13.
    DEFINITIONS Bulk density ()is the density of the soil in the current state. 13 soil air water Vs Va Ma=0 Ms Mw Mt Vw Vv Vt Phase Diagram T T V M =  Units: g/cm3, g/ml, kg/m3
  • 14.
    Air void content,A = T a V V Air void content (A) is defined as the ratio of the volume of air to the total volume. Expressed as a percentage. soil air water Vs Va Ma=0 Ms Mw Mt Vw Vv Vt X 100%
  • 15.
    DEFINITIONS Saturated density (sat)is the density of the soil when the voids are filled with water. 15 Submerged density (’) is the effective density of the soil when it is submerged. ’ = sat - w
  • 16.
    DEFINITIONS Dry density (d)is the density of the soil in dry state. 16 soil air water Vs Va Ma=0 Ms Mw Mt Vw Vv Vt Phase Diagram T S d V M =  Units: g/cm3, g/ml, kg/m3
  • 17.
    DEFINITION  Specific gravity,Gs is defined as the ratio of the unit weight of a given material to the unit weight of water.  Specific gravity of the soil grains (Gs) typically varies between 2.6 and 2.8 W S S V M  GS =
  • 18.
    Example 1 A moisturecontent test was conducted on a soil sample. The result as shown below: Mass of container = 15.56 g Mass of container + wet soil = 65.56 g Mass of container + dry soil = 54.21 g Determine moisture content of the soil sample
  • 19.
     Solution:- S W M M w =X 100% s S T M M M − 61 . 15 21 . 54 21 . 54 55 . 65 − − = = = 0.294 @ 29.4%
  • 20.
    Example 2 The massand volume of a soil sample are 30.6kg and 0.0183m3. After dried in oven for 24 hours, the mass of soil sample become to be 27.2 kg. Given, the specific gravity of the soil is 2.65. Calculate:  Bulk density  Dry density  Moisture content  Void ratio  Porosity  Degree of saturation  Air void content
  • 21.
    QUESTION 1 A diameterand length of soil sample are 38mm and 76 mm. The mass of soil sampling is 168.0 g. After dry in oven for 24 hr, the mass of the soil is 130.5g. Determine : a.Bulk density b.Dry density c.Moisture content a. 1.949 g/cm3 b. 1.514 g/cm3 c. 28.74%
  • 22.
    QUESTION 2 The massand volume of a soil are 290 kg and 0.15 m3. After dried in oven the mass of the soil is 250 kg. If specific gravity,GS of the soil is 2.65, Determine:-  Moisture content  Dry density  Void ratio  Porosity a. 16% b. 1666.67kg/m3 c. 0.591 d. 37.13%
  • 23.
    QUESTION 3 A drysoil has a volume of 30.0 ml. A porosity and specific gravity are 35% and 2.73. Determine :-  Dry density  Void ratio  Air void content a. 1.775 g/ml b. 0.5385 c. 35%
  • 24.
    QUESTION 4 A fullysaturated soil has a volume 40.5 ml and mass 59.2g. After dried in oven, the mass of the soil is 48.3g. The specific graity of the soil is 2.7. Determine:- a. Bulk density b. Moisture content c. Void ratio d. Porosity. a. 1.4g/ml b. 22.57% c. 1.264 d. 55.83%
  • 25.
    QUESTION 5 The massof the soil sample is 23g. After dried in oven for 24 hr the mass of the soil is 20g. Dry density of the soil is 1.67 g/ml. Determine:- a. Void ratio b. Porosity c. Air void content Given Spesific gravity of the soil is 2.68 a. 0.605 b. 37.68% c. 12.63%
  • 26.
    QUESTION 6 The followingdata was obtained from moisture content test conducted on fully saturated soil. Mass of container = 27.35 g Mass of container + wet soil = 58.25 Mass of container + dry soil = 50.55 g Determine:- a. Moisture content b. Void ratio c. Bulk density d. Dry density Given, the Specific gravity of the soil is 2.7. a. 33.19% b. 0.896 c. 1.897g/ml d. 1.424g/ml
  • 27.
    QUESTION 7 A undistubedsoil sample was taken from the proposed construction site. The following data was obtained from the soil sample. Volume of the soil = 1.664 X 10⁻³ m3 Mass of container = 1.864 kg Mass of container + wet soil = 5.018 kg Mass of container + dry soil = 4.328 Given, GS = 2.69, Determine;- a. Bulk density b. Dry density c. Moisture content d. Void ratio e. Porosity f. Degree of saturation g. Air void content a. 1895.43kg/m3 b. 1480.77kg/m3 c. 28% d. 0.817 e. 44.95% f. 92.25% g. 3.49%
  • 28.
    CHAPTER 2 BASIC CHARACTERISTISOF SOIL CC304 GEOTECHNICS1
  • 29.
    METHODS FOR SOILCLASSIFICATION  Grain Size Distribution - Sieve Analysis Test Dry sieving - Hydrometer - Pipette Sedimentation  Atterberg limit test - Casagrande Method - Cone Penetration Method
  • 30.
    GRAIN SIZE DISTRIBUTION In coarse grain soils …... By sieve analysis 30 Determination of GSD: In fine grain soils …... By hydrometer analysis Sieve Analysis Hydrometer Analysis soil/water suspension hydrometer stack of sieves sieve shaker
  • 31.
    GRAIN SIZE DISTRIBUTION -SIEVE ANALYSIS TEST • This test is performed to determine the percentage of different grain sizes contained within a soil. • The mechanical or sieve analysis is performed to determine the distribution of the coarser, larger-sized particles, and the hydrometer method is used to determine the distribution of the finer particles. • The distribution of different grain sizes affects the engineering properties of soil. • Grain size analysis provides the grain size distribution, and it is required in classifying the soil.
  • 32.
    MAJOR SOIL GROUPS 32 0.0024.75 0.075 Grain size (mm) Boulder Clay Silt Sand Gravel Cobble Fine grain soils Coarse grain soils Granular soils or Cohesionless soils Cohesive soils
  • 33.
    GRAIN SIZE DISTRIBUTION To know the relative proportions of different grain sizes. 33 An important factor influencing the geotechnical characteristics of a coarse grain soil. Not important in fine grain soils. Significance of GSD:
  • 34.
  • 35.
  • 36.
    36 GRAIN SIZE DISTRIBUTION 0.00010.001 0.01 0.1 1 10 100 0 20 40 60 80 100 Particle size (mm) % Finer
  • 37.
    37 UNIFIED SOIL CLASSIFICATION Todetermine W or P, calculate Cu and Cc C D D u = 60 10 C D D D c =  30 2 60 10 ( ) x% of the soil has particles smaller than Dx
  • 38.
    0.0001 0.001 0.010.1 1 10 100 0 20 40 60 80 100 Particle size (mm) % Finer D60 D30 D10
  • 39.
    WELL OR POORLYGRADED SOILS 39 Well Graded Soils Poorly Graded Soils Wide range of grain sizes present Gravels: Cc = 1-3 & Cu >4 Sands: Cc = 1-3 & Cu >6 Others, including two special cases: (a) Uniform soils – grains of same size (b) Gap graded soils – no grains in a specific size range
  • 40.
    ATTERBERG LIMITS 40 Border linewater contents, separating the different states of a fine grained soil Liquid limit Shrinkage limit Plastic limit 0 water content liquid semi- solid brittle- solid plastic
  • 41.
    41 Atterberg limit testis to determine the plastic and liquid limits of a fine grained soil. The Atterberg limits are based on the moisture content of the soil. Shrinkage limit Plastic limit Liquid limit Moisture content ( %) solid semisolid plastic liquid
  • 42.
     The plasticlimit: is the moisture content that defines where the soil changes from a semi-solid to a plastic (flexible) state.  The liquid limit: is the moisture content that defines where the soil changes from a plastic to a viscous fluid state.  Shrinkage limit : is the moisture content that define where the soil change from solid to semisolid state.
  • 43.
  • 44.
    LL TEST RESULTS Moisturecontent (%) No. of Blow LL 25
  • 45.
    45 Plastic Limit The minimumwater content at which a soil will just begin to crumble when it is rolled into a thread of approximately 3 mm in diameter.
  • 46.
    CONE PENETROMETER METHOD 20 Penetration,mm Moisture Content (%) LL
  • 47.
    Plastic Index, PI =Liquid Limit(LL) – Plastic Limit (PL) Liquidity Index, LI = w – PL PI Activity, A = PI % of clay soil
  • 50.
    QUESTION 1 Size ofsieve (mm) Mass of soil retained (g) 5.0 2.36 1.18 0.6 0.3 0.212 0.15 0.063 Panci 11 18 24 21 41 32 16 22 20 The following result was obtained from Sieve Analysis Test. Determine The coeficient of uniformity Cu and Coeeficient of curvature, Cc
  • 51.
    QUESTION 2 The followingresult was obtained from Sieve Analysis Test. Determine the coeficient of uniformity Cu and Coeeficient of curvature, Cc and classified the soil Size of sieve (mm) Mass of soil retained (g) 37.5 0 20.0 59 10.0 38 5.0 33 2.36 27 1.18 30 0.6 22 0.3 15 0.212 17 0.15 16 0.063 9 Panci 11
  • 52.
    QUESTION 4 No. Ujian1 2 3 4 Mass of wet soil + container (g) 48.61 55.53 51.71 50.51 Mass of dry soil + container (g) 41.19 46.05 42.98 41.54 Mass of container (g) 17.33 17.41 17.45 17.36 No. Of blow 34 27 22 17 The following result was obtained from liquid limit test by using casagrande Method. The plastic limit of the soil is 32% If moisture content of soil at site is 35% and percentage of clay soil is 40%, a. Liquid limit b. Plasticity Index c. Liquidity index d. Activity
  • 53.
    No. Ujian 12 3 4 Mass of wet soil + container W1 48.61 55.53 51.71 50.51 Mass of dry soil + container(g) W2 41.19 46.05 42.98 41.54 Mass of container (g) W3 17.33 17.41 17.45 17.36 Mass of water ( W1 – W2 ) 7.42 9.48 8.73 8.97 Mass of dry soil ( W2 – W3 ) 23.84 28.64 25.53 24.18 Moisture content, m = X 100% 31.1 33.1 34.2 37.1 No.of blow 34 27 22 17 3 2 2 1 W W W W − − From the graph Liquid Limit (LL) = 34% Plastic Index, PI = LL – PL = 34-32 = 2% Liquidity Index, LI = w – PL PI = 35% - 32% 2 Activity, A = PI % of clay soil = 2% 40% = 0.05
  • 54.
    QUESTION 5 Mass ofcontainer + wet soil (g) 30.69 34.38 39.26 45.99 51.47 Mass of container + dry soil (g) 25.63 27.14 29.35 32.67 35.14 Mass of container (g) 10.12 10.25 10.14 10.38 10.47 Penetration (mm) 15.9 17.7 19.1 20.3 21.5 The Atterberg Limit Test was conducted on a soil sample by using a cone penetrometer method, the following result were recorded: The plastic limit of the same soil is 25%. Determine : a. Liquid limit b. Plasticty index c. Activity of the soil if clay content is 24.2% d. Liquidity index of the soil when its natural moisture content is 29%
  • 55.
    SOLUTION: i. From thegraph, Liquid limit (LL) = 57% ii. Plasticity Index, PI = LL – PL = 57 – 25 = 32% iii. Activity of the soil, A = PI / % of clay = 32 / 24.2 = 1.32 iv. Liquidity index, LI = (w – PL) / PI = (29 – 25) / 32 = 0.125 Moisture content (%) 32.6 42.9 51.6 59.8 66.2 Penetration (mm) 15.9 17.7 19.1 20.3 21.5
  • 56.
    COMPACTION •Definition: Compaction is aprocess that brings about an increase in soil density or unit weight, accompanied by a decrease in air volume. There is usually no change in water content •The degree of compaction is measured by dry unit weight and depends on the water content and compactive effort (weight of hammer, number of impacts, weight of roller, number of passes). •the maximum dry unit weight occurs at an optimum water content
  • 57.
    • Compaction isemployed in the construction of road bases, runways, earth dams, embankments and reinforced earth walls. In some cases, compaction may be used to prepare a level surface for building construction.
  • 58.
    OBJECTIVE OF COMPACTION Compaction can be applied to improve the properties of an existing soil or in the process of placing fill.  The main objectives are to:  increase shear strength and therefore bearing capacity  increase stiffness and therefore reduce future settlement  decrease voids ratio and so permeability, thus reducing potential frost heave
  • 59.
    FACTOR AFFECTING COMPACTION Nature and type of soil, i.e. sand or clay, grading, plasticity  Water content at the time of compaction  Site conditions, e.g. weather, type of site, layer thickness  Compactive effort: type of plant (weight, vibration, number of passes)
  • 60.
    Effect of soiltype  Well-graded granular soils can be compacted to higher densities than uniform or silty soils.  Clays of high plasticity may have water contents over 30% and achieve similar densities (and therefore strengths) to those of lower plasticity with water contents below 20%.  As the % of fines and the plasticity of a soil increases, the compaction curve becomes flatter and therefore less sensitive to moisture content. Equally, the maximum dry density will be relatively low.
  • 61.
    Effect of watercontent  Moisture content is important in soil compaction.  If the water content of the soil is low, the soil is difficult to compacted.  By increasing the water content of the soil it improve the workability of compaction process.  If water content exceed the optimum moisture content, the soil particles are separately
  • 62.
    Effect of increasedcompactive effort  The compactive effort will be greater when using a heavier roller on site or a heavier rammer in the laboratory. With greater compactive effort: - maximum dry density increases - optimum water content decreases - air-voids content remains almost the same.
  • 63.
    Soil Compaction inthe Lab: Standard Proctor Test Modified Proctor Test
  • 64.
    Soil Compaction inthe Lab: 1- Standard Proctor Test ASTM D-698 or AASHTO T-99 2- Modified Proctor Test ASTM D-1557 or AASHTO T-180 Energy = 12,375 foot-pounds per cubic foot Energy = 56,520 foot-pounds per cubic foot Moisture Content Dry Density gd max Compaction Curve for Standard Proctor (OMC) gd max Zero Air Void Curve Sr < 100% Zero Air Void Curve Sr =100% Zero Air Void Curve Sr = 60% Compaction Curve for Modified Proctor
  • 65.
    DRY-DENSITY/WATER-CONTENT RELATIONSHIP • The maximumdry density occurs at an optimum water content • The curve is drawn with axes of dry density and water content and the controlling values are values read off: - ρd(max) = maximum dry density - wopt = optimum water content • Different curves are obtained for different compactive efforts
  • 67.
    Bulk density,  (Mg/m³) 1.84 2.002.10 2.12 2.09 2.05 Water content, w 0.084 0.106 0.129 0.144 0.166 0.186 Dry density, d (Mg/m³) 1.70 1.81 1.86 1.851 1.79 1.73 EXAMPLE 1 Based on the data given, determine: a. the maximum dry density and optimum moisture content
  • 68.
    QUESTION 1 a. Describedcompaction in term of civil engineering disciplines b. Described THREE (3) factors affecting compaction c. The laboratory compaction test result is shown in Table below. Test no. 1 2 3 4 5 Moisture content ( %) 12.9 14.3 15.7 16.9 17.9 Bulk density (kg/m3) 2092 2164 2152 2127 2043 Plot the dry density versus moisture content and determine the value of maximum dry density and optimum moisture content Test no. 1 2 3 4 5 Moisture content ( %) 12.9 14.3 15.7 16.9 17.9 Bulk density (kg/m3) 2092 2164 2152 2127 2043
  • 69.
    Test no. 12 3 4 5 Moisture content ( %) 12.9 14.3 15.7 16.9 17.9 Bulk density (kg/m3) 2092 2164 2152 2127 2043 The laboratory compaction test result is shown in Table below. 2092 (1+0.129) =1852.97 2164 (1+0.143) =1893.26 2152 (1+0.157) =1859.98 2127 (1+0.169) =1819.50 2043 (1 + 0.179) =1732.82 0% 2.7 x 1000 x (1- 0) 1 + (0.129x 2.7) = 2002.52 2.7 x 1000 x(1) 1+ (0.143 x 2.7) = 1947.91 2700 x 1 1 + (0.157x 2.7) = 1896.20 2700 x 1 1 + (0.169x 2.7) = 1854.01 2700 x 1 1 + (0.169x 2.7) = 1820.27 5% 2002.52 x (1-0.05) = 2002.52 x 0.95 =1902.39 1947.91 x 0.95 =1850.51 1896.20 x 0.95 =1801.40 1854.01 x 0.95 =1761.31 1820.27 x 0.95 =1729.19 10% 2002.52 x (1 - 0.1) = 2002.52 x 0.9 =1802.27 1947.91 x 0.9 =1753.12 1896.20 x 0.9 =1706.58 1854.01 x 0.9 =1668.61 1820.27 x 0.9 =1638.24 Plot the dry density versus moisture content and determine the value of maximum dry density and optimum moisture content. Draw a saturation line for 0%, 5% and 10% if specific gravity, Gs of the soil is 2.7
  • 70.
    QUESTION 2  Thefollowing result was obtained from compaction test in the laboratory. Moisture content (%) 9.0 10.2 12.5 13.4 14.8 16.0 Bulk density (kg/m3) 1923 2051 2220 2220 2179 2096 Plot the dry density versus moisture content and determine the value of maximum dry density and optimum moisture content.