Download to read offline

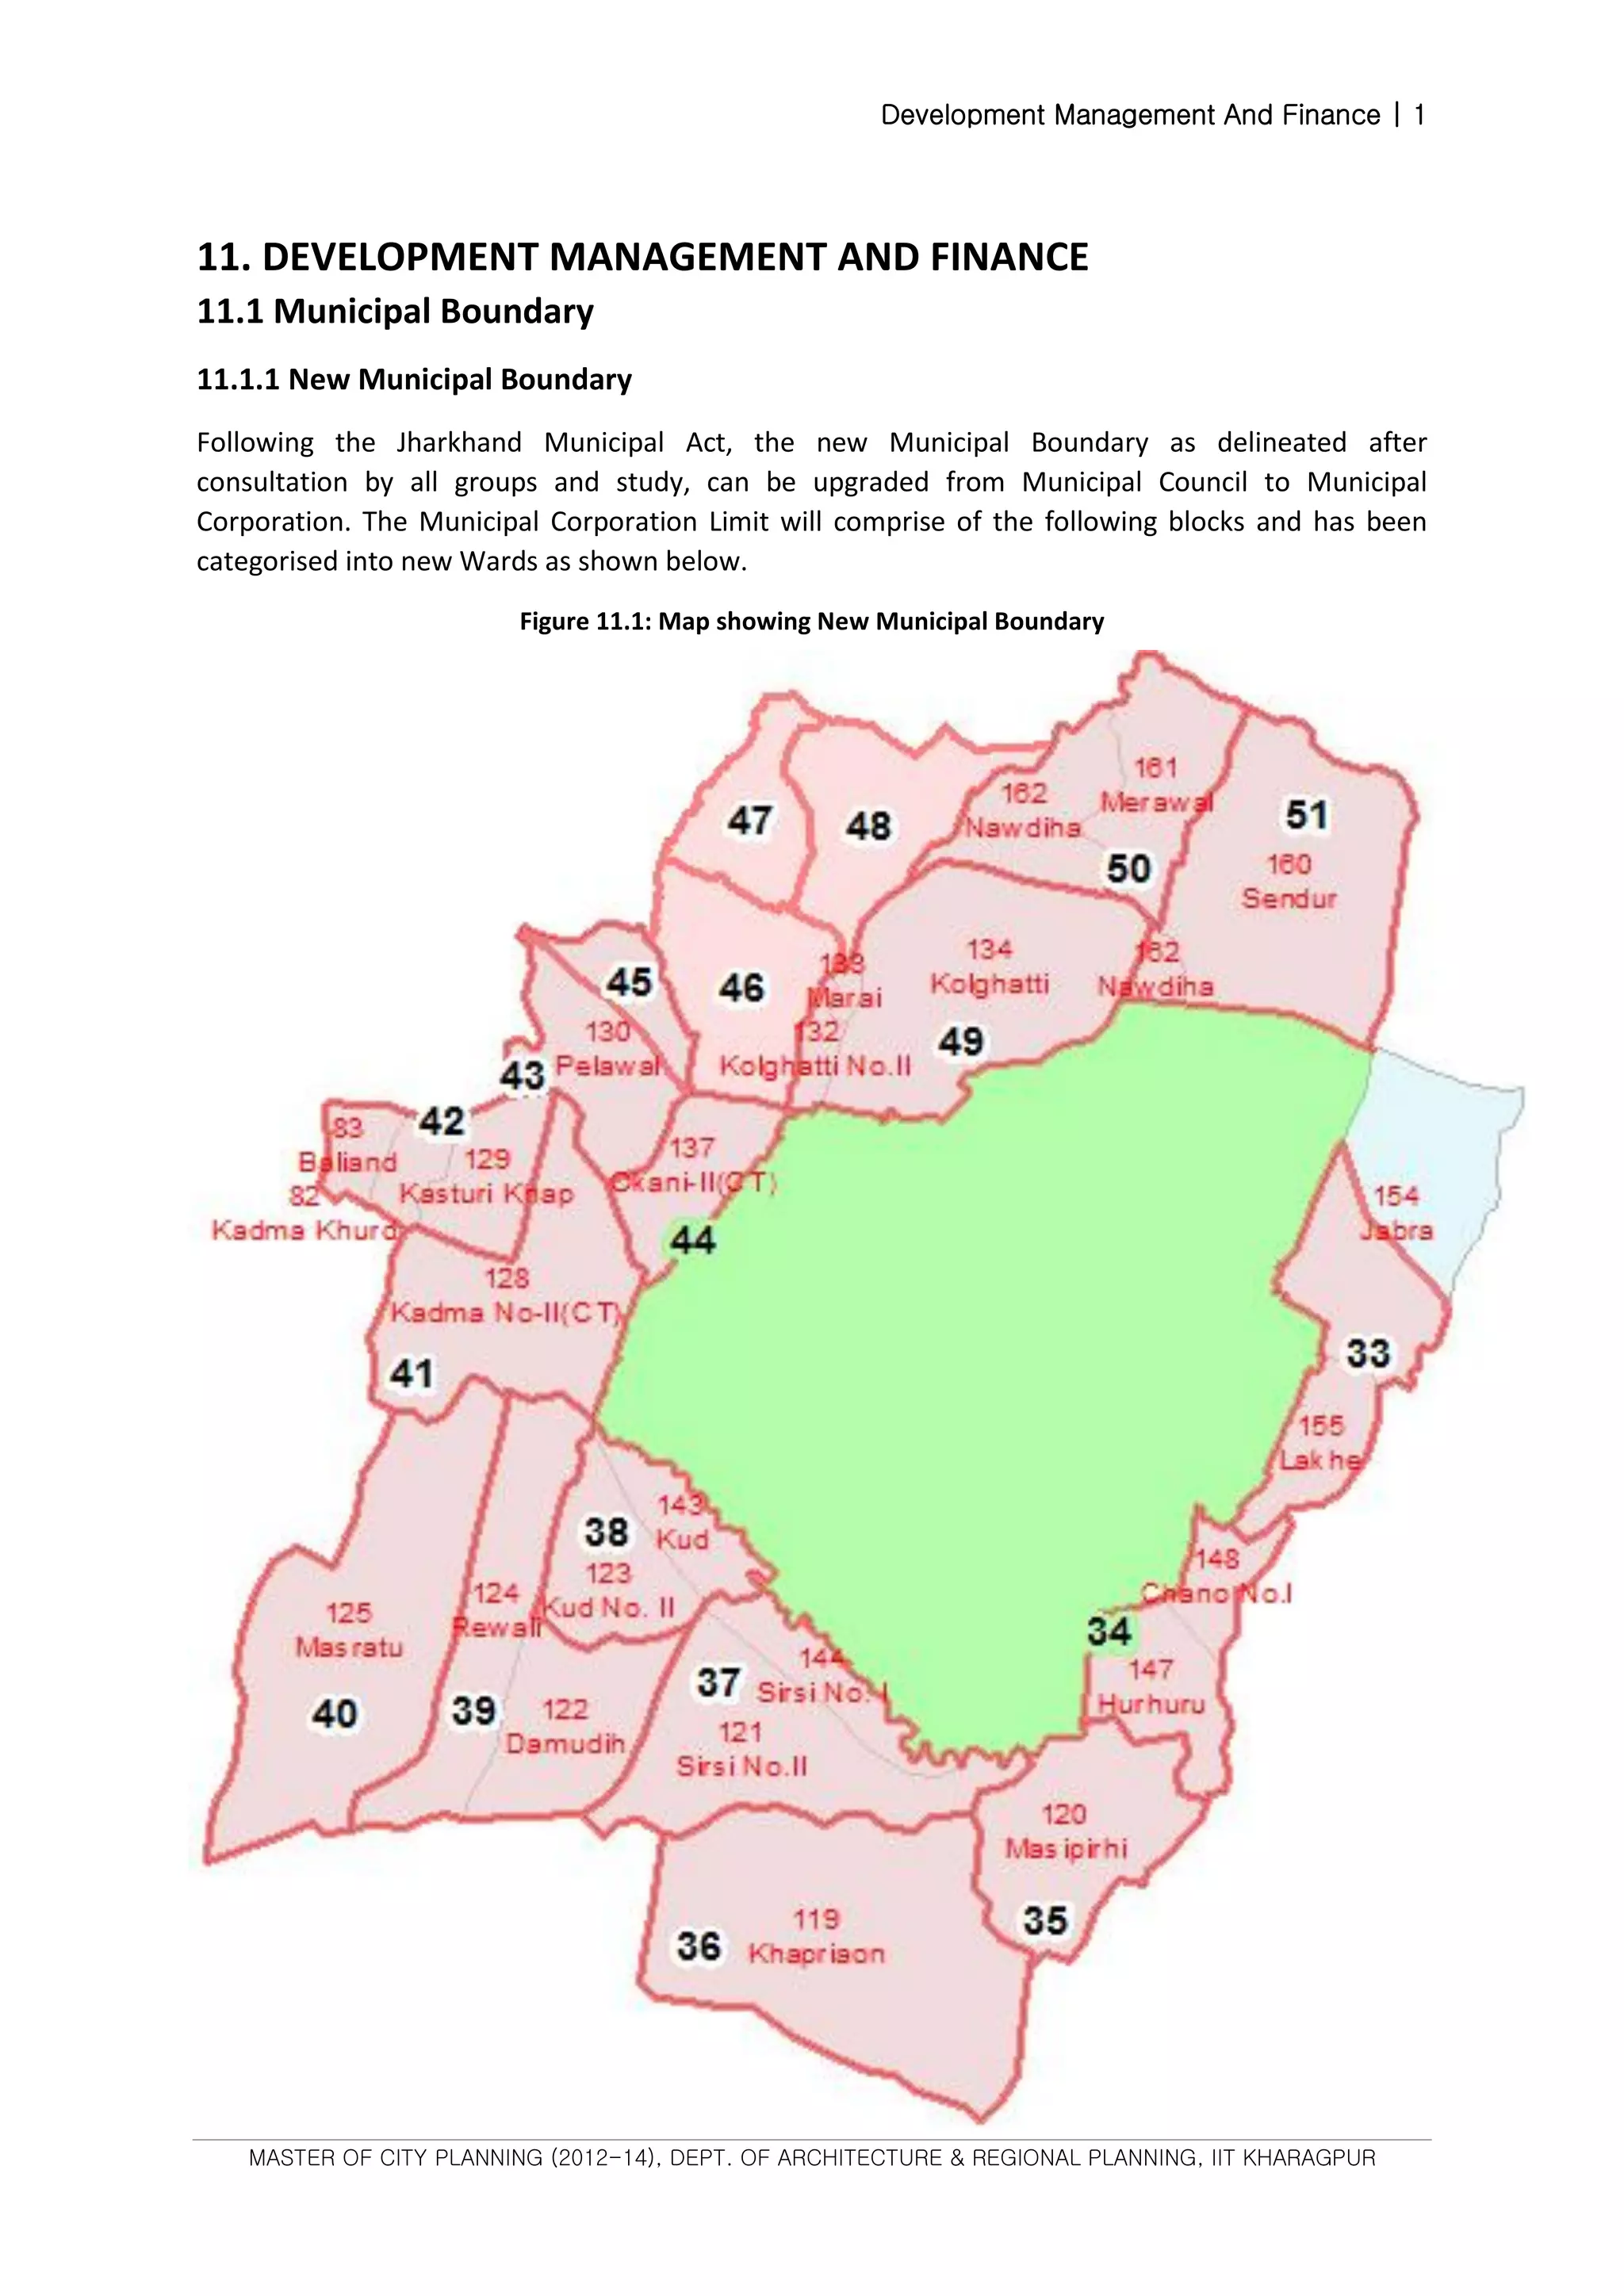
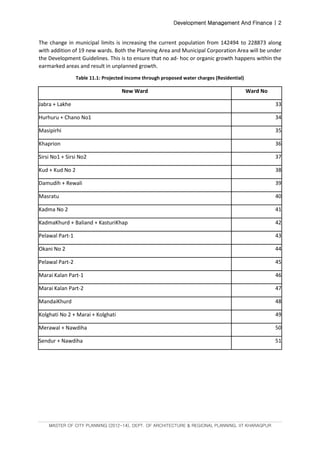
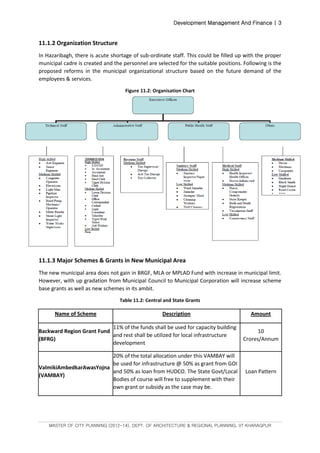
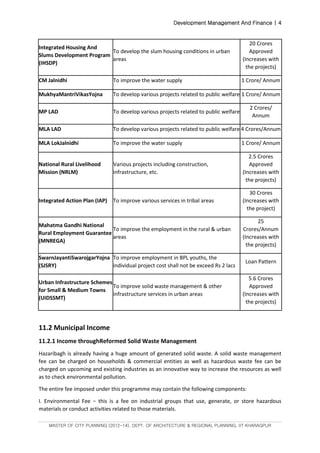
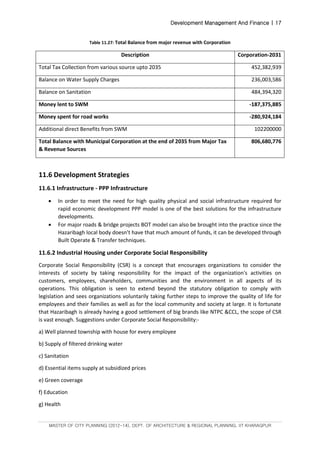

The document discusses reforms to municipal boundaries, organization structure, and finance in Hazaribagh, India. It proposes expanding the municipal boundary and creating 19 new wards. This would increase the population within municipal limits and add new schemes and grants. Reforms to property tax rates and structures are outlined to increase municipal income, along with reforms to solid waste management fees and water and sewer taxes linked to consumption. Projections show the increased income that could be generated through these reformed taxes and fees to support improved services.


