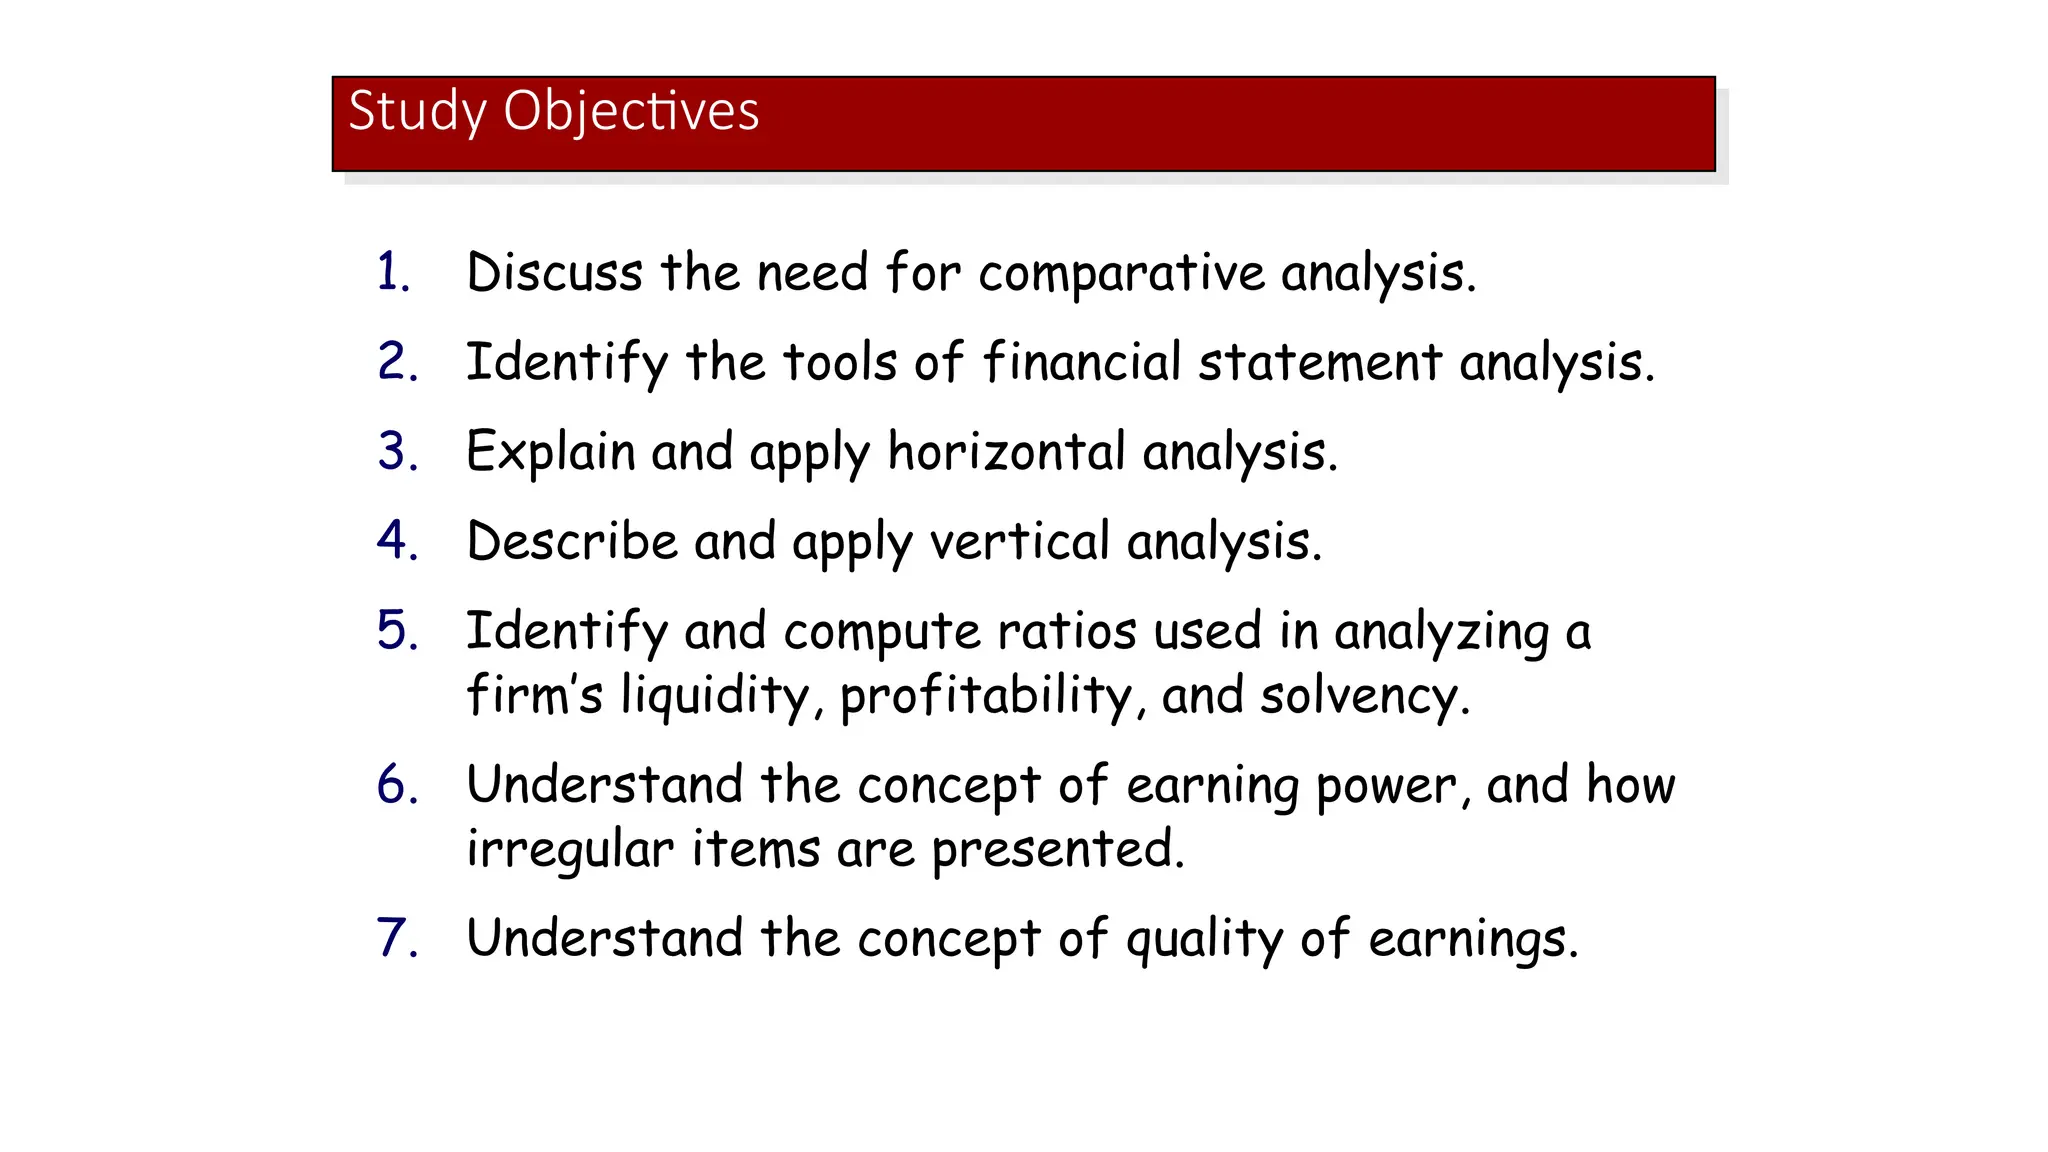
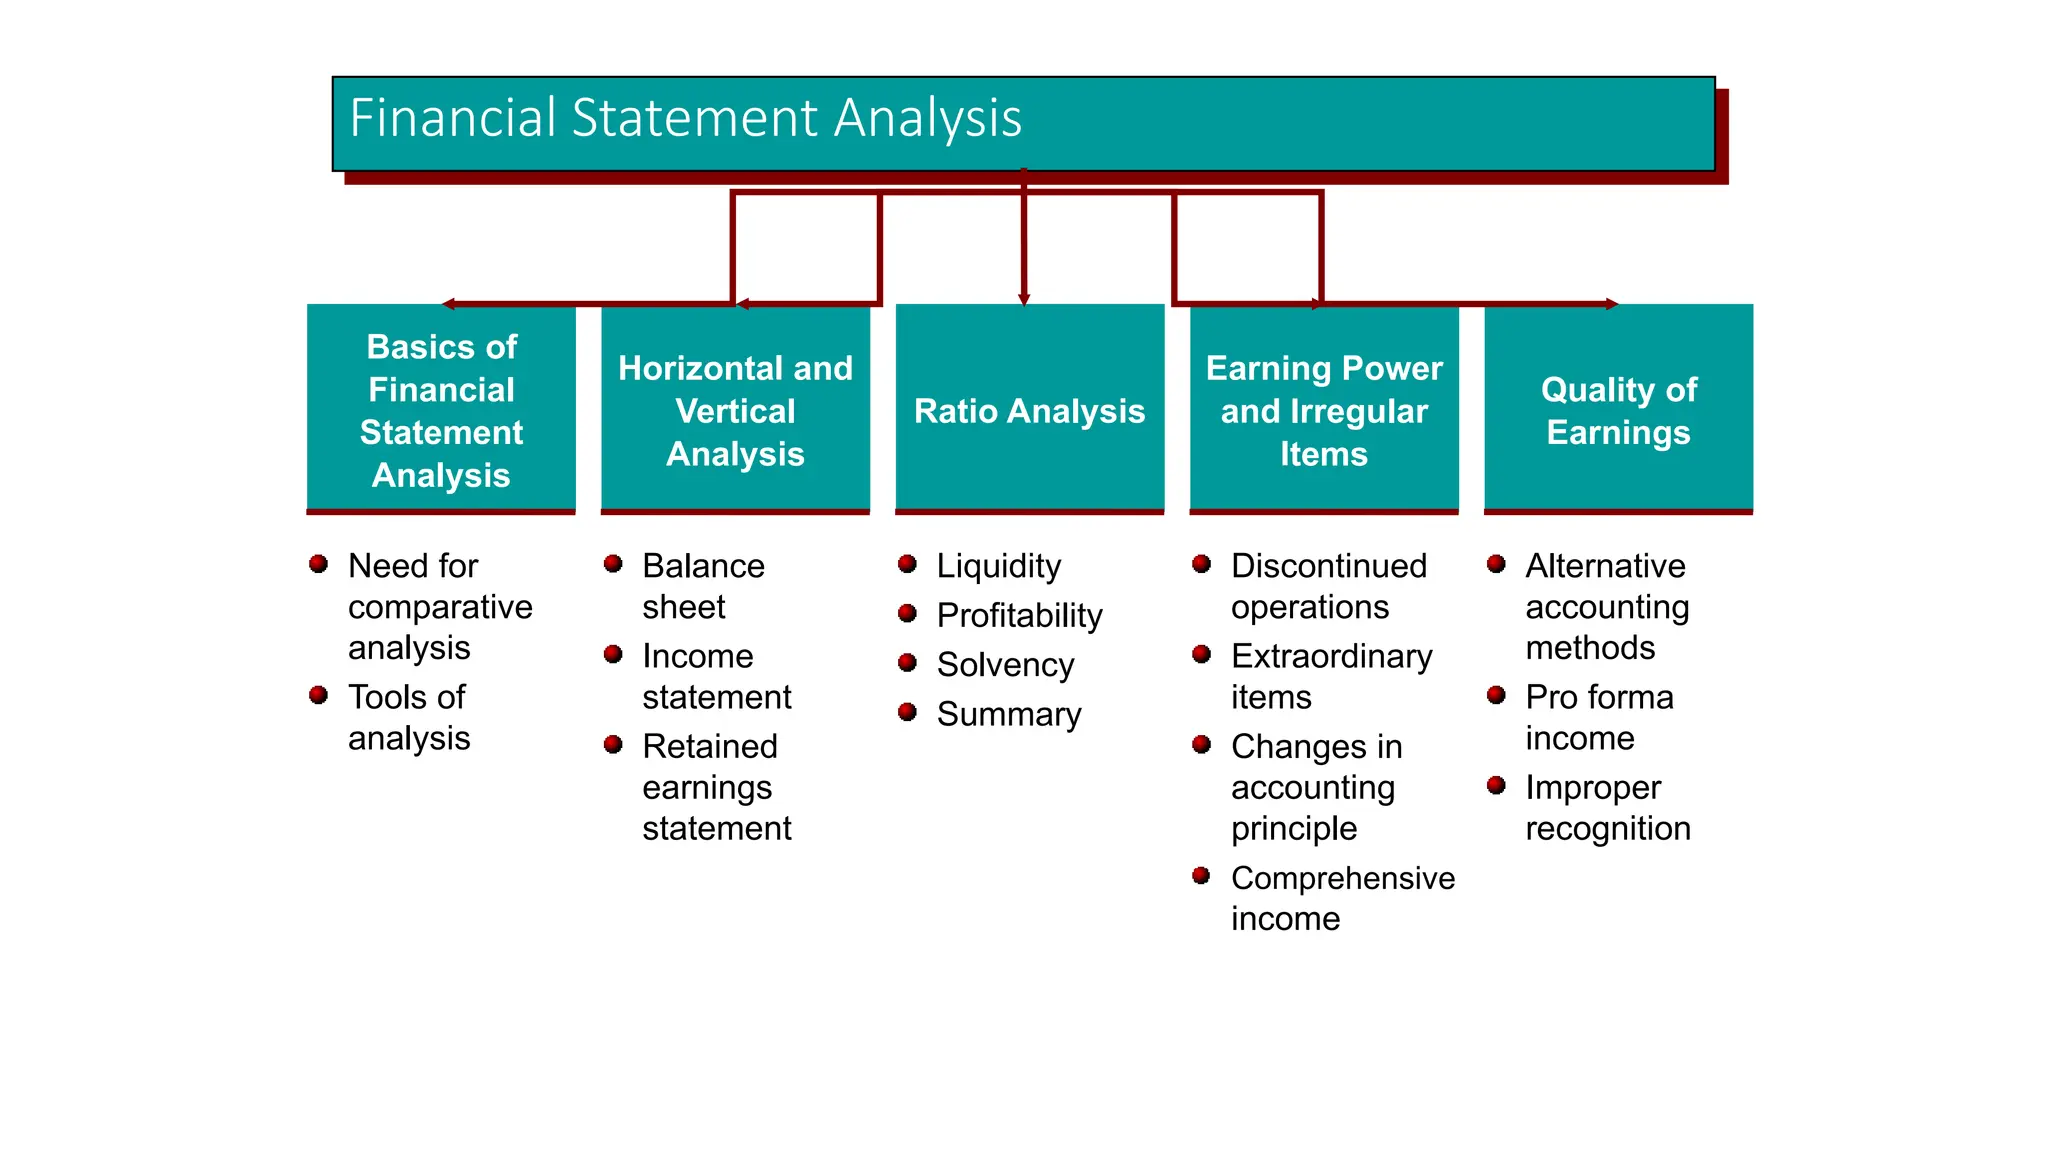
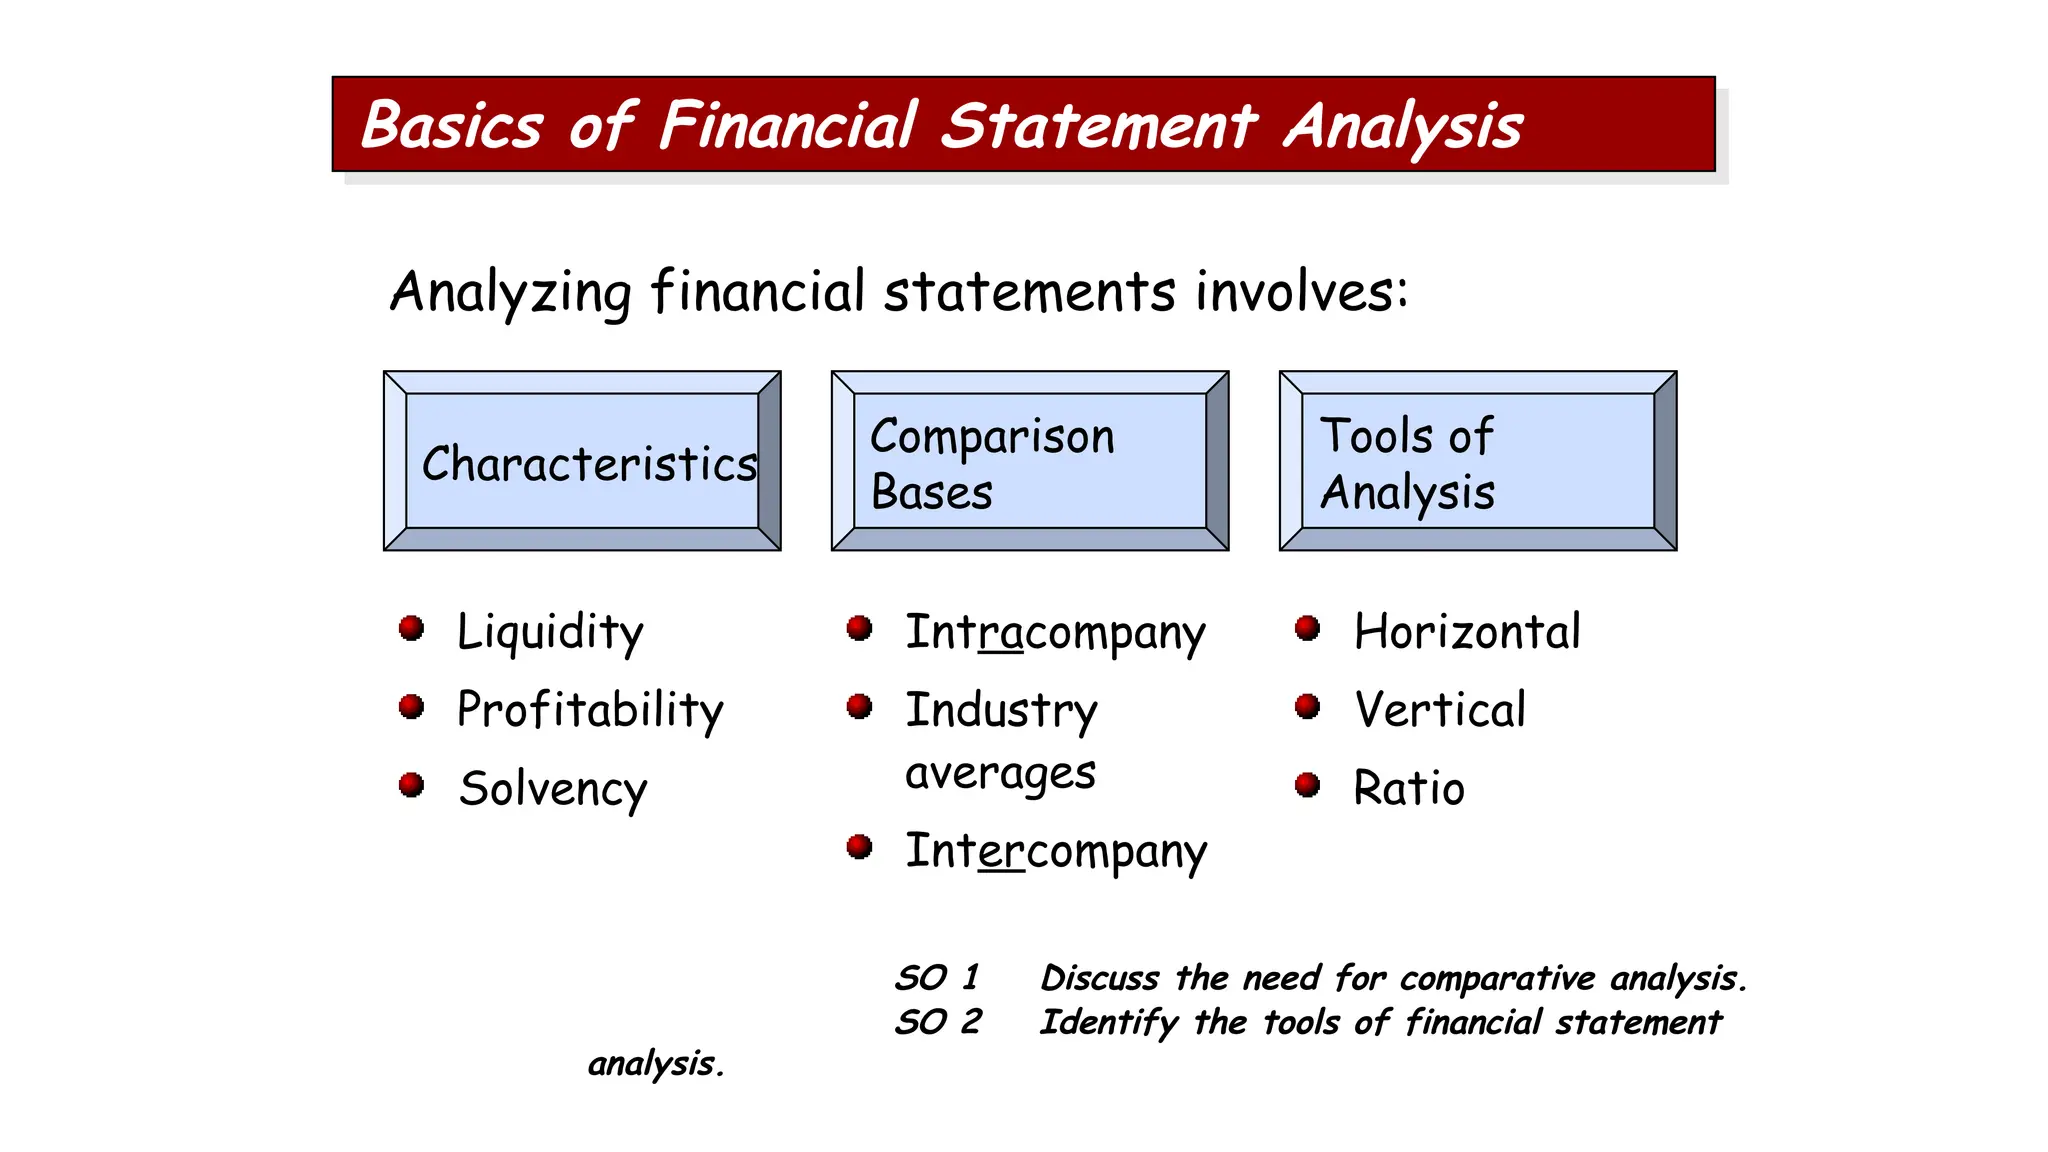
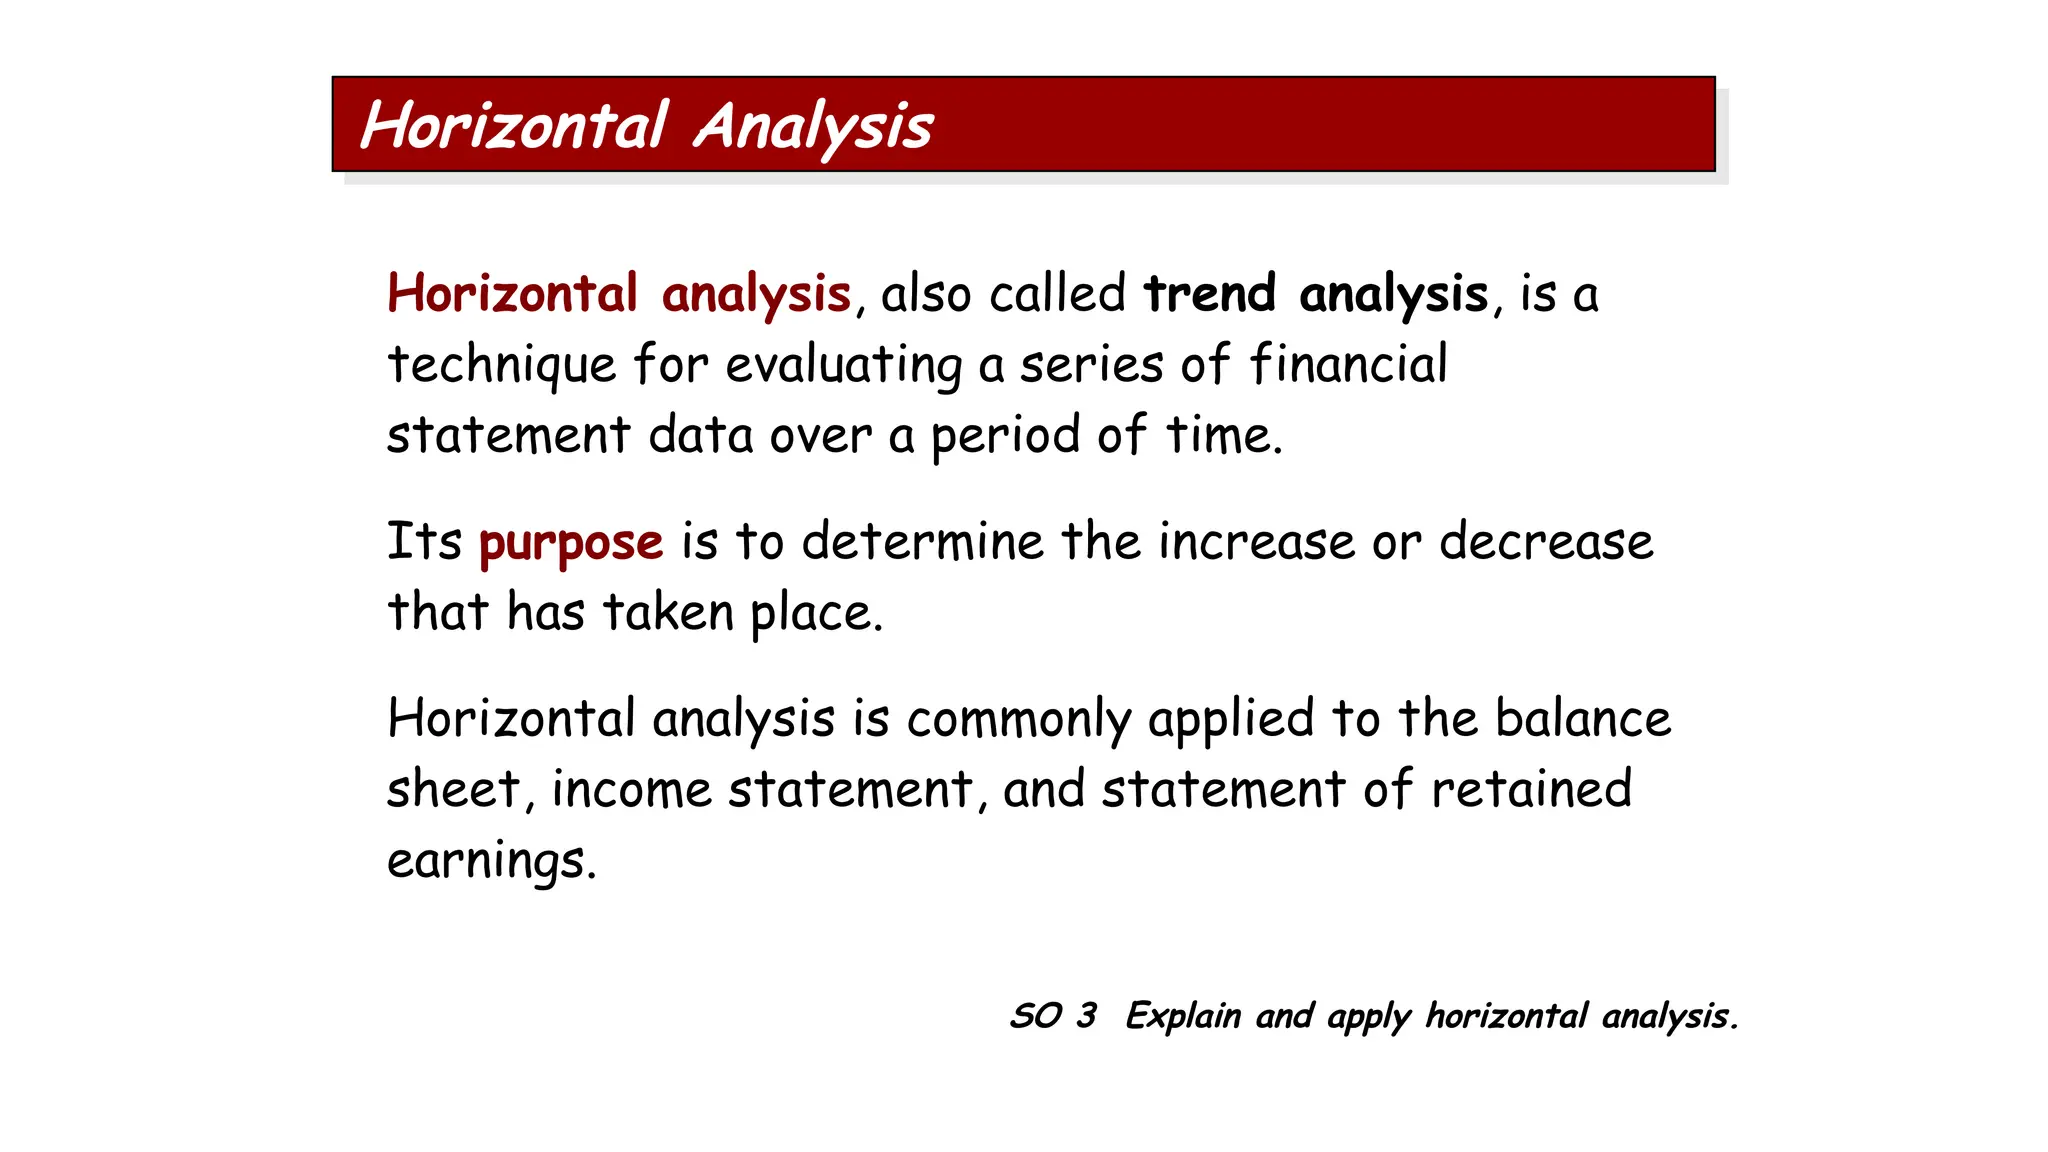
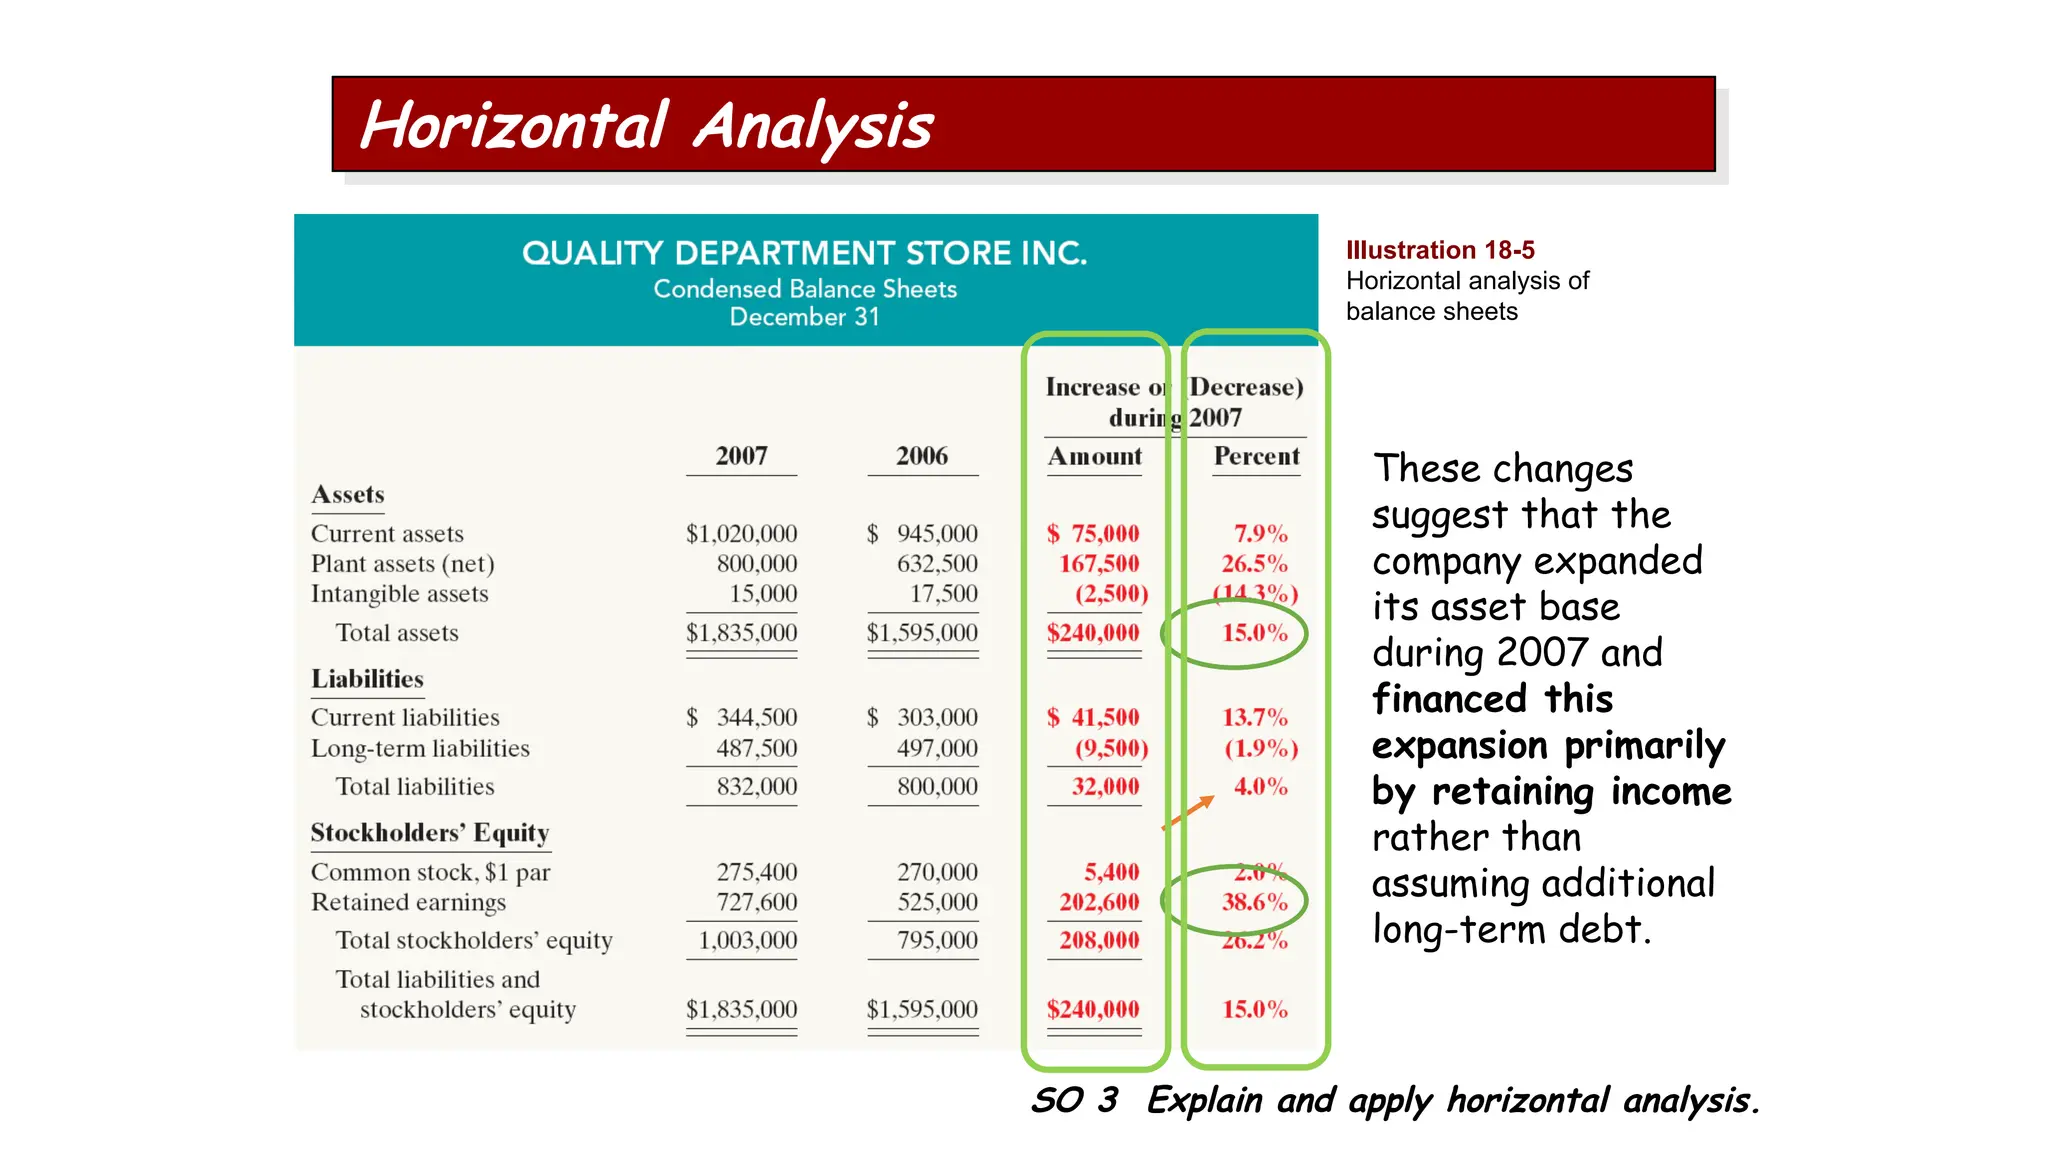
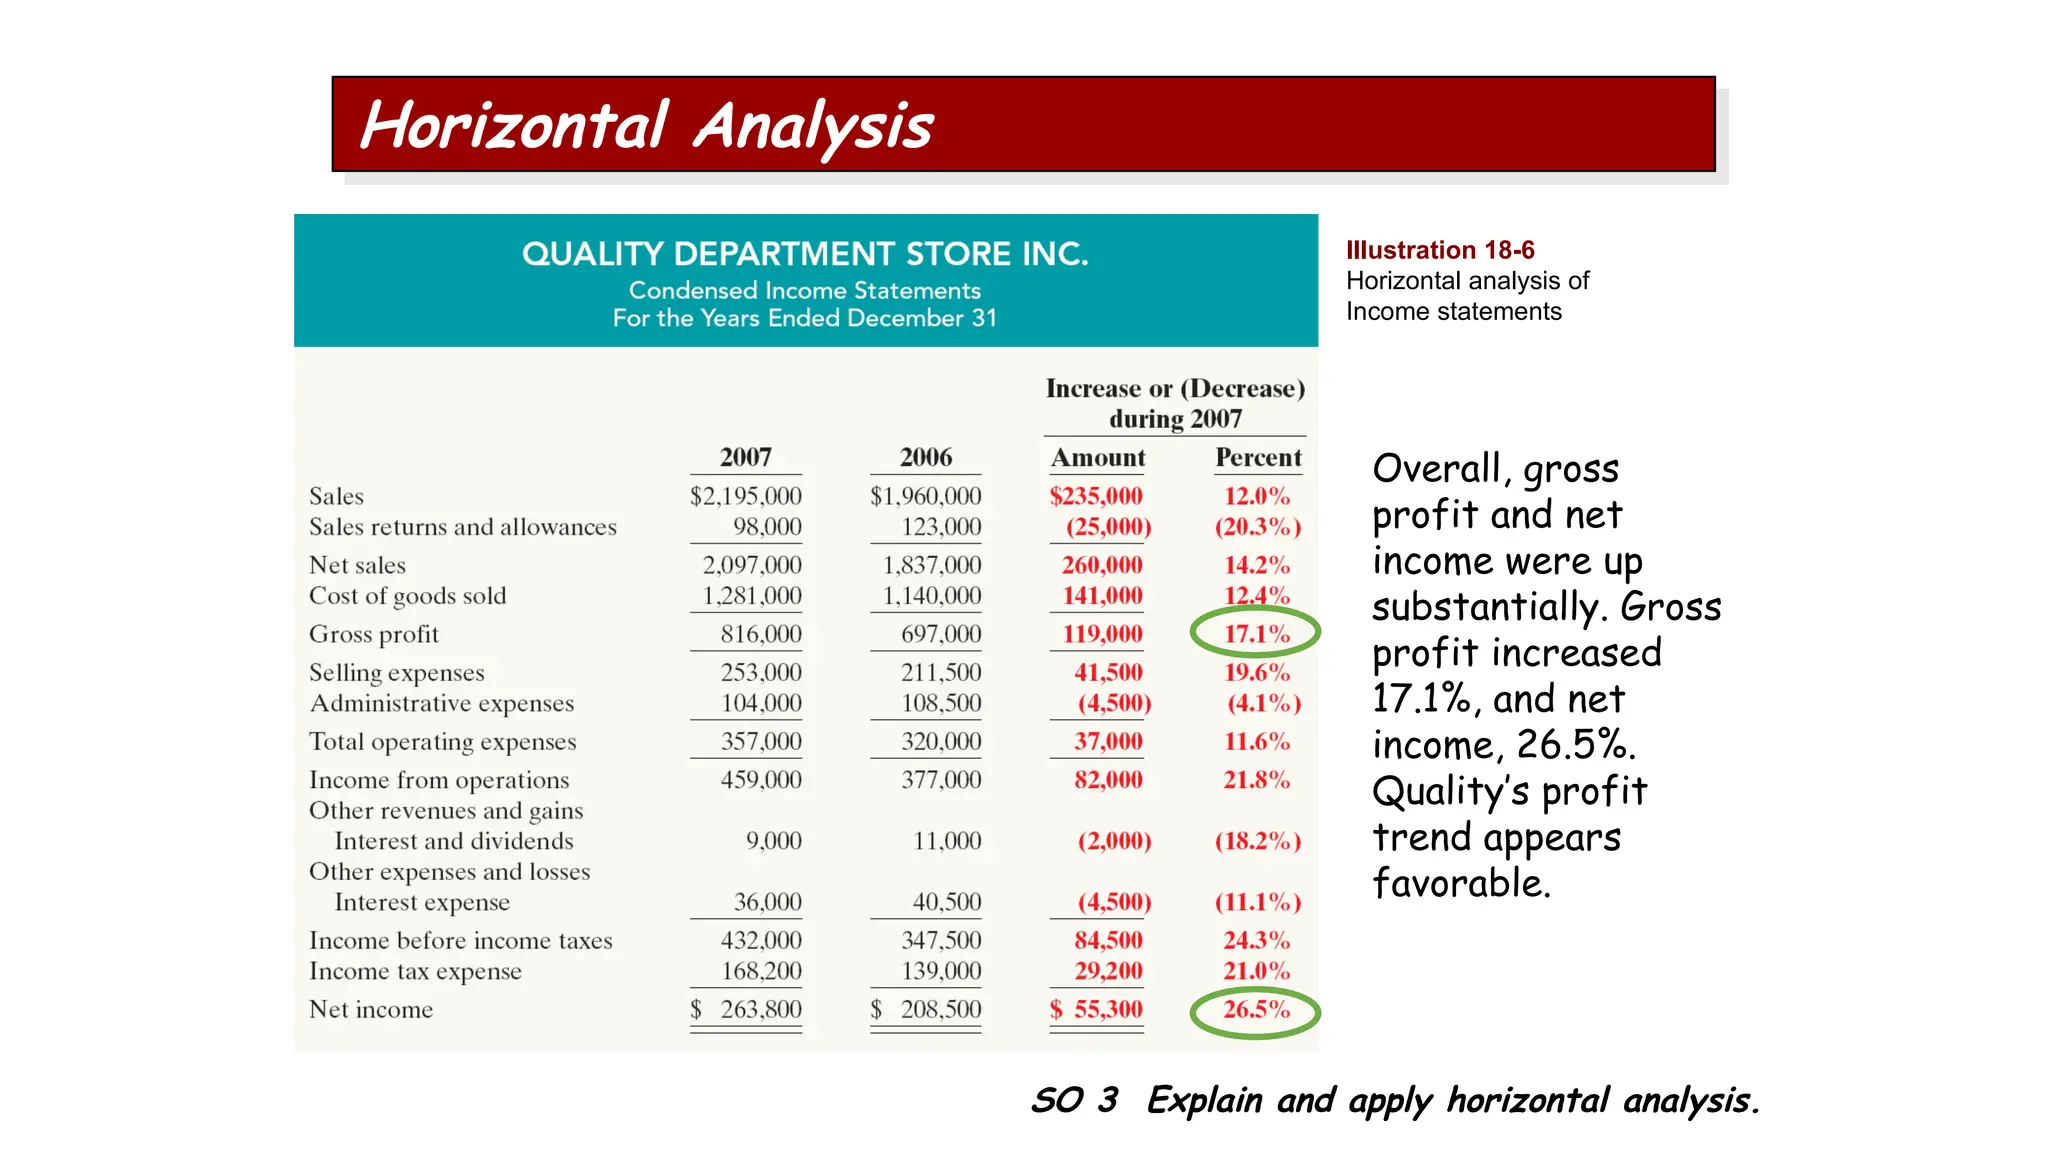
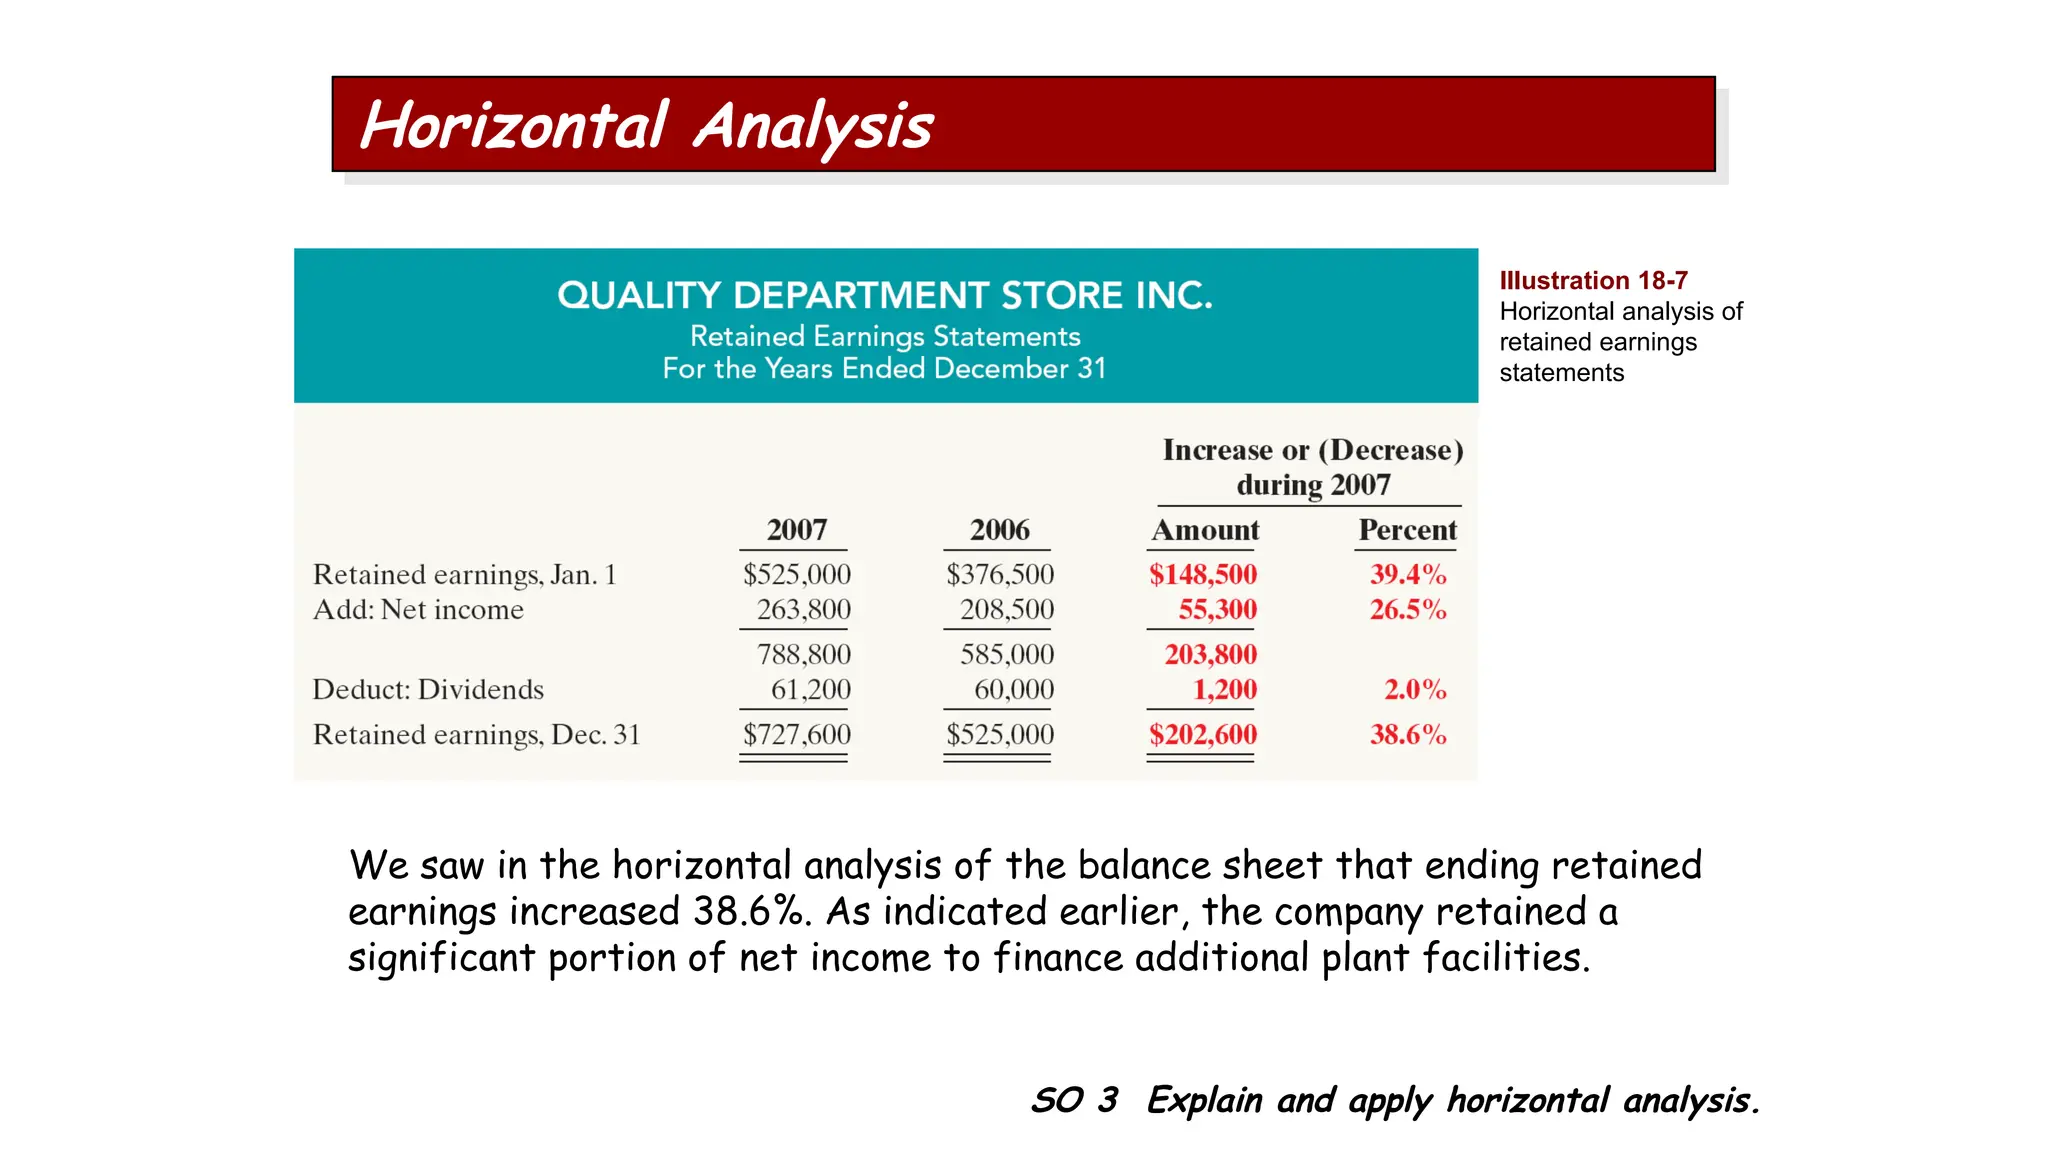
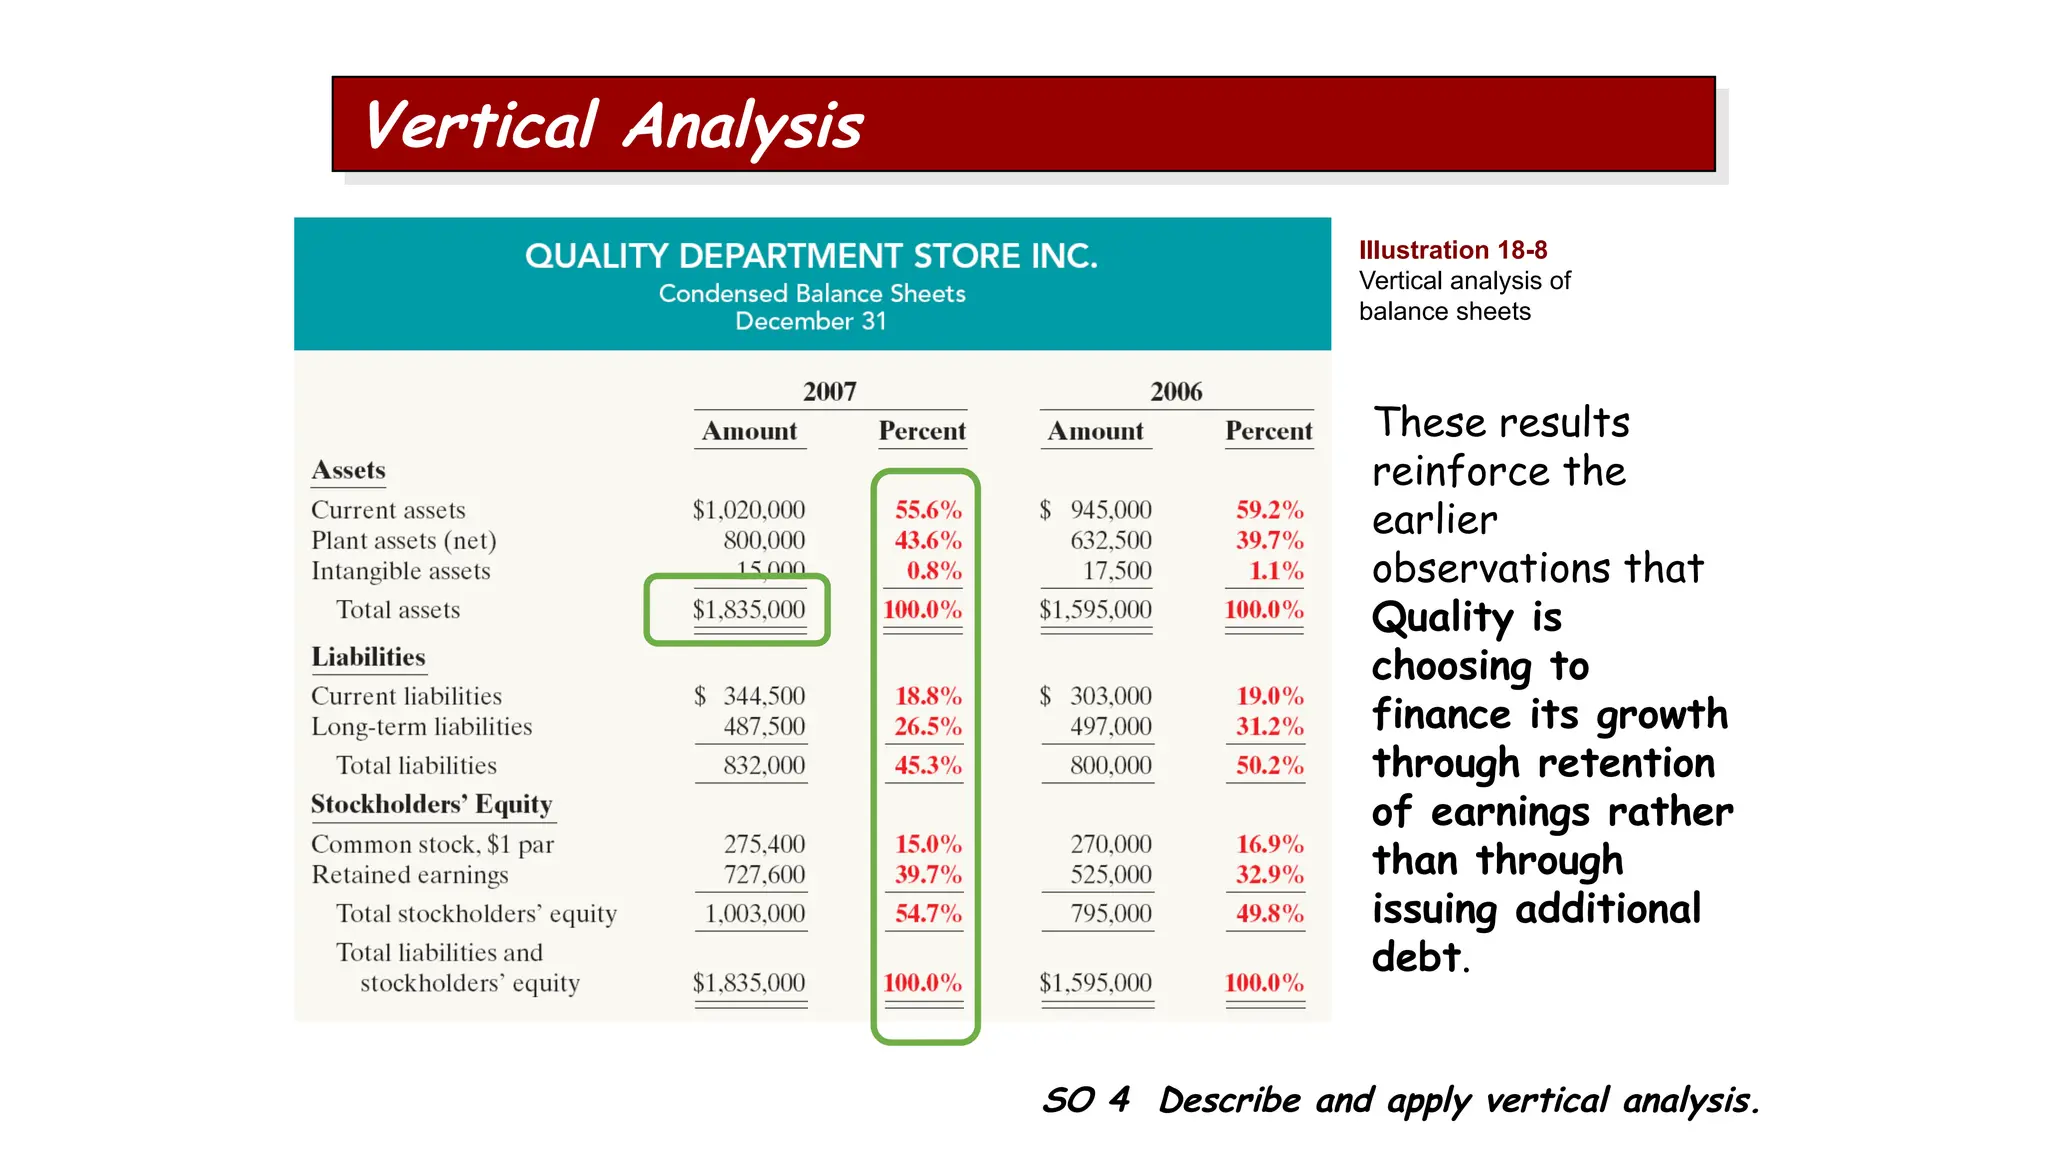
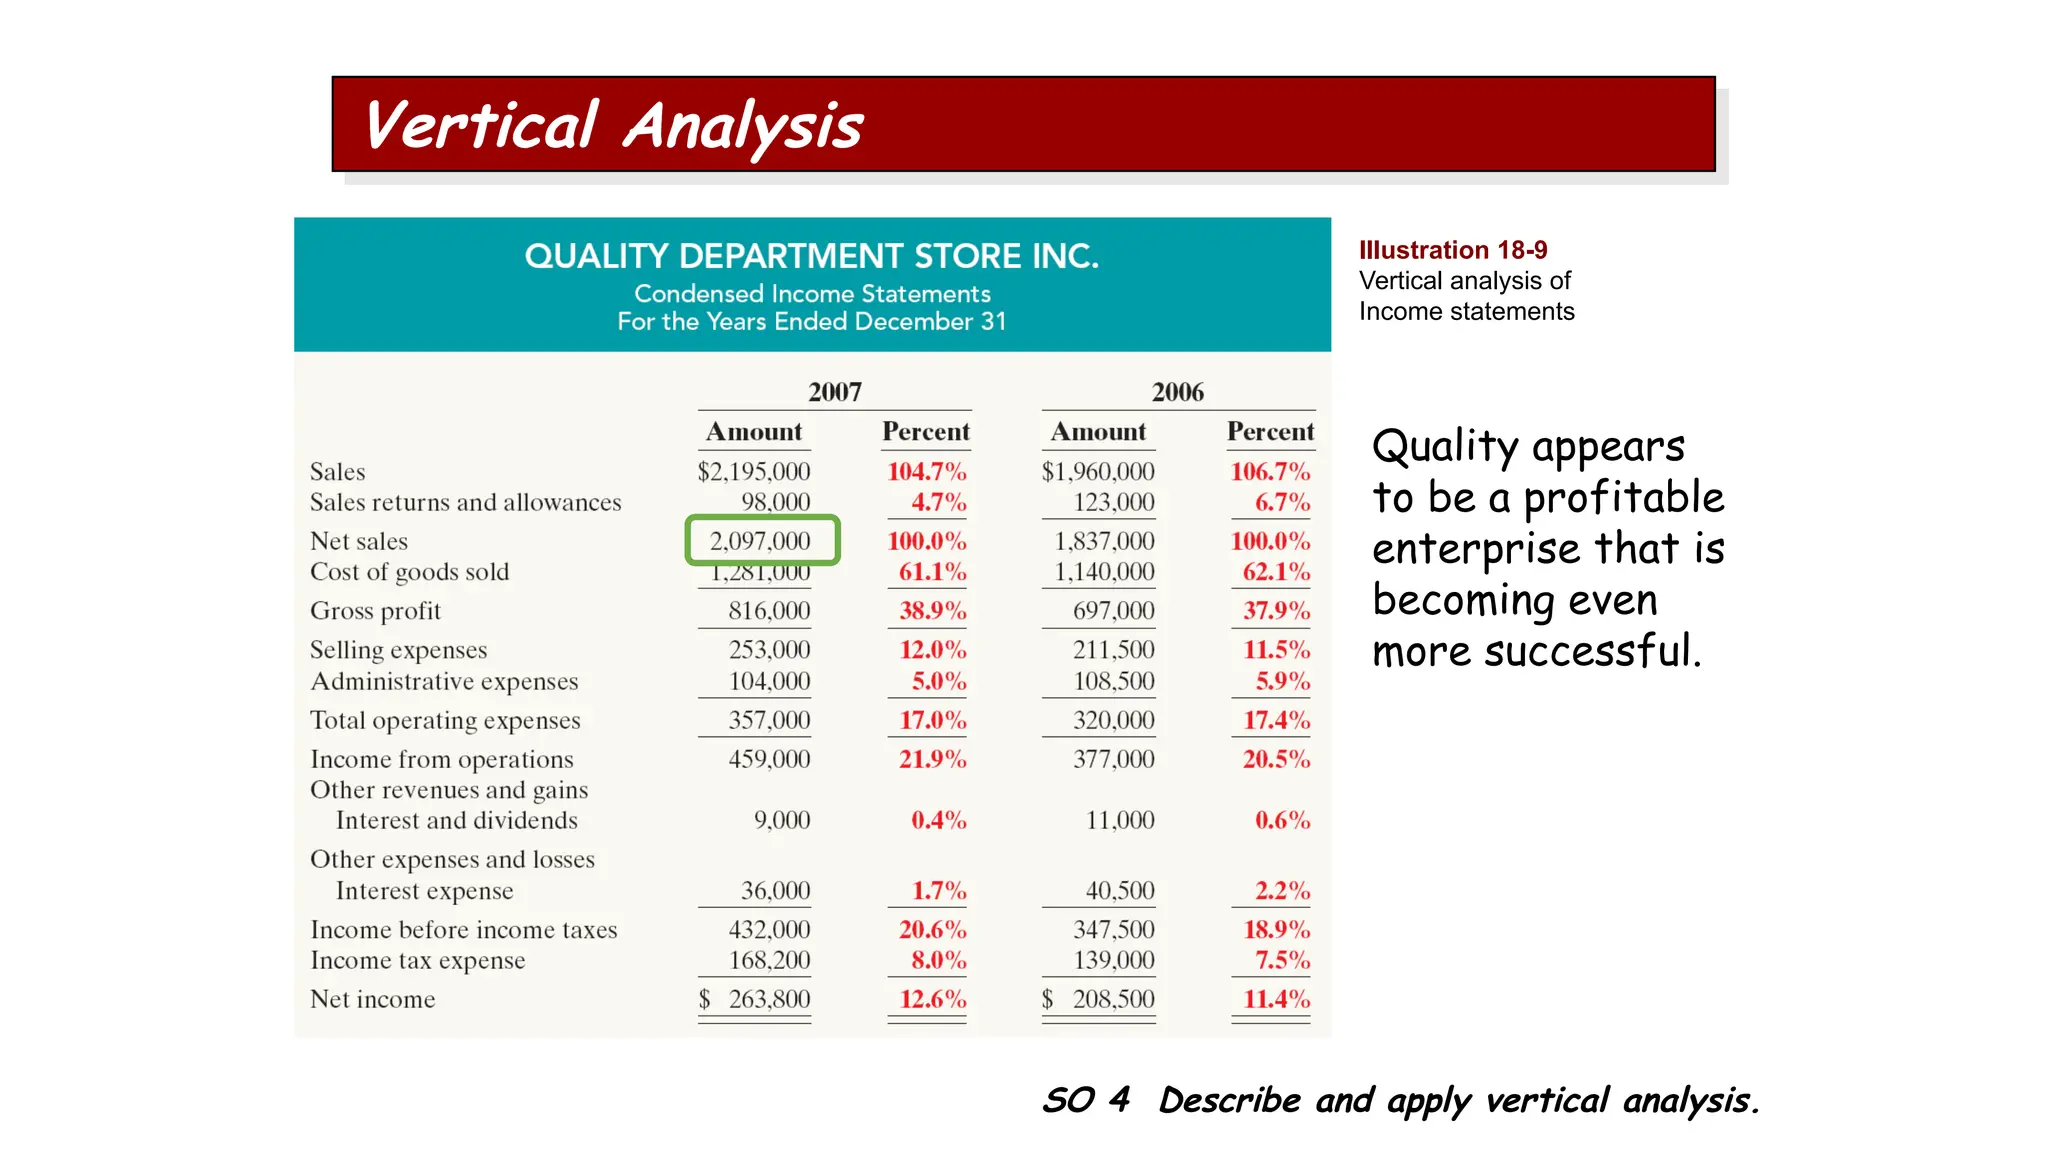
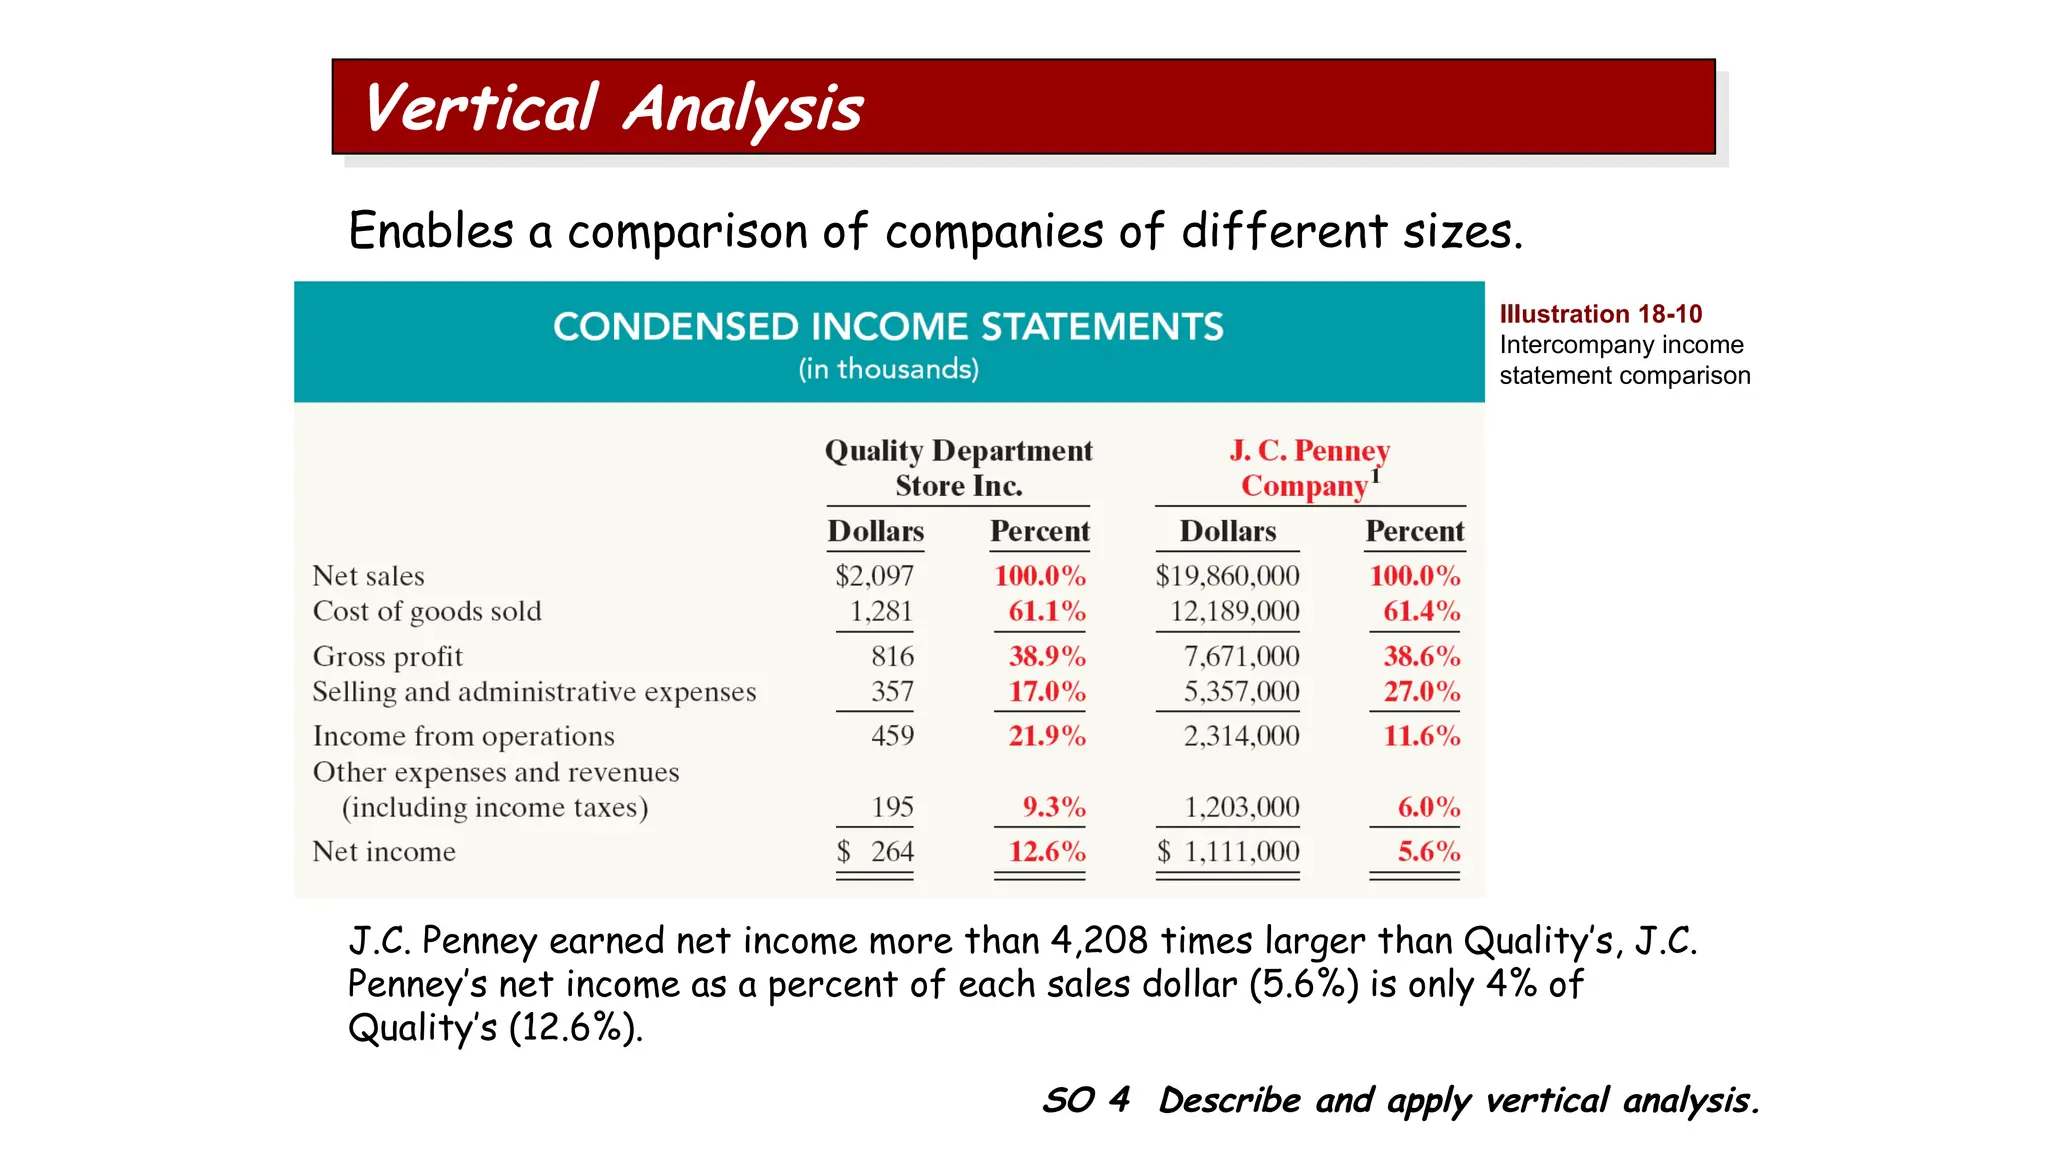
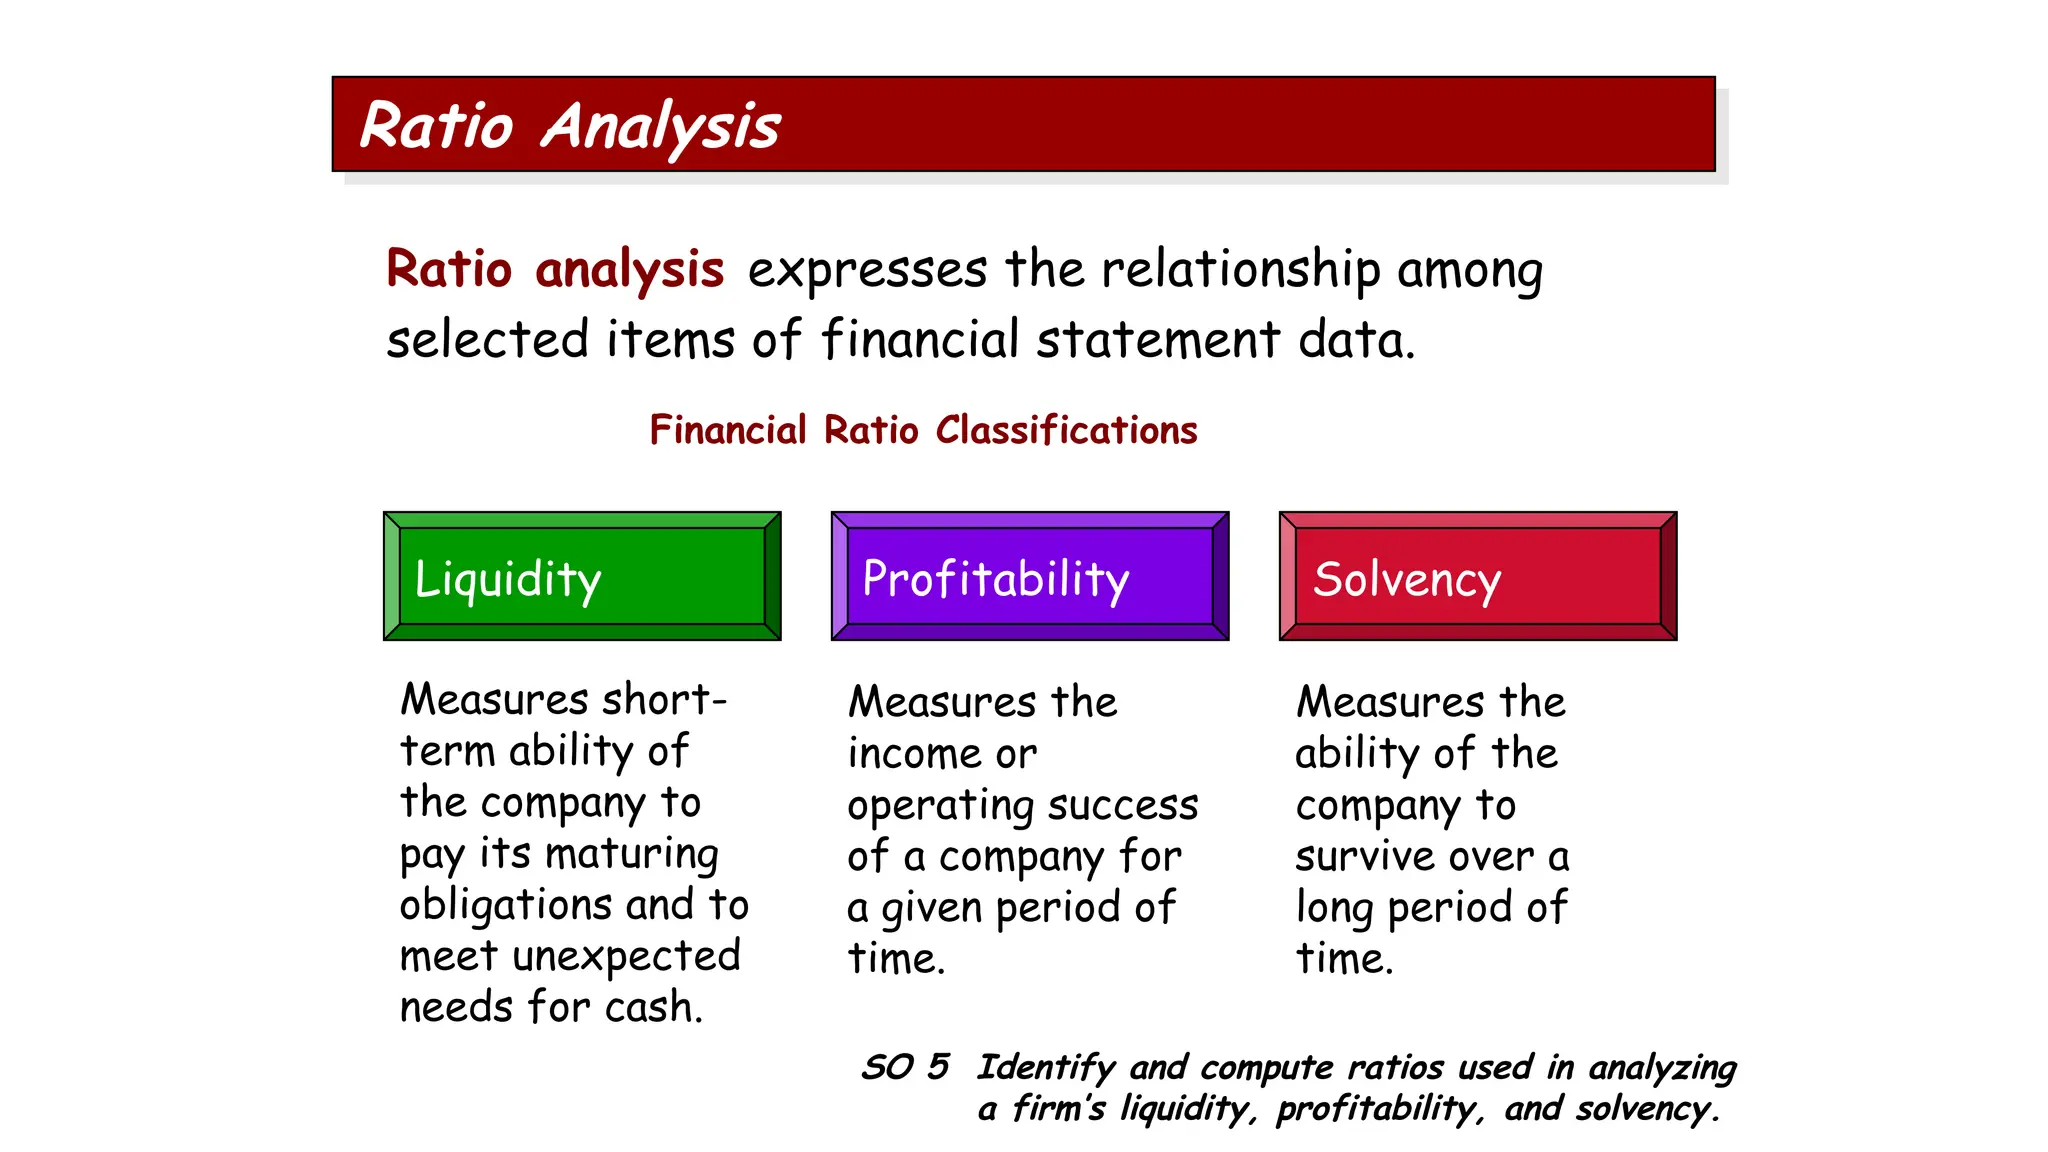
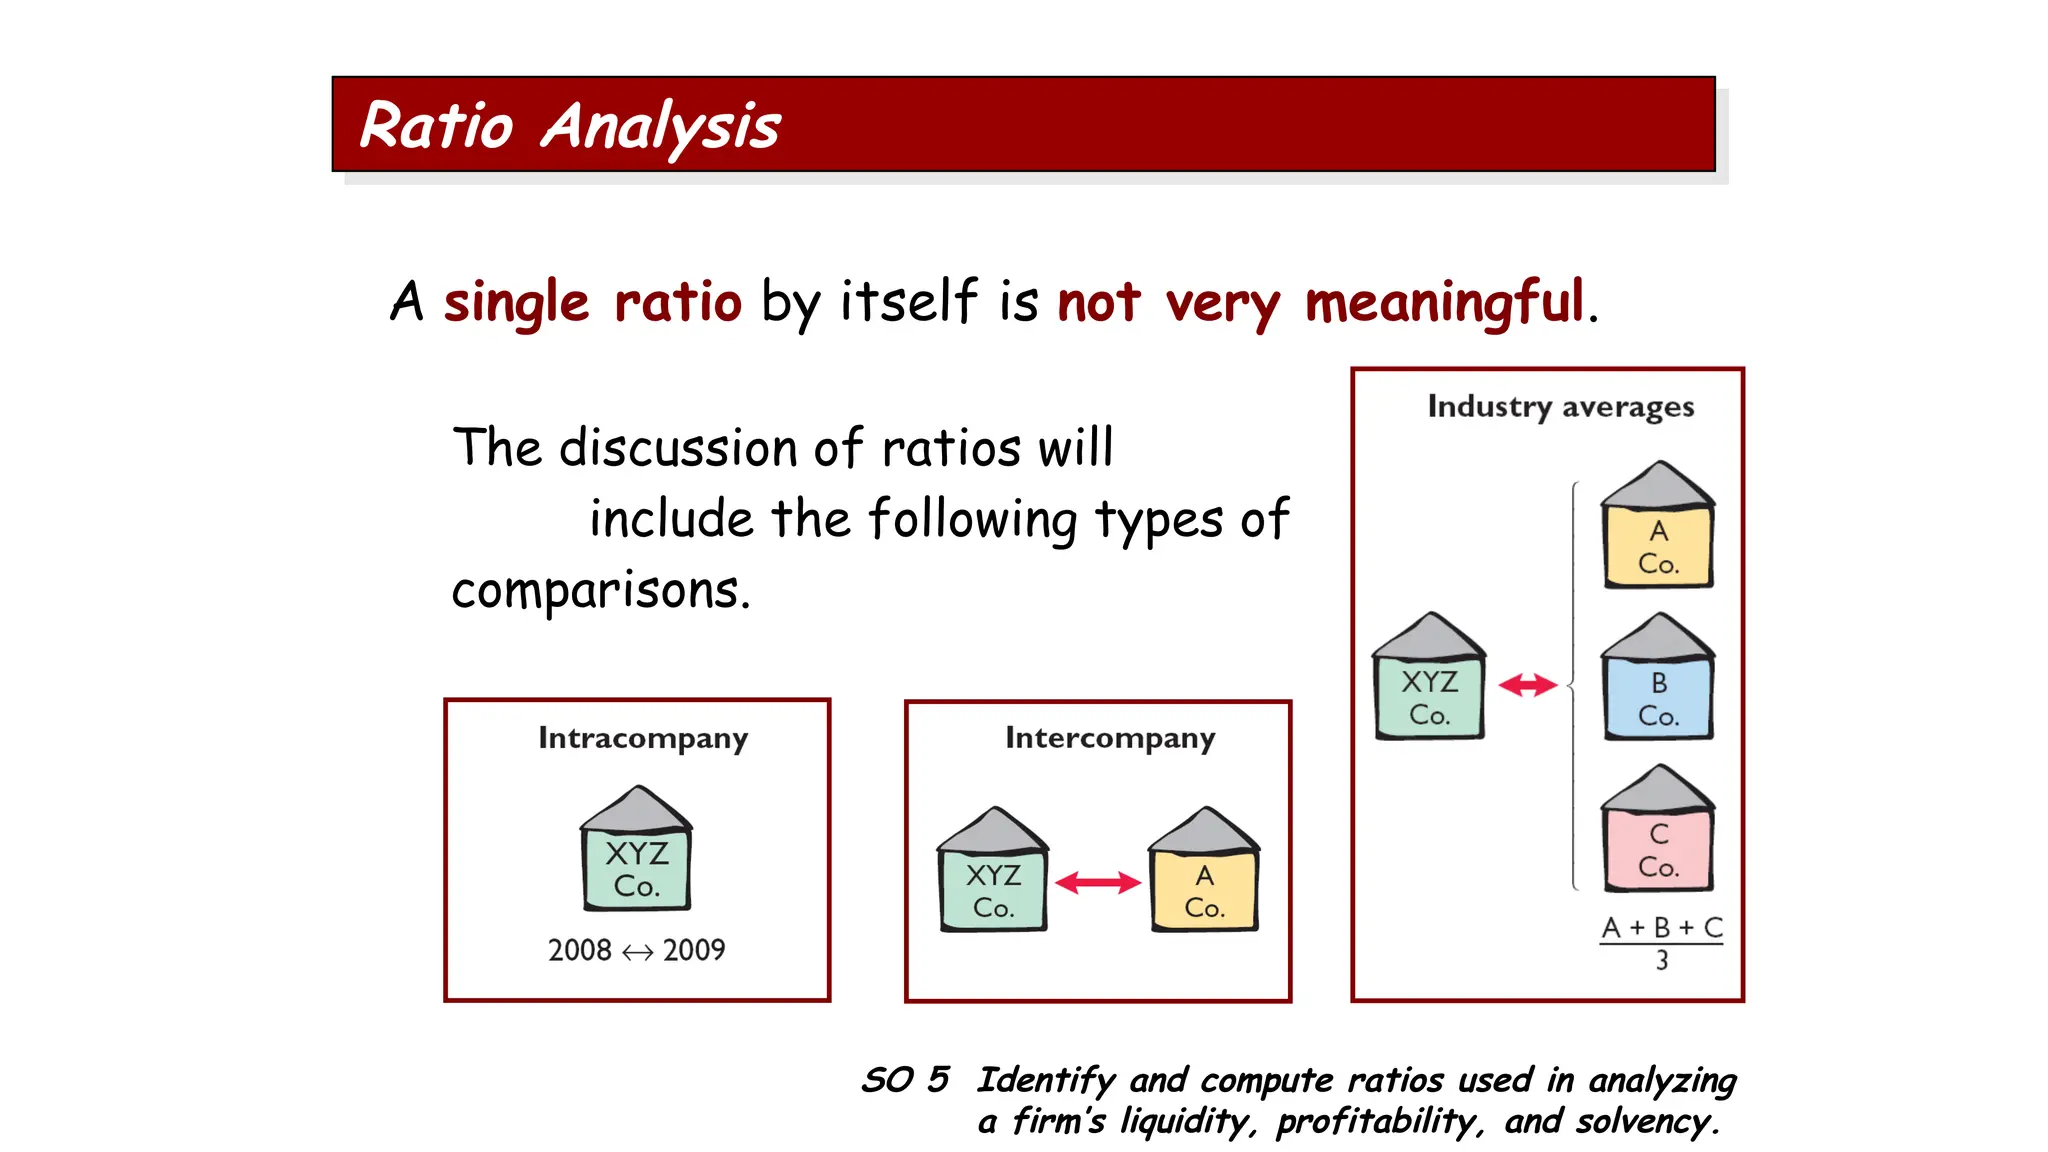
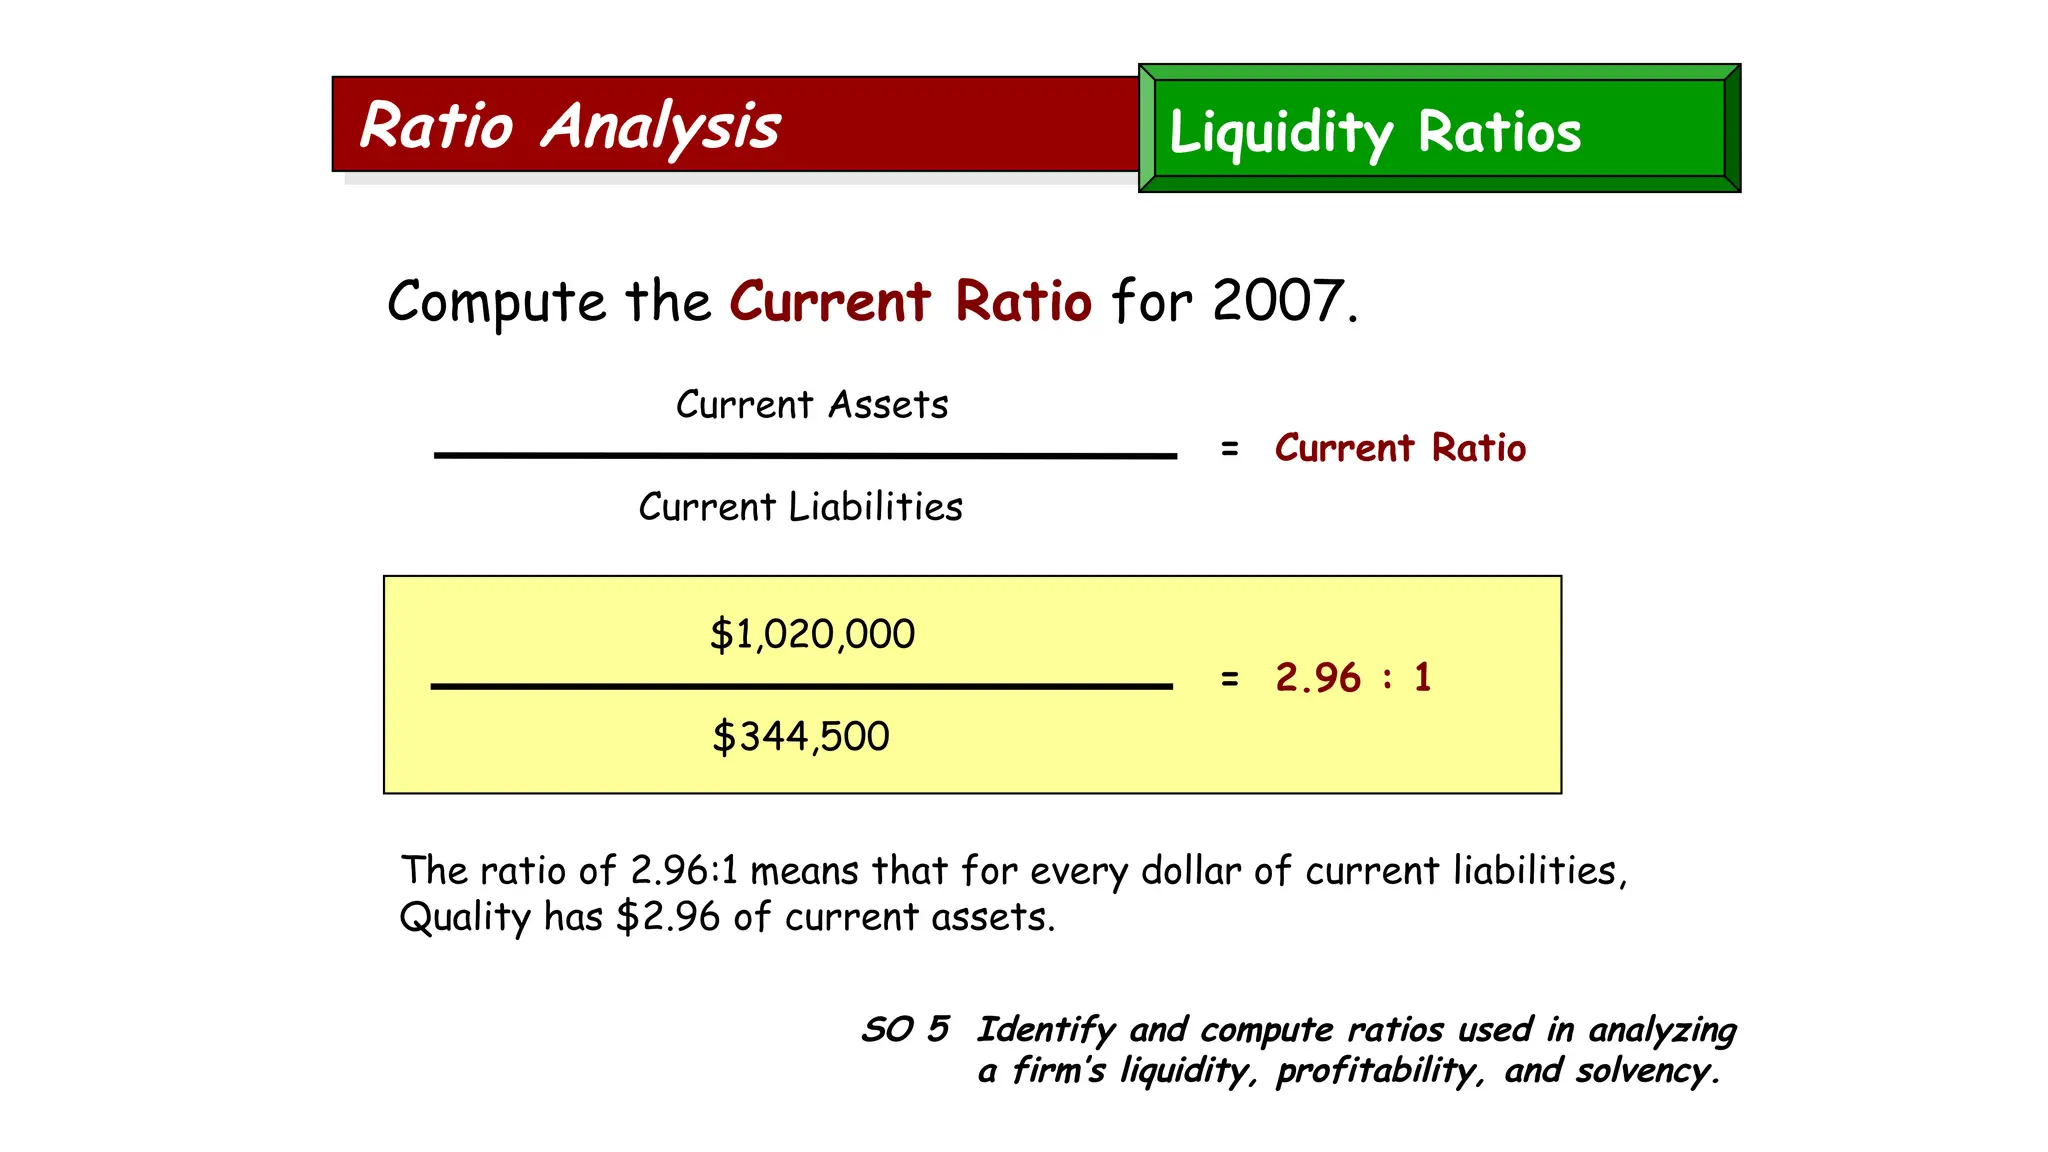
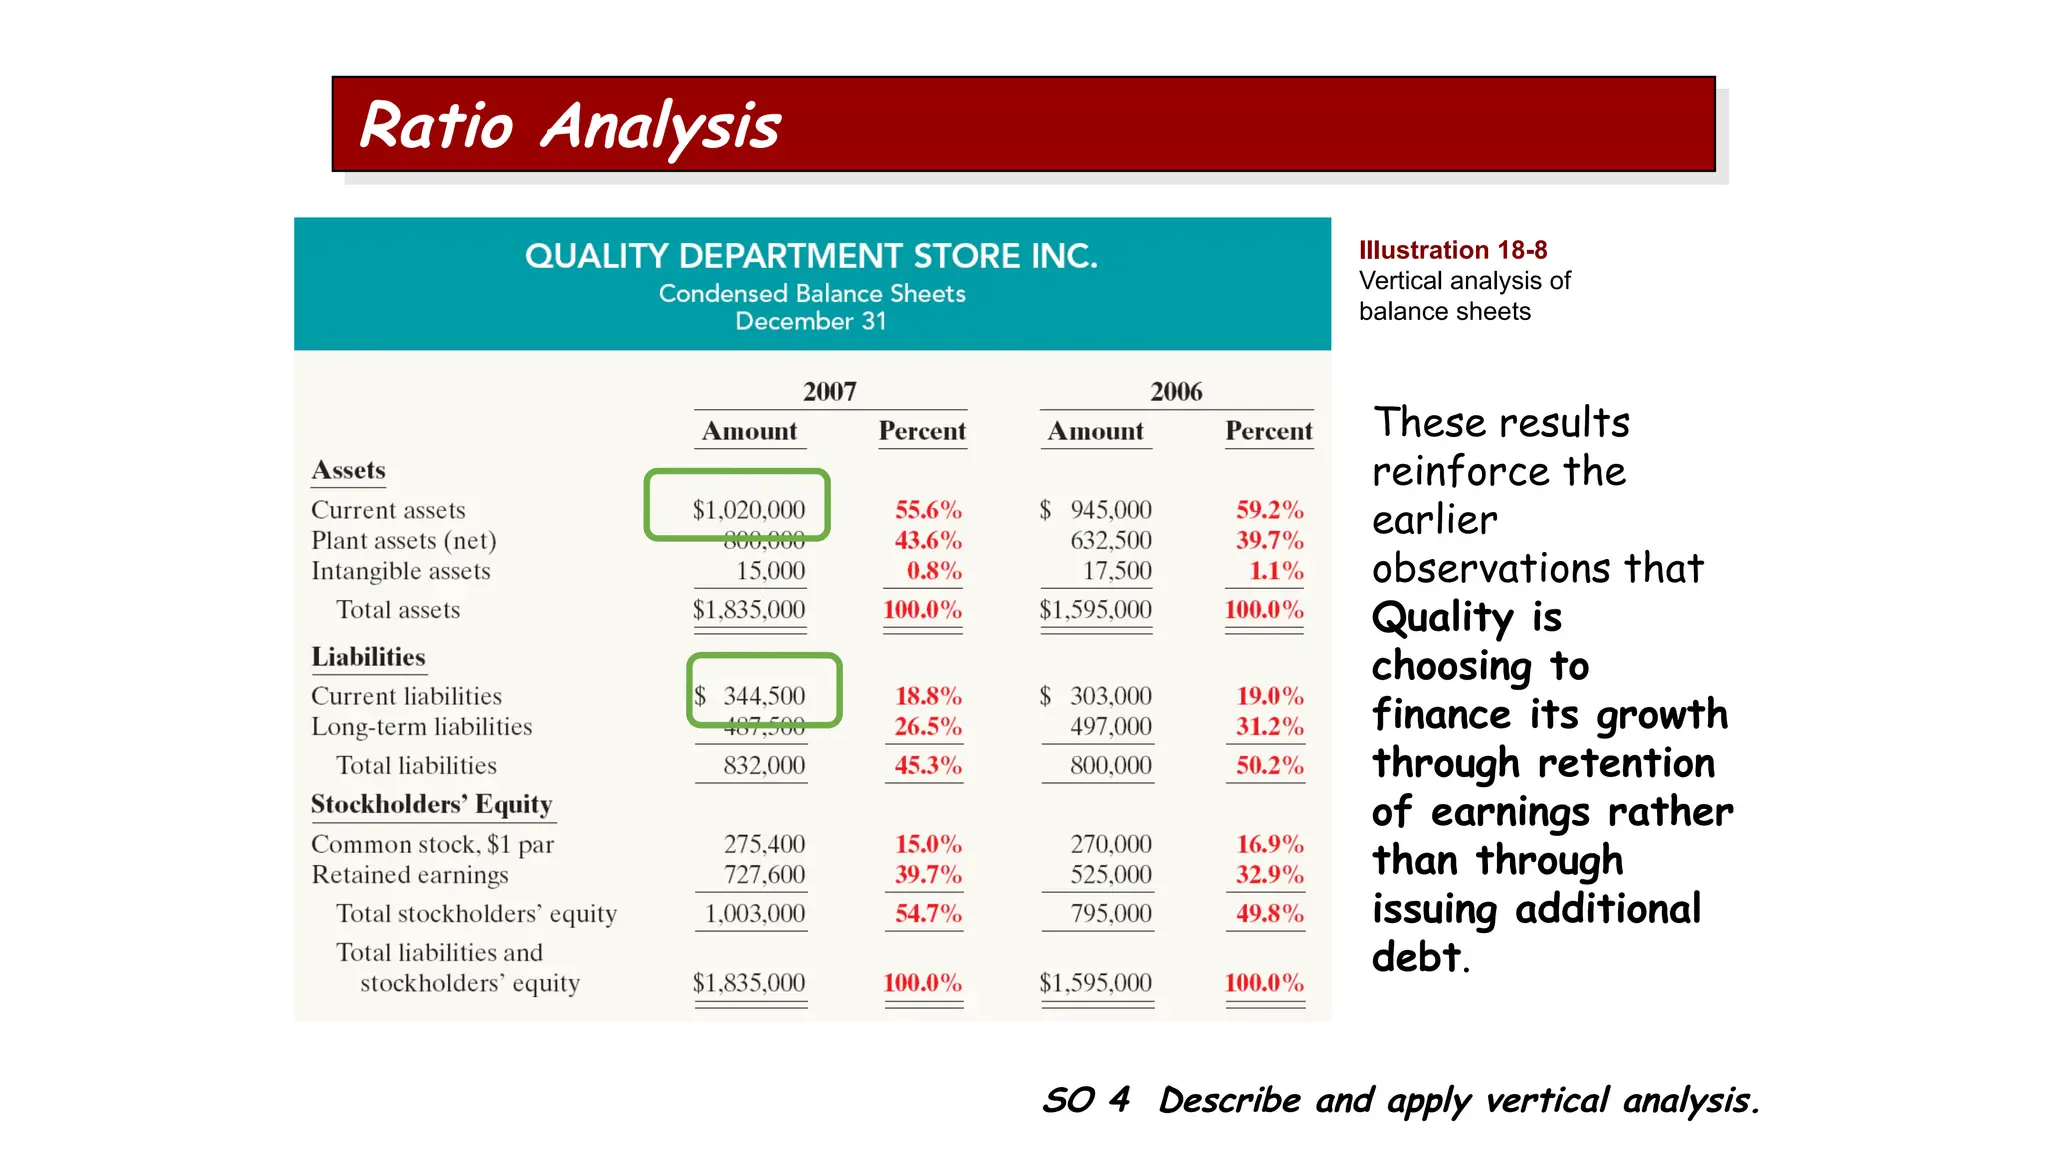
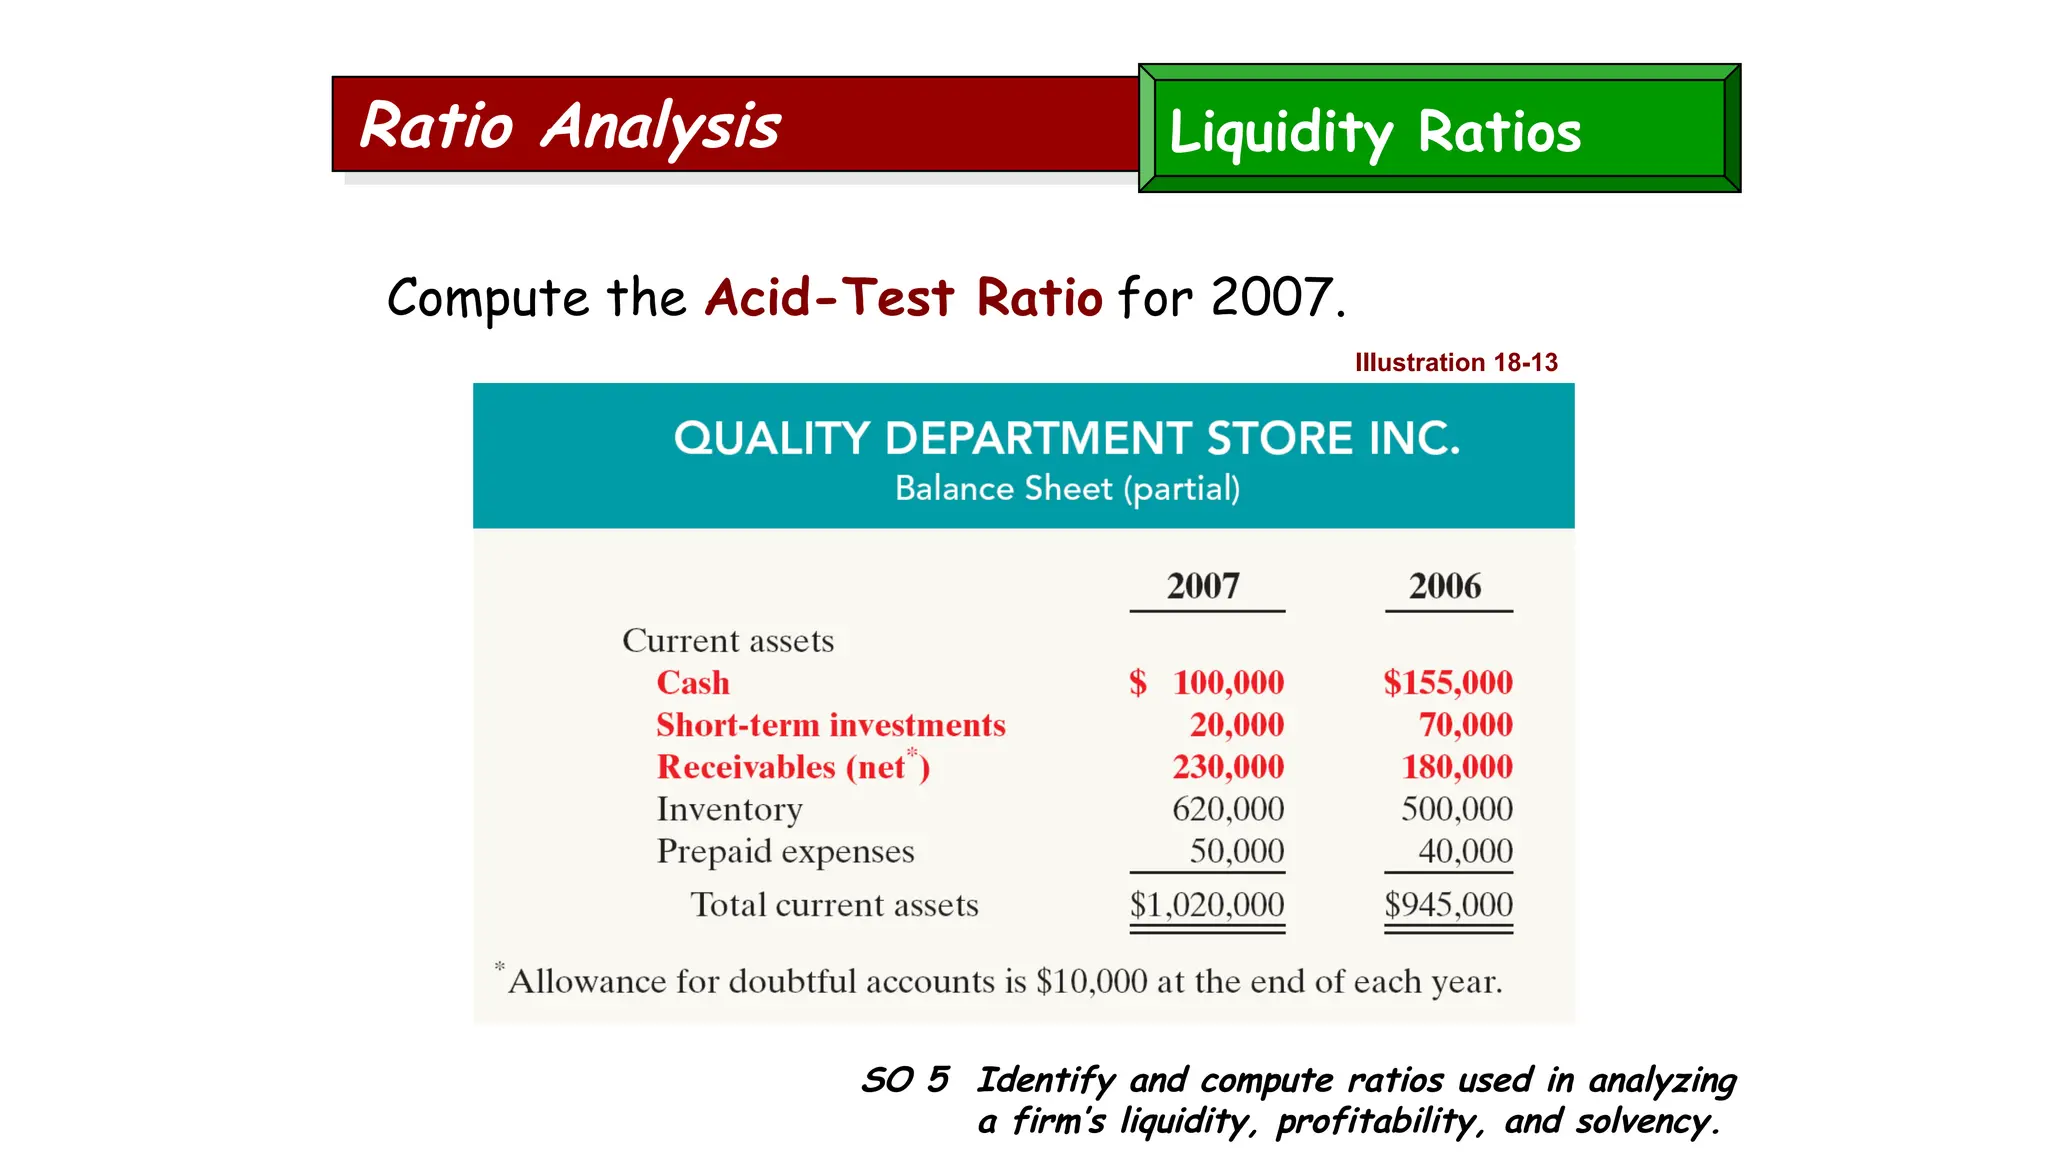
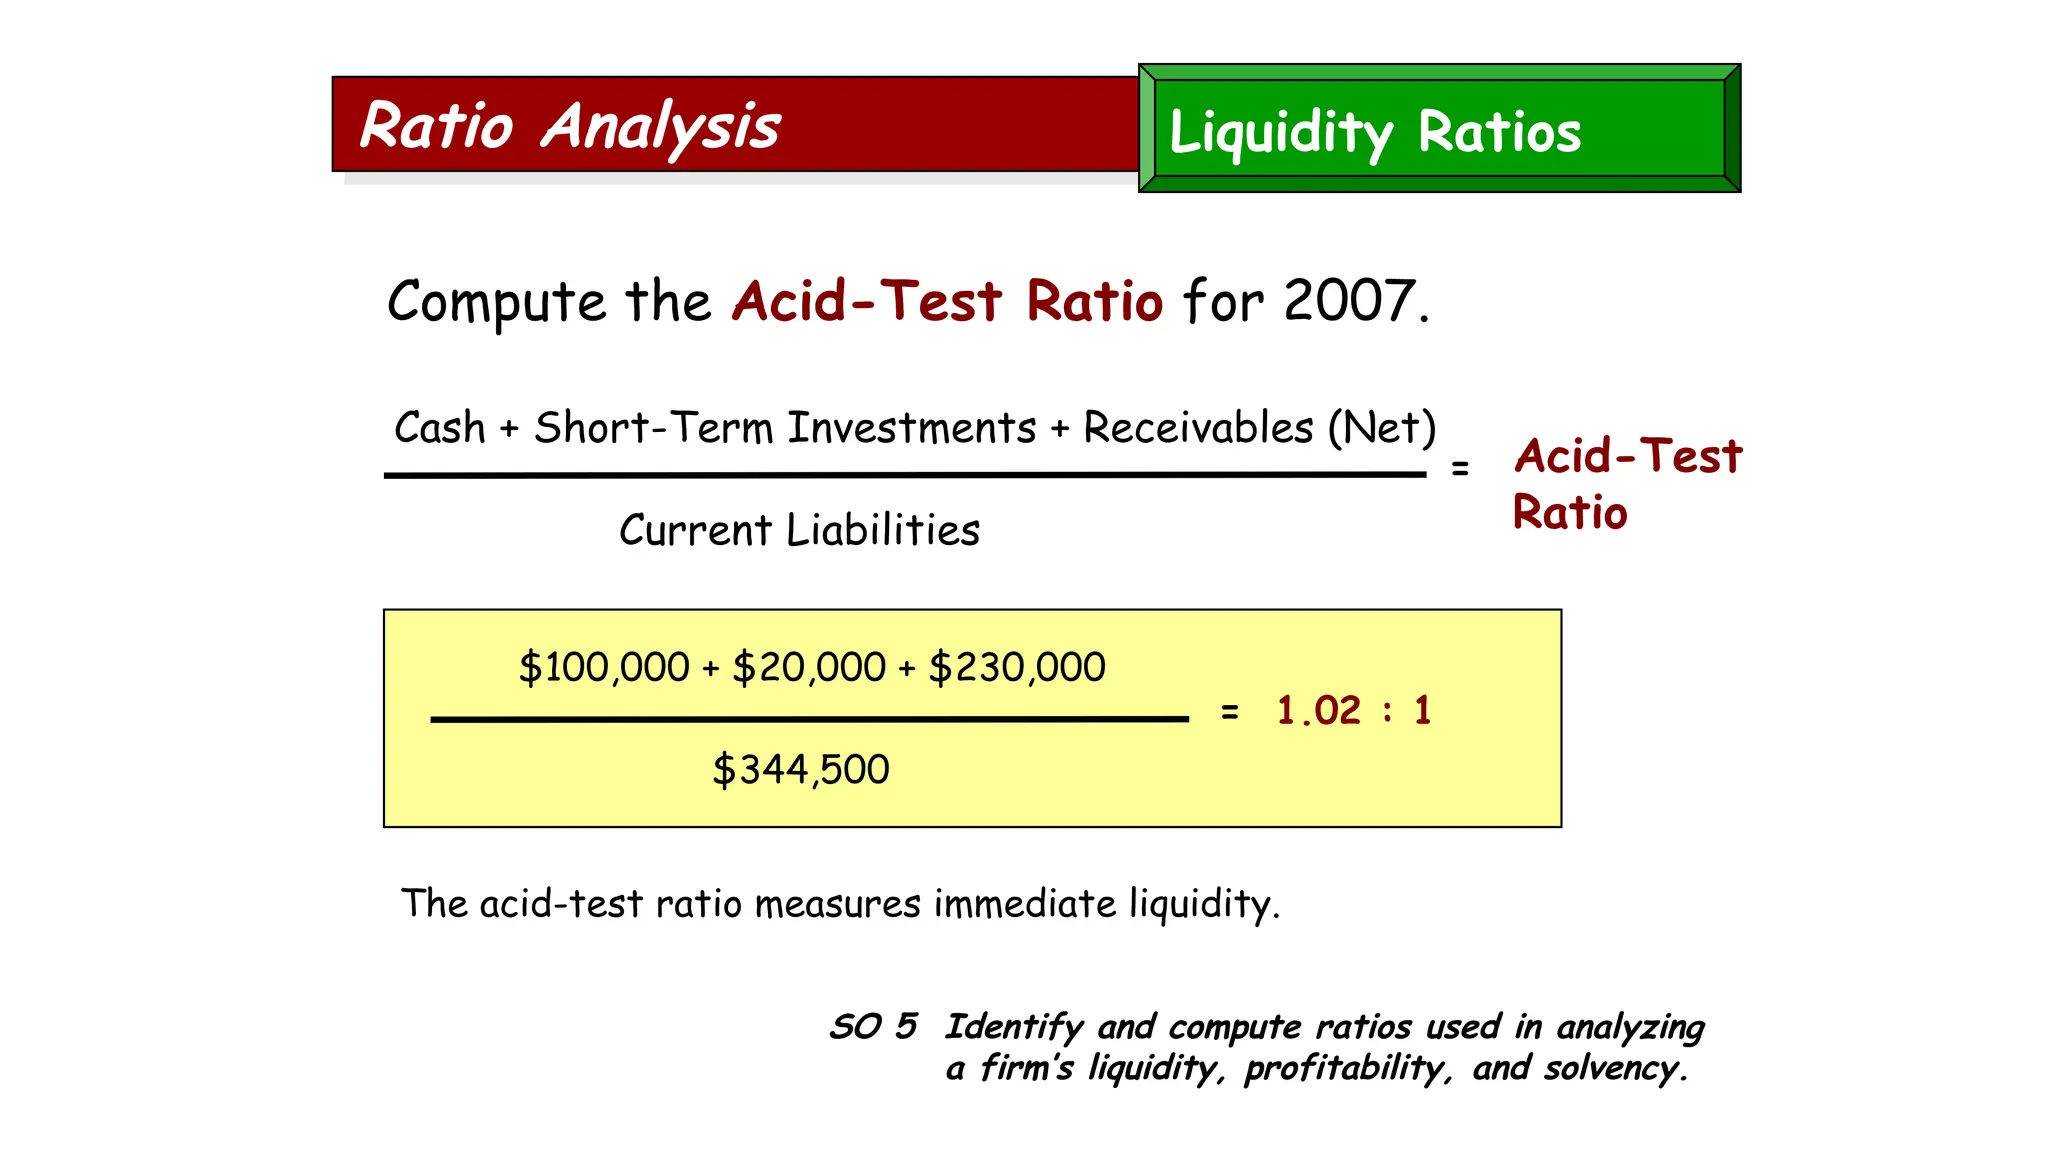
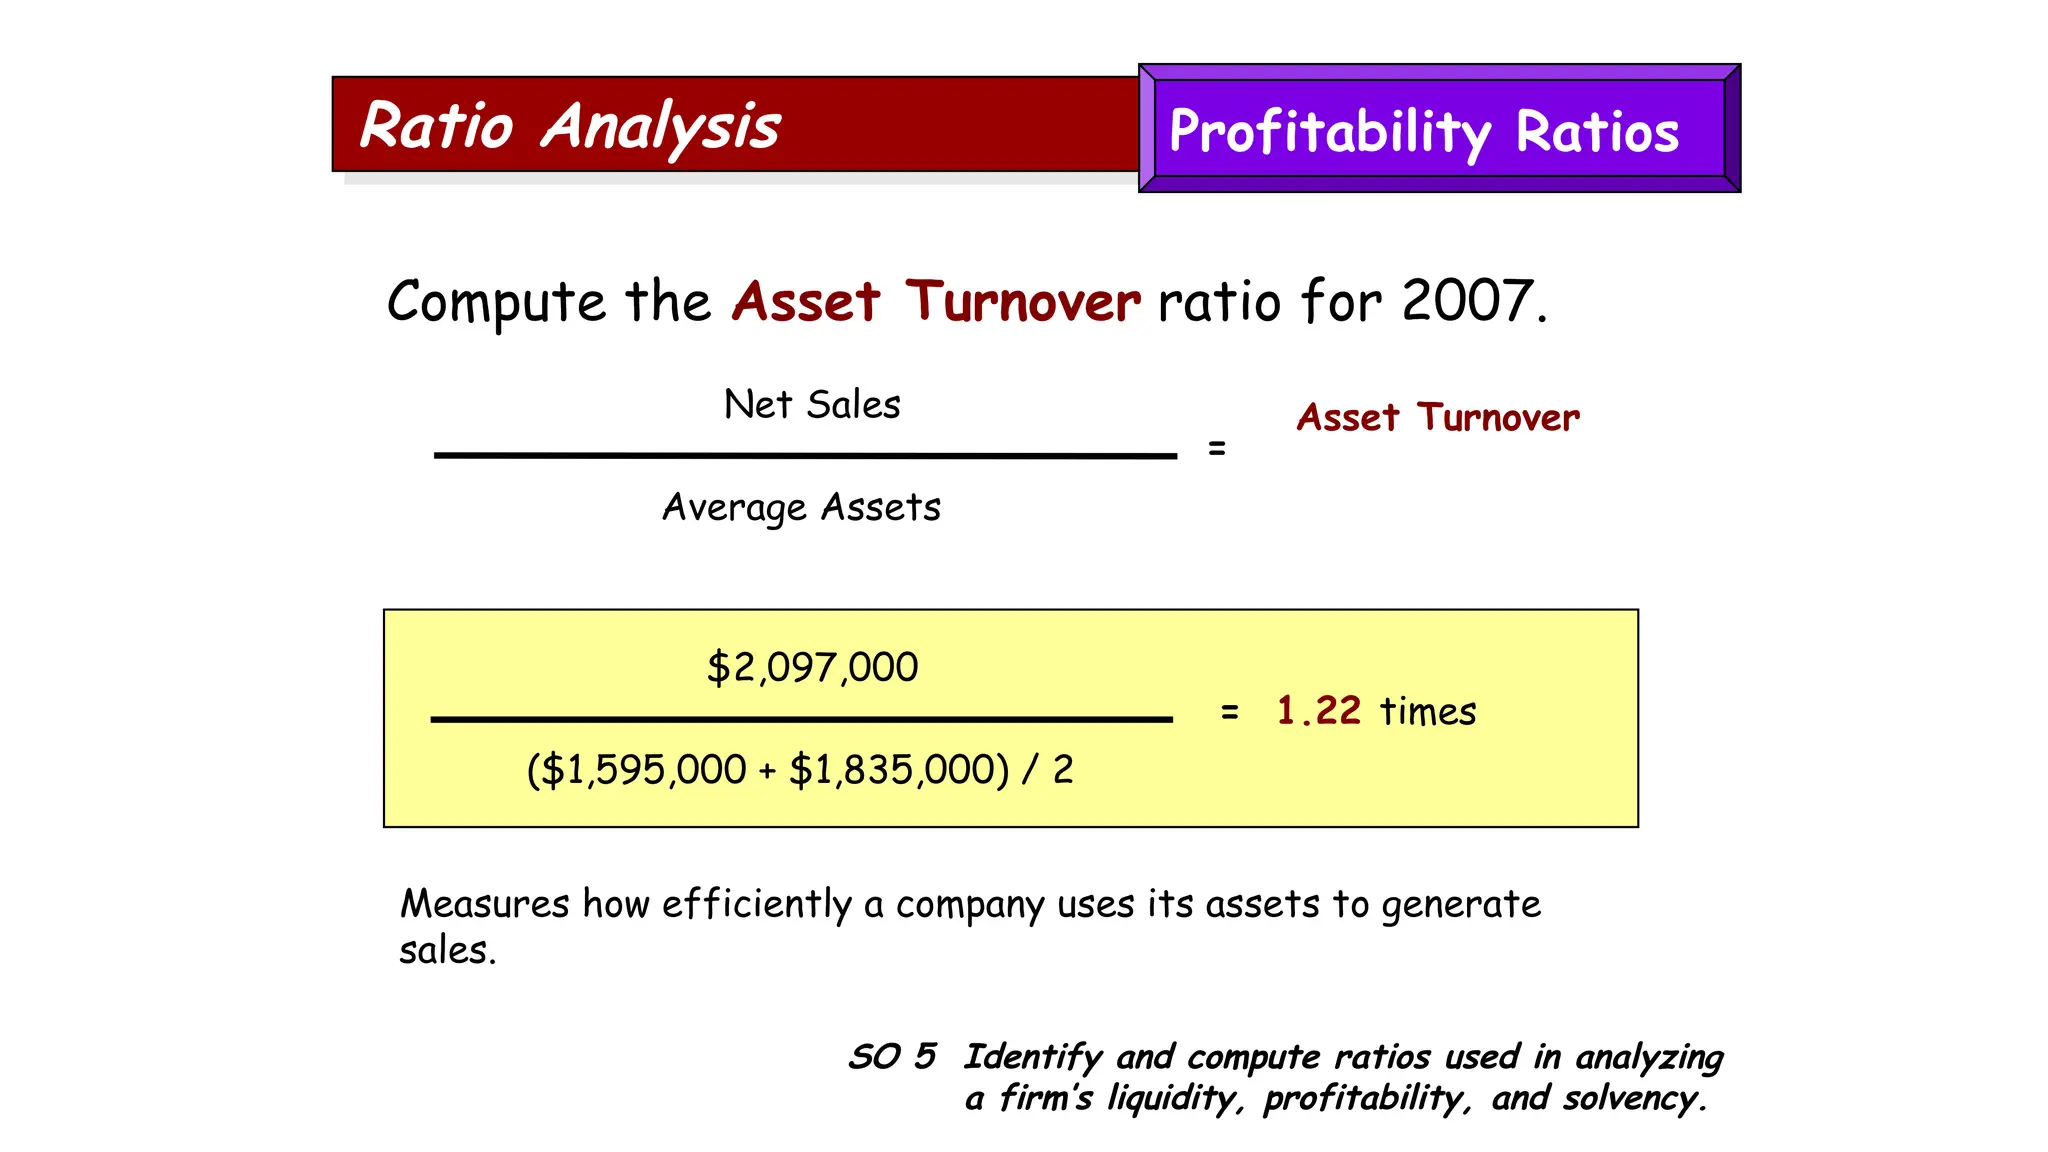
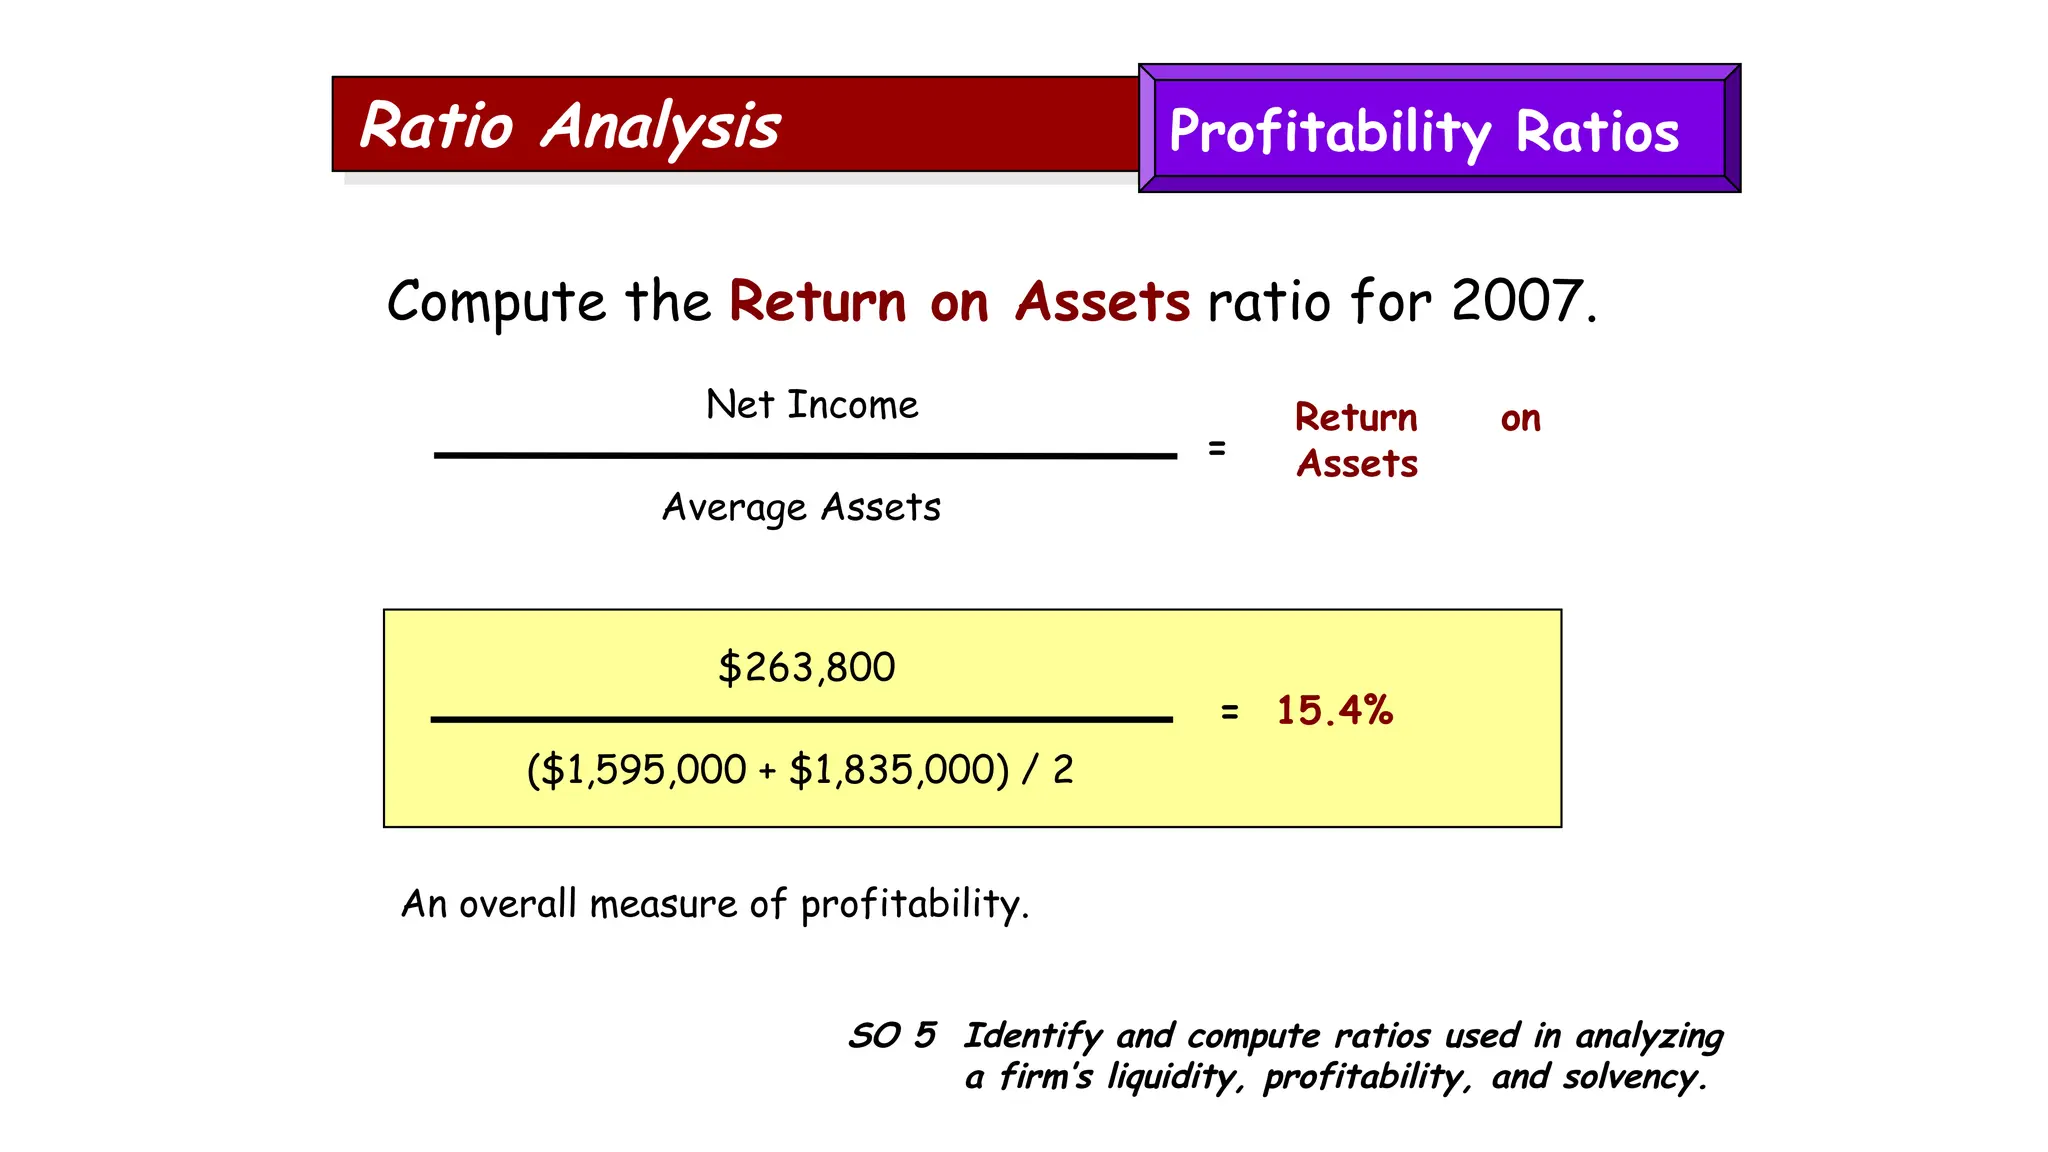
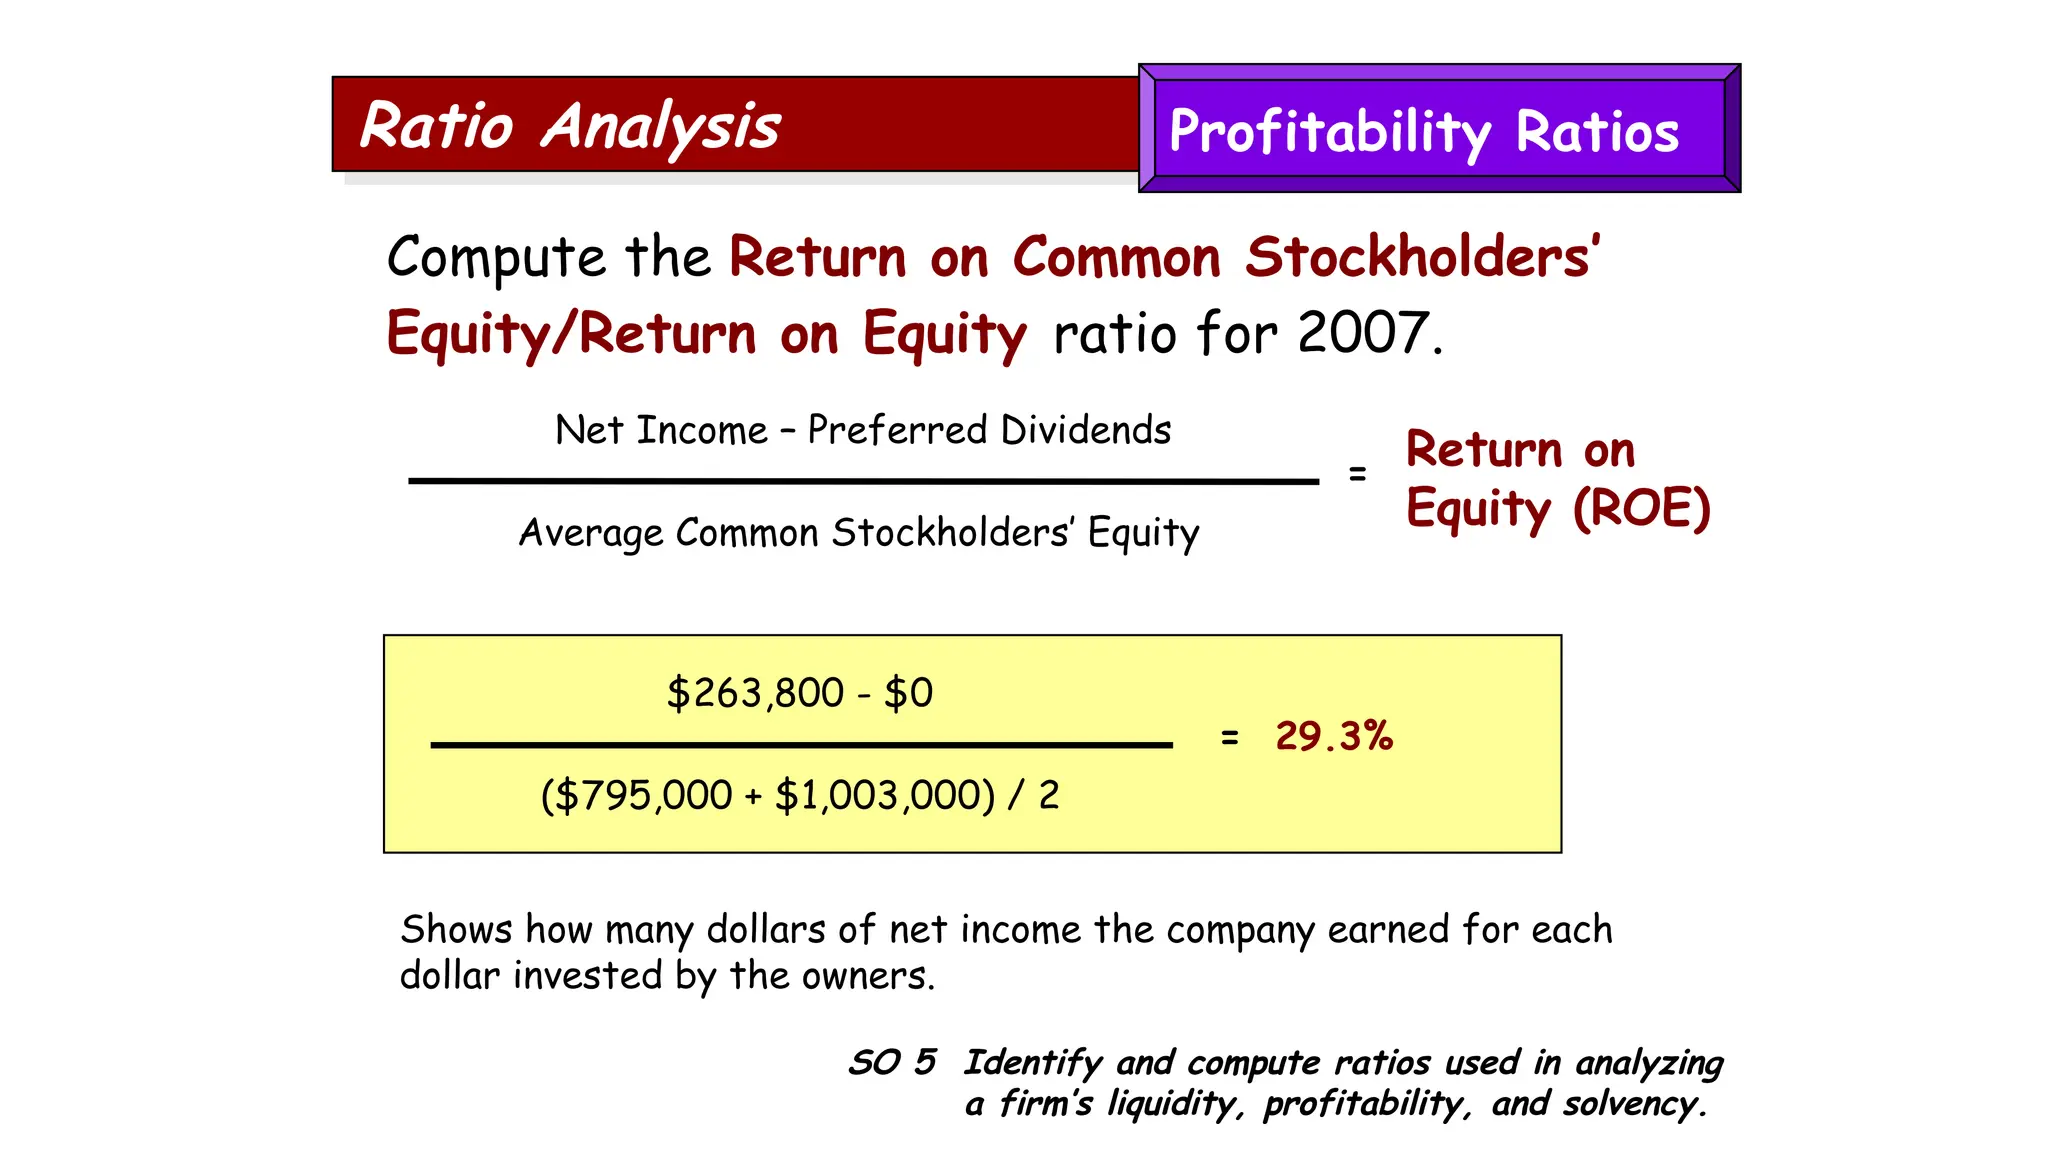
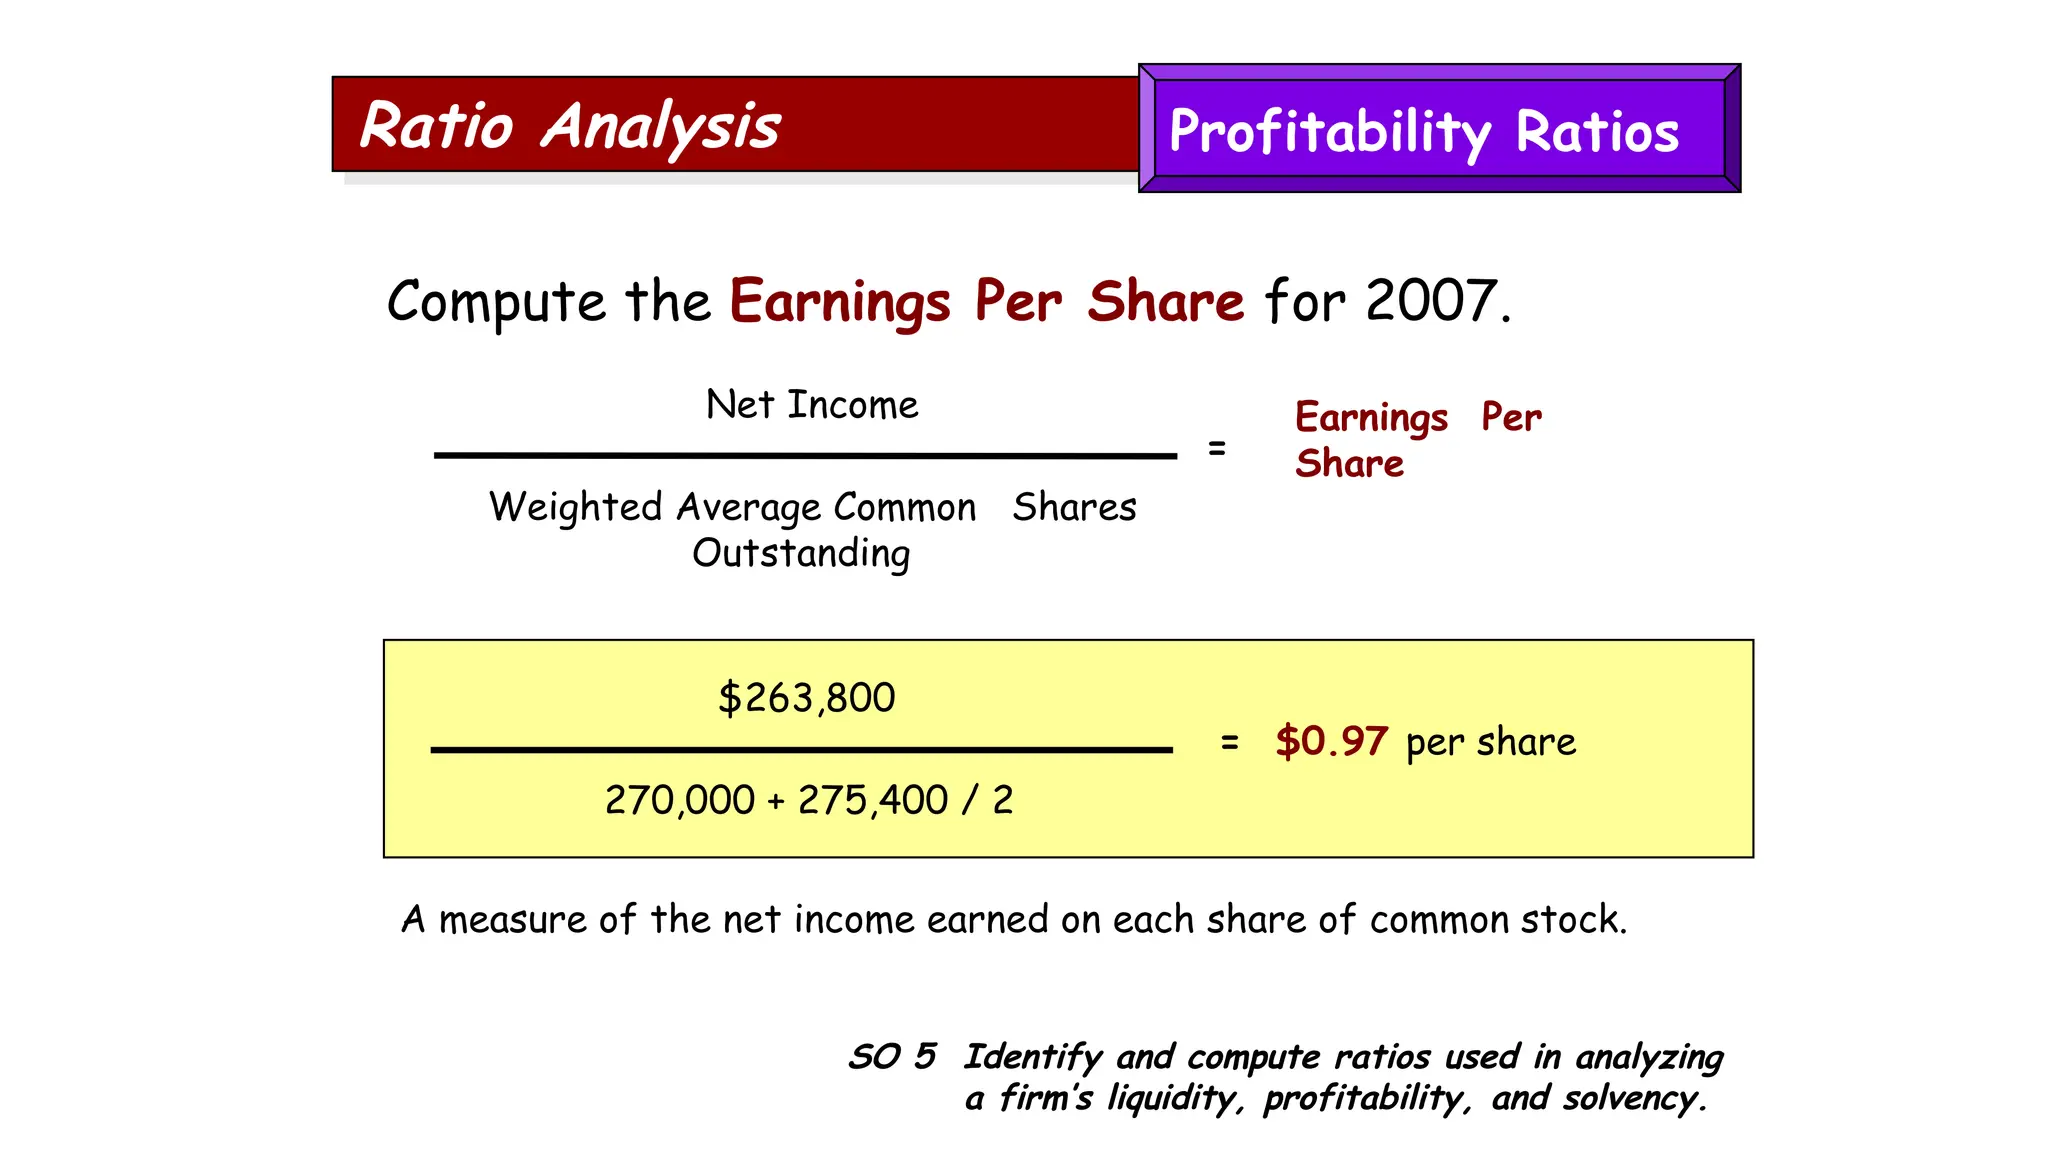
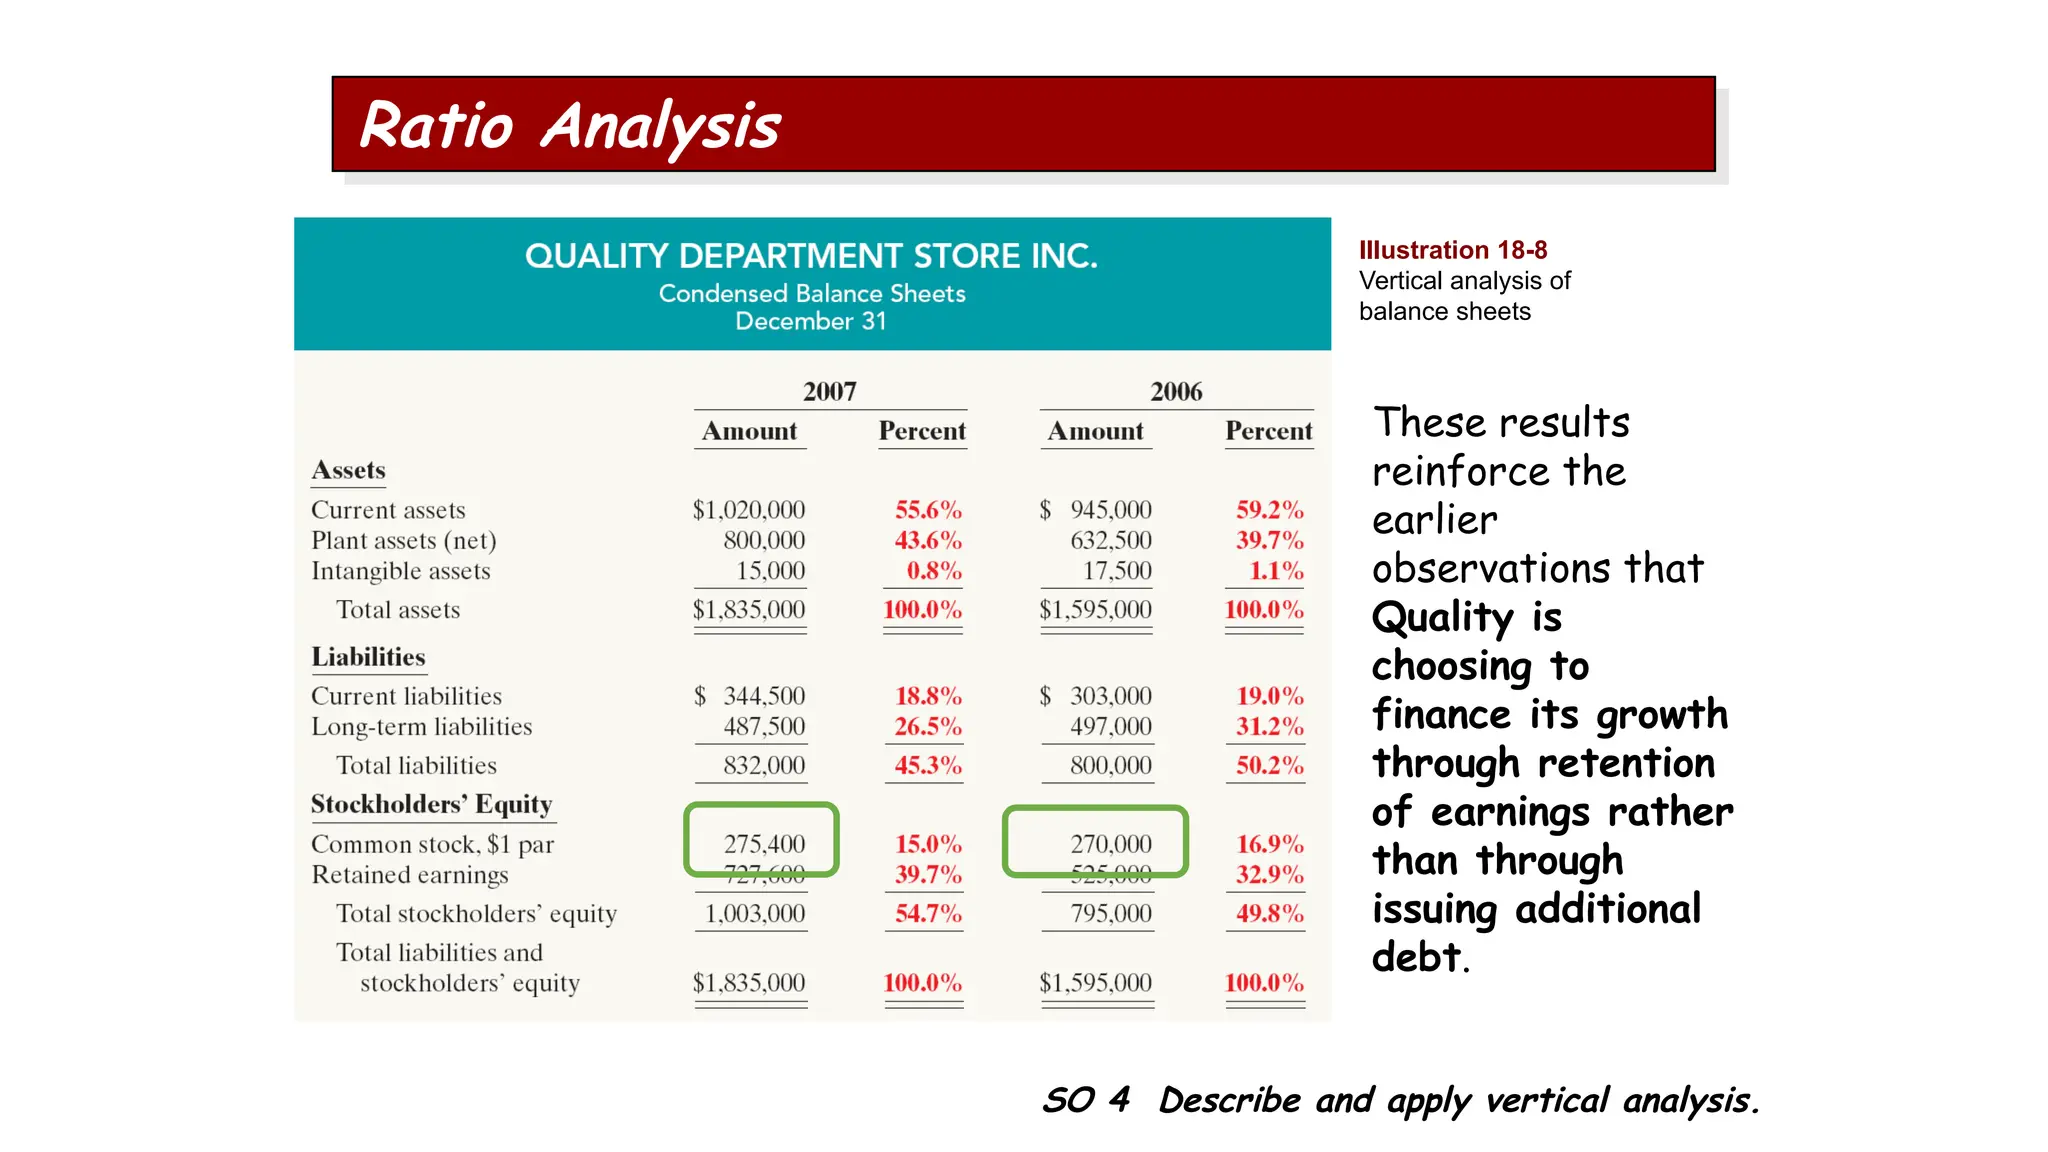
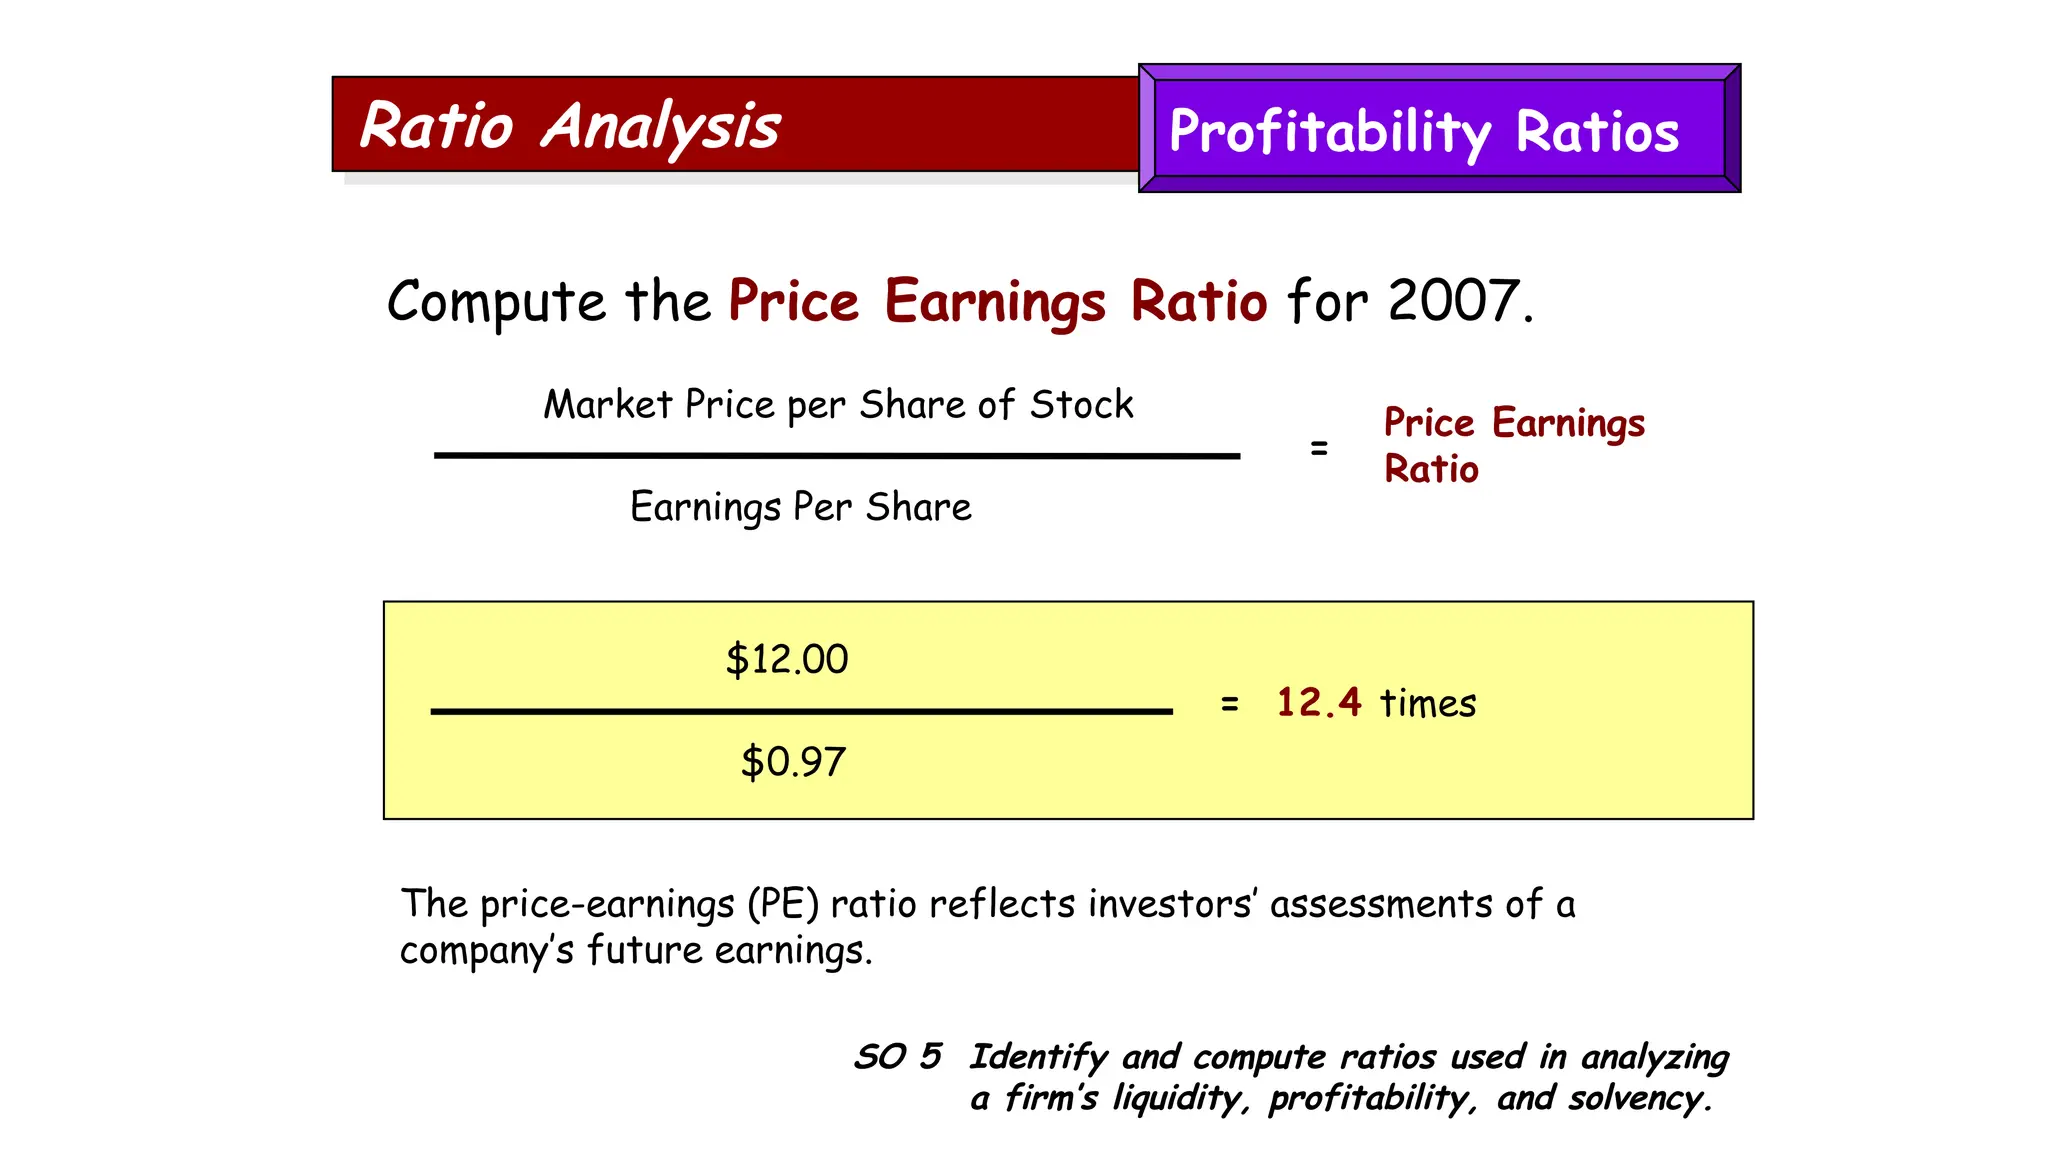
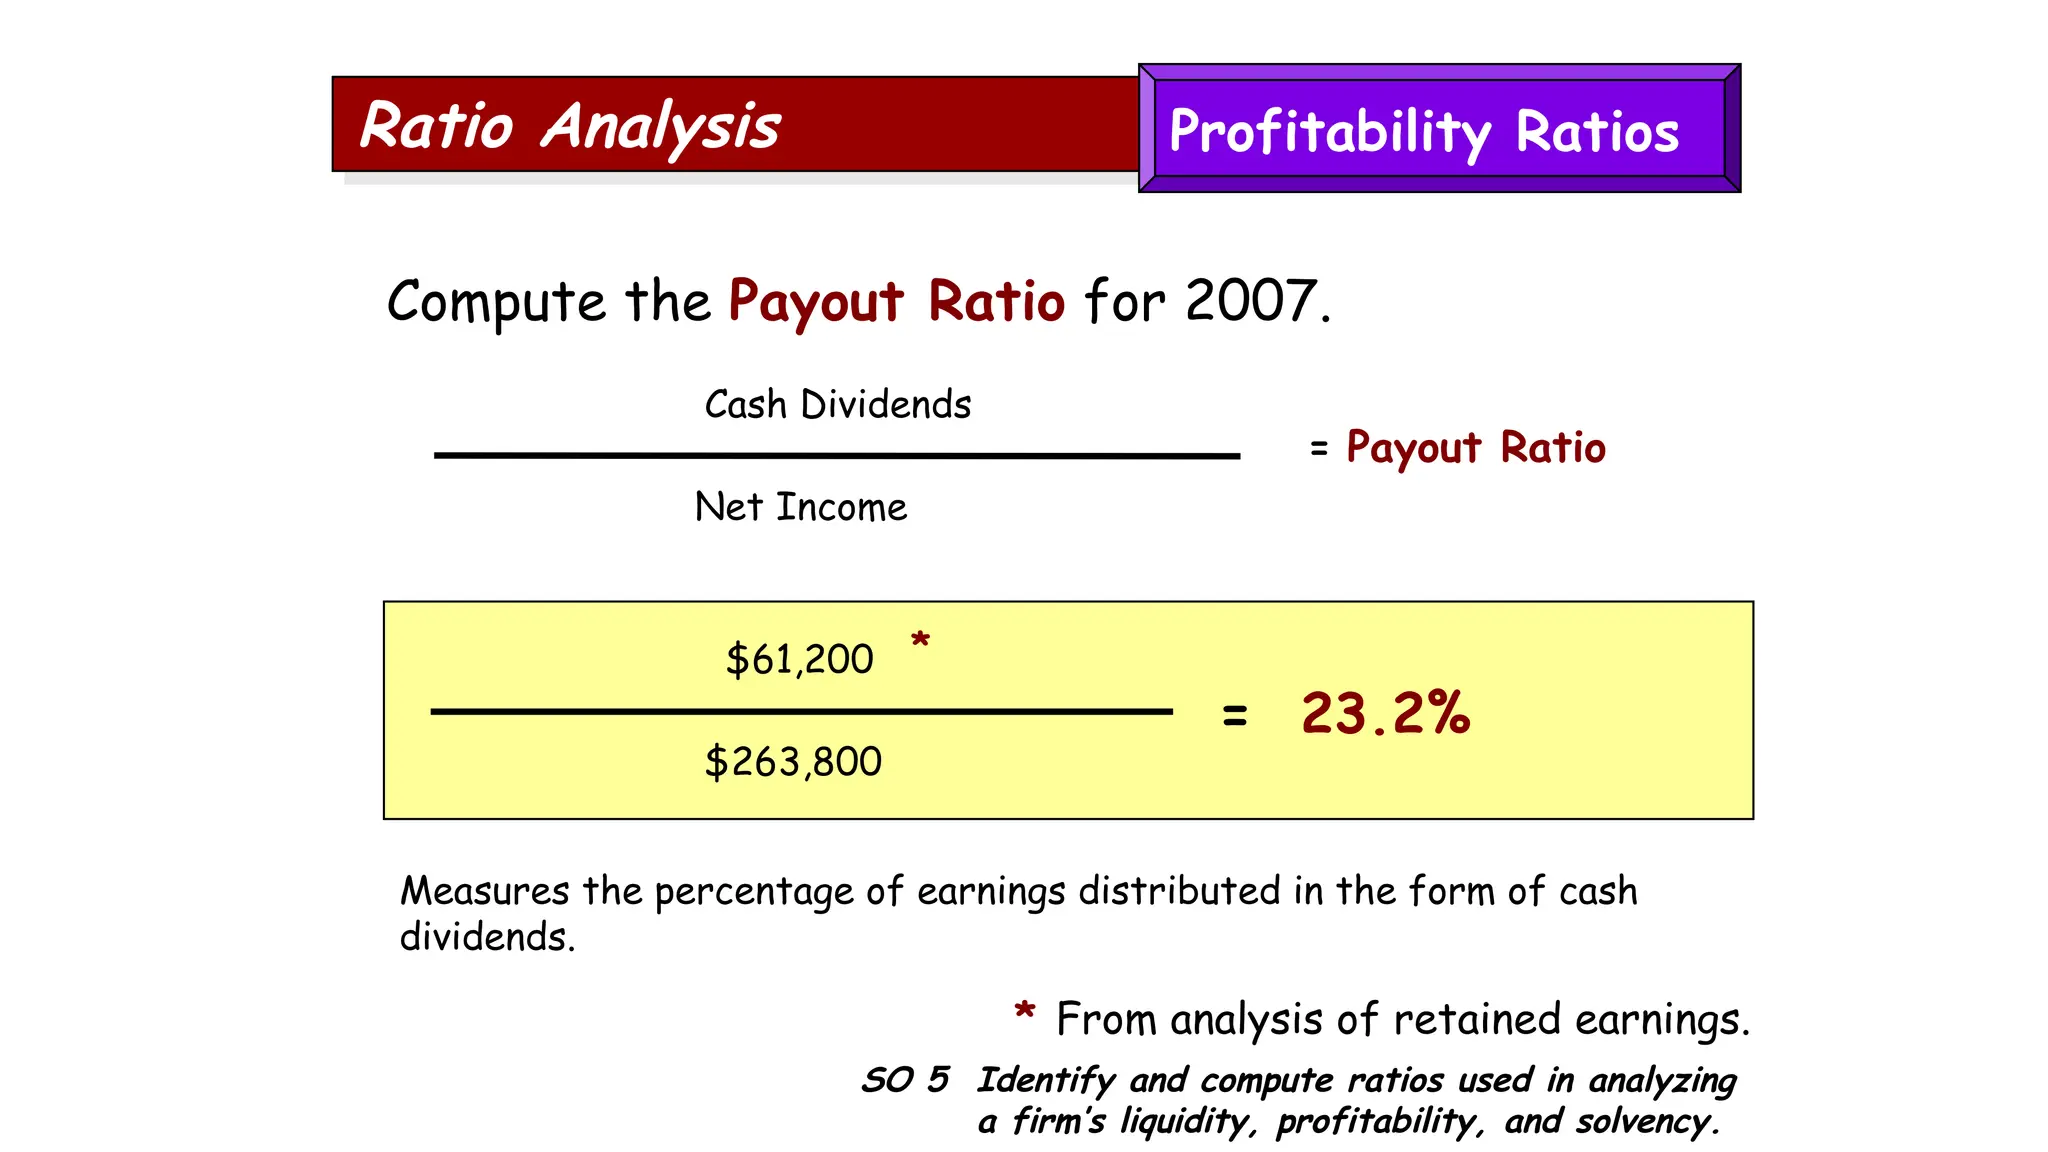
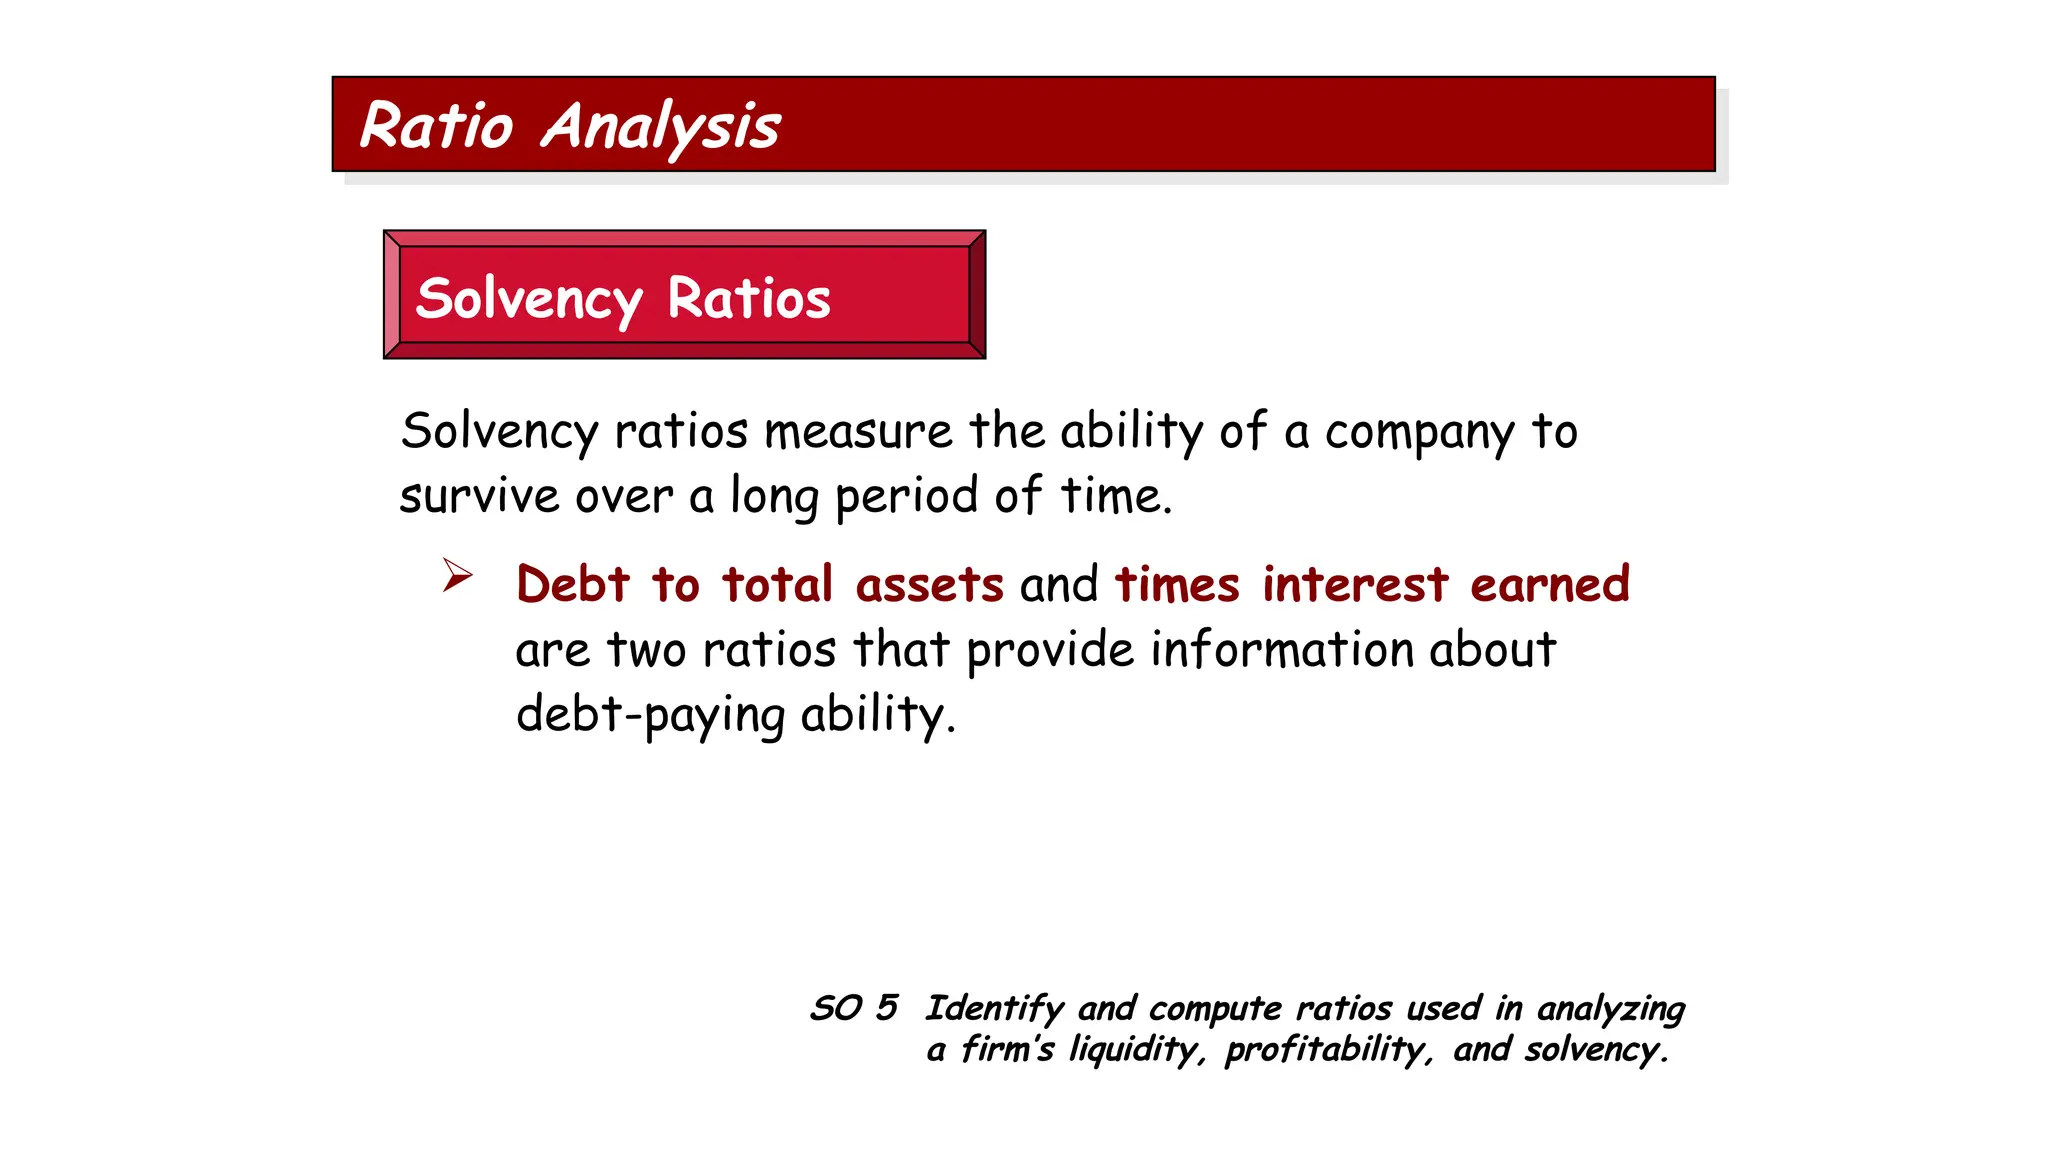
Financial Statement
Analysis
1. Discuss the need for comparative analysis.
2. Identify the tools of financial statement analysis.
3. Explain and apply horizontal analysis.
4. Describe and apply vertical analysis.
5. Identify and compute ratios used in analyzing a
firm’s liquidity, profitability, and solvency.
6. Understand the concept of earning power, and how
irregular items are presented.
7. Understand the concept of quality of earnings.
Study Objectives
Balance
sheet
Income
statement
Retained
earnings
statement
Basics of
Financial
Statement
Analysis
Horizontal and
Vertical
Analysis
Ratio Analysis
Earning Power
and Irregular
Items
Quality of
Earnings
Need for
comparative
analysis
Tools of
analysis
Liquidity
Profitability
Solvency
Summary
Discontinued
operations
Extraordinary
items
Changes in
accounting
principle
Comprehensive
income
Alternative
accounting
methods
Pro forma
income
Improper
recognition
Financial Statement Analysis
Analyzing financial statements involves:
Basics of Financial Statement Analysis
Characteristics
Comparison
Bases
Tools of
Analysis
Liquidity
Profitability
Solvency
Intracompany
Industry
averages
Intercompany
Horizontal
Vertical
Ratio
SO 1 Discuss the need for comparative analysis.
SO 2 Identify the tools of financial statement
analysis.
SO 3 Explain and apply horizontal analysis.
Horizontal Analysis
Horizontal analysis, also called trend analysis, is a
technique for evaluating a series of financial
statement data over a period of time.
Its purpose is to determine the increase or decrease
that has taken place.
Horizontal analysis is commonly applied to the balance
sheet, income statement, and statement of retained
earnings.
SO 3 Explain and apply horizontal analysis.
These changes
suggest that the
company expanded
its asset base
during 2007 and
financed this
expansion primarily
by retaining income
rather than
assuming additional
long-term debt.
Horizontal Analysis
Illustration 18-5
Horizontal analysis of
balance sheets
SO 3 Explain and apply horizontal analysis.
Overall, gross
profit and net
income were up
substantially. Gross
profit increased
17.1%, and net
income, 26.5%.
Quality’s profit
trend appears
favorable.
Horizontal Analysis
Illustration 18-6
Horizontal analysis of
Income statements
SO 3 Explain and apply horizontal analysis.
We saw in the horizontal analysis of the balance sheet that ending retained
earnings increased 38.6%. As indicated earlier, the company retained a
significant portion of net income to finance additional plant facilities.
Horizontal Analysis
Illustration 18-7
Horizontal analysis of
retained earnings
statements
SO 4 Describe and apply vertical analysis.
Vertical Analysis
Vertical analysis, also called common-size analysis, is
a technique that expresses each financial statement
item as a percent of a base amount.
On an income statement, we might say that selling
expenses are 16% of net sales.
Vertical analysis is commonly applied to the balance
sheet and the income statement.
These results
reinforce the
earlier
observations that
Quality is
choosing to
finance its growth
through retention
of earnings rather
than through
issuing additional
debt.
Illustration 18-8
Vertical analysis of
balance sheets
SO 4 Describe and apply vertical analysis.
Vertical Analysis
Quality appears
to be a profitable
enterprise that is
becoming even
more successful.
Illustration 18-9
Vertical analysis of
Income statements
SO 4 Describe and apply vertical analysis.
Vertical Analysis
Enables a comparison of companies of different sizes.
Illustration 18-10
Intercompany income
statement comparison
SO 4 Describe and apply vertical analysis.
Vertical Analysis
J.C. Penney earned net income more than 4,208 times larger than Quality’s, J.C.
Penney’s net income as a percent of each sales dollar (5.6%) is only 4% of
Quality’s (12.6%).
SO 5 Identify and compute ratios used in analyzing
a firm’s liquidity, profitability, and solvency.
Ratio Analysis
Ratio analysis expresses the relationship among
selected items of financial statement data.
Liquidity Profitability Solvency
Measures short-
term ability of
the company to
pay its maturing
obligations and to
meet unexpected
needs for cash.
Financial Ratio Classifications
Measures the
income or
operating success
of a company for
a given period of
time.
Measures the
ability of the
company to
survive over a
long period of
time.
SO 5 Identify and compute ratios used in analyzing
a firm’s liquidity, profitability, and solvency.
Ratio Analysis
The discussion of ratios will
include the following types of
comparisons.
A single ratio by itself is not very meaningful.
• Meaning: A ratio is a mathematical number calculated as a reference
to relationship of two or more numbers and can be expressed as a
fraction, proportion, percentage and a number of times. Ratios are
essentially derived numbers and their efficacy depends a great deal
upon the basic numbers from which they are calculated. Further, a
ratio must be calculated using numbers which are meaningfully
correlated.
• Objectives of Ratio Analysis:
1. To know the areas of the business which need more attention;
2. To know about the potential areas which can be improved with the effort
in the desired direction;
3. To provide a deeper analysis of the profitability, liquidity, solvency and
efficiency levels in the business;
4. To provide information for making cross-sectional analysis by comparing
the performance with the best industry standards; and
5. To provide information derived from financial statements useful for
making projections and estimates for the future.
SO 5 Identify and compute ratios used in analyzing
a firm’s liquidity, profitability, and solvency.
Ratio Analysis
Liquidity Ratios
Measure the short-term ability of the company to pay
its maturing obligations and to meet unexpected needs
for cash.
 Short-term creditors such as bankers and
suppliers are particularly interested in assessing
liquidity.
 Ratios include the current ratio, the acid-test
ratio, receivables turnover, and inventory
turnover.
SO 5 Identify and compute ratios used in analyzing
a firm’s liquidity, profitability, and solvency.
Ratio Analysis
Compute the Current Ratio for 2007.
The ratio of 2.96:1 means that for every dollar of current liabilities,
Quality has $2.96 of current assets.
Current Assets
Current Liabilities
= Current Ratio
$1,020,000
$344,500
= 2.96 : 1
Liquidity Ratios
These results
reinforce the
earlier
observations that
Quality is
choosing to
finance its growth
through retention
of earnings rather
than through
issuing additional
debt.
Illustration 18-8
Vertical analysis of
balance sheets
SO 4 Describe and apply vertical analysis.
Ratio Analysis
SO 5 Identify and compute ratios used in analyzing
a firm’s liquidity, profitability, and solvency.
Ratio Analysis
Compute the Acid-Test Ratio for 2007.
Liquidity Ratios
Illustration 18-13
SO 5 Identify and compute ratios used in analyzing
a firm’s liquidity, profitability, and solvency.
Ratio Analysis
Compute the Acid-Test Ratio for 2007.
The acid-test ratio measures immediate liquidity.
Cash + Short-Term Investments + Receivables (Net)
Current Liabilities
Acid-Test
Ratio
$100,000 + $20,000 + $230,000
$344,500
= 1.02 : 1
=
Liquidity Ratios
SO 5 Identify and compute ratios used in analyzing
a firm’s liquidity, profitability, and solvency.
Ratio Analysis
Compute the Receivables Turnover ratio for 2007.
It measures the number of times, on average, the company collects
receivables during the period.
$2,097,000
($180,000 + $230,000) / 2
= 10.2 times
Net Credit Sales
Average Net Receivables
Receivables
Turnover
=
Liquidity Ratios
Quality appears
to be a profitable
enterprise that is
becoming even
more successful.
Illustration 18-9
Vertical analysis of
Income statements
SO 4 Describe and apply vertical analysis.
Ratio Analysis
SO 5 Identify and compute ratios used in analyzing
a firm’s liquidity, profitability, and solvency.
Ratio Analysis
Compute the Acid-Test Ratio for 2007.
Liquidity Ratios
Illustration 18-13
SO 5 Identify and compute ratios used in analyzing
a firm’s liquidity, profitability, and solvency.
Ratio Analysis
A variant of the receivables turnover ratio is to convert
it to an average collection period in terms of days.
This means that receivables are collected on average
every 36 days.
$2,097,000
($180,000 + $230,000) / 2
= 10.2 times
Liquidity Ratios
365 days / 10.2 times = every 35.78 days
Receivables Turnover
SO 5 Identify and compute ratios used in analyzing
a firm’s liquidity, profitability, and solvency.
Ratio Analysis
Compute the Inventory Turnover ratio for 2007.
Inventory turnover measures the number of times, on average, the
inventory is sold during the period.
$1,281,000
($500,000 + $620,000) / 2
= 2.31 times
Cost of Good Sold
Average Inventory
Inventory
Turnover
=
Liquidity Ratios
Quality appears
to be a profitable
enterprise that is
becoming even
more successful.
Illustration 18-9
Vertical analysis of
Income statements
SO 4 Describe and apply vertical analysis.
Ratio Analysis
SO 5 Identify and compute ratios used in analyzing
a firm’s liquidity, profitability, and solvency.
Ratio Analysis
Compute the Acid-Test Ratio for 2007.
Liquidity Ratios
Illustration 18-13
SO 5 Identify and compute ratios used in analyzing
a firm’s liquidity, profitability, and solvency.
Ratio Analysis
A variant of inventory turnover is the days in inventory.
Inventory turnover ratios vary considerably among
industries.
Liquidity Ratios
365 days / 2.3 times = every 159 days
$1,281,000
($500,000 + $620,000) / 2
= 2.3 times
Inventory Turnover
SO 5 Identify and compute ratios used in analyzing
a firm’s liquidity, profitability, and solvency.
Ratio Analysis
Profitability Ratios
Measure the income or operating success of a company
for a given period of time.
 Income, or the lack of it, affects the company’s
ability to obtain debt and equity financing,
liquidity position, and the ability to grow.
 Ratios include the profit margin, asset turnover,
return on assets, return on common stockholders’
equity, earnings per share, price-earnings, and
payout ratio.
SO 5 Identify and compute ratios used in analyzing
a firm’s liquidity, profitability, and solvency.
Ratio Analysis
Compute the Profit Margin ratio for 2007.
Measures the percentage of each dollar of sales that results in net
income.
$263,800
$2,097,000
= 12.6%
Net Income
Net Sales
Profit Margin
=
Profitability Ratios
Quality appears
to be a profitable
enterprise that is
becoming even
more successful.
Illustration 18-9
Vertical analysis of
Income statements
SO 4 Describe and apply vertical analysis.
Ratio Analysis
SO 5 Identify and compute ratios used in analyzing
a firm’s liquidity, profitability, and solvency.
Ratio Analysis
Compute the Asset Turnover ratio for 2007.
Measures how efficiently a company uses its assets to generate
sales.
$2,097,000
($1,595,000 + $1,835,000) / 2
= 1.22 times
Net Sales
Average Assets
Asset Turnover
=
Profitability Ratios
Quality appears
to be a profitable
enterprise that is
becoming even
more successful.
Illustration 18-9
Vertical analysis of
Income statements
SO 4 Describe and apply vertical analysis.
Ratio Analysis
These results
reinforce the
earlier
observations that
Quality is
choosing to
finance its growth
through retention
of earnings rather
than through
issuing additional
debt.
Illustration 18-8
Vertical analysis of
balance sheets
SO 4 Describe and apply vertical analysis.
Ratio Analysis
SO 5 Identify and compute ratios used in analyzing
a firm’s liquidity, profitability, and solvency.
Ratio Analysis
Compute the Return on Assets ratio for 2007.
An overall measure of profitability.
$263,800
($1,595,000 + $1,835,000) / 2
= 15.4%
Net Income
Average Assets
Return on
Assets
=
Profitability Ratios
Quality appears
to be a profitable
enterprise that is
becoming even
more successful.
Illustration 18-9
Vertical analysis of
Income statements
SO 4 Describe and apply vertical analysis.
Ratio Analysis
These results
reinforce the
earlier
observations that
Quality is
choosing to
finance its growth
through retention
of earnings rather
than through
issuing additional
debt.
Illustration 18-8
Vertical analysis of
balance sheets
SO 4 Describe and apply vertical analysis.
Ratio Analysis
SO 5 Identify and compute ratios used in analyzing
a firm’s liquidity, profitability, and solvency.
Ratio Analysis
Compute the Return on Common Stockholders’
Equity/Return on Equity ratio for 2007.
Shows how many dollars of net income the company earned for each
dollar invested by the owners.
$263,800 - $0
($795,000 + $1,003,000) / 2
= 29.3%
Net Income – Preferred Dividends
Average Common Stockholders’ Equity
Return on
Equity (ROE)
=
Profitability Ratios
Quality appears
to be a profitable
enterprise that is
becoming even
more successful.
Illustration 18-9
Vertical analysis of
Income statements
SO 4 Describe and apply vertical analysis.
Ratio Analysis
These results
reinforce the
earlier
observations that
Quality is
choosing to
finance its growth
through retention
of earnings rather
than through
issuing additional
debt.
Illustration 18-8
Vertical analysis of
balance sheets
SO 4 Describe and apply vertical analysis.
Ratio Analysis
SO 5 Identify and compute ratios used in analyzing
a firm’s liquidity, profitability, and solvency.
Ratio Analysis
Compute the Earnings Per Share for 2007.
A measure of the net income earned on each share of common stock.
$263,800
270,000 + 275,400 / 2
= $0.97 per share
Net Income
Weighted Average Common Shares
Outstanding
Earnings Per
Share
=
Profitability Ratios
Quality appears
to be a profitable
enterprise that is
becoming even
more successful.
Illustration 18-9
Vertical analysis of
Income statements
SO 4 Describe and apply vertical analysis.
Ratio Analysis
These results
reinforce the
earlier
observations that
Quality is
choosing to
finance its growth
through retention
of earnings rather
than through
issuing additional
debt.
Illustration 18-8
Vertical analysis of
balance sheets
SO 4 Describe and apply vertical analysis.
Ratio Analysis
SO 5 Identify and compute ratios used in analyzing
a firm’s liquidity, profitability, and solvency.
Ratio Analysis
Compute the Price Earnings Ratio for 2007.
The price-earnings (PE) ratio reflects investors’ assessments of a
company’s future earnings.
$12.00
$0.97
= 12.4 times
Market Price per Share of Stock
Earnings Per Share
Price Earnings
Ratio
=
Profitability Ratios
SO 5 Identify and compute ratios used in analyzing
a firm’s liquidity, profitability, and solvency.
Ratio Analysis
Compute the Payout Ratio for 2007.
Measures the percentage of earnings distributed in the form of cash
dividends.
$61,200
$263,800
= 23.2%
Cash Dividends
Net Income
Payout Ratio
=
Profitability Ratios
*
* From analysis of retained earnings.
SO 5 Identify and compute ratios used in analyzing
a firm’s liquidity, profitability, and solvency.
Ratio Analysis
Solvency Ratios
Solvency ratios measure the ability of a company to
survive over a long period of time.
 Debt to total assets and times interest earned
are two ratios that provide information about
debt-paying ability.
SO 5 Identify and compute ratios used in analyzing
a firm’s liquidity, profitability, and solvency.
Ratio Analysis
Compute the Debt to Total Assets Ratio for 2007.
Measures the percentage of the total assets that creditors provide.
$832,000
$1,835,000
= 45.3%
Total Debt
Total Assets
Debt to Total
Assets Ratio
=
Solvency Ratios
These results
reinforce the
earlier
observations that
Quality is
choosing to
finance its growth
through retention
of earnings rather
than through
issuing additional
debt.
Illustration 18-8
Vertical analysis of
balance sheets
SO 4 Describe and apply vertical analysis.
Ratio Analysis
Importance (or Advantages) of Ratio Analysis:
1. Helps to understand efficacy of decisions: The ratio analysis helps you to
understand whether the business firm has taken the right kind of operating,
investing and financing decisions. It indicates how far they have helped in
improving the performance.
2. Simplify complex figures and establish relationships: Ratios help in simplifying
the complex accounting figures and bring out their relationships. They help
summarise the financial information effectively and assess the managerial
efficiency, firm’s credit worthiness, earning capacity, etc.
3. Helpful in comparative analysis: The ratios are not be calculated for one year
only. When many year figures are kept side by side, they help a great deal in
exploring the trends visible in the business. The knowledge of trend helps in
making projections about the business which is a very useful feature.
4. Identification of problem areas: Ratios help business in identifying the
problem areas as well as the bright areas of the business. Problem areas
would need more attention and bright areas will need polishing to have still
better results.
5. Enables SWOT analysis: Ratios help a great deal in explaining the changes
occurring in the business. The information of change helps the management
a great deal in understanding the current threats and opportunities and
allows business to do its own SWOT (Strength-Weakness-Opportunity-
Threat) analysis.
6. Various comparisons: Ratios help comparisons with certain bench marks
to assess as to whether firm’s performance is better or otherwise.
• Limitations of Ratio Analysis:
1. Limitations of Accounting Data: Accounting data give an unwarranted impression of precision
and finality. In fact, accounting data “reflect a combination of recorded facts, accounting
conventions and personal judgements which affect them materially. For example, profit of the
business is not a precise and final figure. It is merely an opinion of the accountant based on
application of accounting policies. The soundness of the judgement necessarily depends on the
competence and integrity of those who make them and on their adherence to Generally
Accepted Accounting Principles and Conventions”. Thus, the financial statements may not
reveal the true state of affairs of the enterprises and so the ratios will also not give the true
picture.
2. Ignores Price-level Changes: The financial accounting is based on stable money measurement
principle. It implicitly assumes that price level changes are either non-existent or minimal. But
the truth is otherwise. We are normally living in inflationary economies where the power of
money declines constantly. A change in the price-level makes analysis of financial statement of
different accounting years meaningless because accounting records ignore changes in value of
money.
3. Variations in Accounting Practices: There are differing accounting policies
for valuation of inventory, calculation of depreciation, treatment of
intangibles Assets definition of certain financial variables etc., available for
various aspects of business transactions. These variations leave a big question
mark on the cross-sectional analysis. As there are variations in accounting
practices followed by different business enterprises, a valid comparison of
their financial statements is not possible.
4. Forecasting: Forecasting of future trends based only on historical analysis is
not feasible. Proper forecasting requires consideration of non-financial factors
as well.
5. Lack of ability to resolve problems: Their role is essentially indicative and of
whistle blowing and not providing a solution to the problem.
END

Chapter 02 - Financial Statement Analysis (LECTURE).pptx

  • 1.
  • 2.
    1. Discuss theneed for comparative analysis. 2. Identify the tools of financial statement analysis. 3. Explain and apply horizontal analysis. 4. Describe and apply vertical analysis. 5. Identify and compute ratios used in analyzing a firm’s liquidity, profitability, and solvency. 6. Understand the concept of earning power, and how irregular items are presented. 7. Understand the concept of quality of earnings. Study Objectives
  • 3.
    Balance sheet Income statement Retained earnings statement Basics of Financial Statement Analysis Horizontal and Vertical Analysis RatioAnalysis Earning Power and Irregular Items Quality of Earnings Need for comparative analysis Tools of analysis Liquidity Profitability Solvency Summary Discontinued operations Extraordinary items Changes in accounting principle Comprehensive income Alternative accounting methods Pro forma income Improper recognition Financial Statement Analysis
  • 4.
    Analyzing financial statementsinvolves: Basics of Financial Statement Analysis Characteristics Comparison Bases Tools of Analysis Liquidity Profitability Solvency Intracompany Industry averages Intercompany Horizontal Vertical Ratio SO 1 Discuss the need for comparative analysis. SO 2 Identify the tools of financial statement analysis.
  • 5.
    SO 3 Explainand apply horizontal analysis. Horizontal Analysis Horizontal analysis, also called trend analysis, is a technique for evaluating a series of financial statement data over a period of time. Its purpose is to determine the increase or decrease that has taken place. Horizontal analysis is commonly applied to the balance sheet, income statement, and statement of retained earnings.
  • 6.
    SO 3 Explainand apply horizontal analysis. These changes suggest that the company expanded its asset base during 2007 and financed this expansion primarily by retaining income rather than assuming additional long-term debt. Horizontal Analysis Illustration 18-5 Horizontal analysis of balance sheets
  • 7.
    SO 3 Explainand apply horizontal analysis. Overall, gross profit and net income were up substantially. Gross profit increased 17.1%, and net income, 26.5%. Quality’s profit trend appears favorable. Horizontal Analysis Illustration 18-6 Horizontal analysis of Income statements
  • 8.
    SO 3 Explainand apply horizontal analysis. We saw in the horizontal analysis of the balance sheet that ending retained earnings increased 38.6%. As indicated earlier, the company retained a significant portion of net income to finance additional plant facilities. Horizontal Analysis Illustration 18-7 Horizontal analysis of retained earnings statements
  • 9.
    SO 4 Describeand apply vertical analysis. Vertical Analysis Vertical analysis, also called common-size analysis, is a technique that expresses each financial statement item as a percent of a base amount. On an income statement, we might say that selling expenses are 16% of net sales. Vertical analysis is commonly applied to the balance sheet and the income statement.
  • 10.
    These results reinforce the earlier observationsthat Quality is choosing to finance its growth through retention of earnings rather than through issuing additional debt. Illustration 18-8 Vertical analysis of balance sheets SO 4 Describe and apply vertical analysis. Vertical Analysis
  • 11.
    Quality appears to bea profitable enterprise that is becoming even more successful. Illustration 18-9 Vertical analysis of Income statements SO 4 Describe and apply vertical analysis. Vertical Analysis
  • 12.
    Enables a comparisonof companies of different sizes. Illustration 18-10 Intercompany income statement comparison SO 4 Describe and apply vertical analysis. Vertical Analysis J.C. Penney earned net income more than 4,208 times larger than Quality’s, J.C. Penney’s net income as a percent of each sales dollar (5.6%) is only 4% of Quality’s (12.6%).
  • 13.
    SO 5 Identifyand compute ratios used in analyzing a firm’s liquidity, profitability, and solvency. Ratio Analysis Ratio analysis expresses the relationship among selected items of financial statement data. Liquidity Profitability Solvency Measures short- term ability of the company to pay its maturing obligations and to meet unexpected needs for cash. Financial Ratio Classifications Measures the income or operating success of a company for a given period of time. Measures the ability of the company to survive over a long period of time.
  • 14.
    SO 5 Identifyand compute ratios used in analyzing a firm’s liquidity, profitability, and solvency. Ratio Analysis The discussion of ratios will include the following types of comparisons. A single ratio by itself is not very meaningful.
  • 15.
    • Meaning: Aratio is a mathematical number calculated as a reference to relationship of two or more numbers and can be expressed as a fraction, proportion, percentage and a number of times. Ratios are essentially derived numbers and their efficacy depends a great deal upon the basic numbers from which they are calculated. Further, a ratio must be calculated using numbers which are meaningfully correlated.
  • 16.
    • Objectives ofRatio Analysis: 1. To know the areas of the business which need more attention; 2. To know about the potential areas which can be improved with the effort in the desired direction; 3. To provide a deeper analysis of the profitability, liquidity, solvency and efficiency levels in the business; 4. To provide information for making cross-sectional analysis by comparing the performance with the best industry standards; and 5. To provide information derived from financial statements useful for making projections and estimates for the future.
  • 17.
    SO 5 Identifyand compute ratios used in analyzing a firm’s liquidity, profitability, and solvency. Ratio Analysis Liquidity Ratios Measure the short-term ability of the company to pay its maturing obligations and to meet unexpected needs for cash.  Short-term creditors such as bankers and suppliers are particularly interested in assessing liquidity.  Ratios include the current ratio, the acid-test ratio, receivables turnover, and inventory turnover.
  • 18.
    SO 5 Identifyand compute ratios used in analyzing a firm’s liquidity, profitability, and solvency. Ratio Analysis Compute the Current Ratio for 2007. The ratio of 2.96:1 means that for every dollar of current liabilities, Quality has $2.96 of current assets. Current Assets Current Liabilities = Current Ratio $1,020,000 $344,500 = 2.96 : 1 Liquidity Ratios
  • 19.
    These results reinforce the earlier observationsthat Quality is choosing to finance its growth through retention of earnings rather than through issuing additional debt. Illustration 18-8 Vertical analysis of balance sheets SO 4 Describe and apply vertical analysis. Ratio Analysis
  • 20.
    SO 5 Identifyand compute ratios used in analyzing a firm’s liquidity, profitability, and solvency. Ratio Analysis Compute the Acid-Test Ratio for 2007. Liquidity Ratios Illustration 18-13
  • 21.
    SO 5 Identifyand compute ratios used in analyzing a firm’s liquidity, profitability, and solvency. Ratio Analysis Compute the Acid-Test Ratio for 2007. The acid-test ratio measures immediate liquidity. Cash + Short-Term Investments + Receivables (Net) Current Liabilities Acid-Test Ratio $100,000 + $20,000 + $230,000 $344,500 = 1.02 : 1 = Liquidity Ratios
  • 22.
    SO 5 Identifyand compute ratios used in analyzing a firm’s liquidity, profitability, and solvency. Ratio Analysis Compute the Receivables Turnover ratio for 2007. It measures the number of times, on average, the company collects receivables during the period. $2,097,000 ($180,000 + $230,000) / 2 = 10.2 times Net Credit Sales Average Net Receivables Receivables Turnover = Liquidity Ratios
  • 23.
    Quality appears to bea profitable enterprise that is becoming even more successful. Illustration 18-9 Vertical analysis of Income statements SO 4 Describe and apply vertical analysis. Ratio Analysis
  • 24.
    SO 5 Identifyand compute ratios used in analyzing a firm’s liquidity, profitability, and solvency. Ratio Analysis Compute the Acid-Test Ratio for 2007. Liquidity Ratios Illustration 18-13
  • 25.
    SO 5 Identifyand compute ratios used in analyzing a firm’s liquidity, profitability, and solvency. Ratio Analysis A variant of the receivables turnover ratio is to convert it to an average collection period in terms of days. This means that receivables are collected on average every 36 days. $2,097,000 ($180,000 + $230,000) / 2 = 10.2 times Liquidity Ratios 365 days / 10.2 times = every 35.78 days Receivables Turnover
  • 26.
    SO 5 Identifyand compute ratios used in analyzing a firm’s liquidity, profitability, and solvency. Ratio Analysis Compute the Inventory Turnover ratio for 2007. Inventory turnover measures the number of times, on average, the inventory is sold during the period. $1,281,000 ($500,000 + $620,000) / 2 = 2.31 times Cost of Good Sold Average Inventory Inventory Turnover = Liquidity Ratios
  • 27.
    Quality appears to bea profitable enterprise that is becoming even more successful. Illustration 18-9 Vertical analysis of Income statements SO 4 Describe and apply vertical analysis. Ratio Analysis
  • 28.
    SO 5 Identifyand compute ratios used in analyzing a firm’s liquidity, profitability, and solvency. Ratio Analysis Compute the Acid-Test Ratio for 2007. Liquidity Ratios Illustration 18-13
  • 29.
    SO 5 Identifyand compute ratios used in analyzing a firm’s liquidity, profitability, and solvency. Ratio Analysis A variant of inventory turnover is the days in inventory. Inventory turnover ratios vary considerably among industries. Liquidity Ratios 365 days / 2.3 times = every 159 days $1,281,000 ($500,000 + $620,000) / 2 = 2.3 times Inventory Turnover
  • 30.
    SO 5 Identifyand compute ratios used in analyzing a firm’s liquidity, profitability, and solvency. Ratio Analysis Profitability Ratios Measure the income or operating success of a company for a given period of time.  Income, or the lack of it, affects the company’s ability to obtain debt and equity financing, liquidity position, and the ability to grow.  Ratios include the profit margin, asset turnover, return on assets, return on common stockholders’ equity, earnings per share, price-earnings, and payout ratio.
  • 31.
    SO 5 Identifyand compute ratios used in analyzing a firm’s liquidity, profitability, and solvency. Ratio Analysis Compute the Profit Margin ratio for 2007. Measures the percentage of each dollar of sales that results in net income. $263,800 $2,097,000 = 12.6% Net Income Net Sales Profit Margin = Profitability Ratios
  • 32.
    Quality appears to bea profitable enterprise that is becoming even more successful. Illustration 18-9 Vertical analysis of Income statements SO 4 Describe and apply vertical analysis. Ratio Analysis
  • 33.
    SO 5 Identifyand compute ratios used in analyzing a firm’s liquidity, profitability, and solvency. Ratio Analysis Compute the Asset Turnover ratio for 2007. Measures how efficiently a company uses its assets to generate sales. $2,097,000 ($1,595,000 + $1,835,000) / 2 = 1.22 times Net Sales Average Assets Asset Turnover = Profitability Ratios
  • 34.
    Quality appears to bea profitable enterprise that is becoming even more successful. Illustration 18-9 Vertical analysis of Income statements SO 4 Describe and apply vertical analysis. Ratio Analysis
  • 35.
    These results reinforce the earlier observationsthat Quality is choosing to finance its growth through retention of earnings rather than through issuing additional debt. Illustration 18-8 Vertical analysis of balance sheets SO 4 Describe and apply vertical analysis. Ratio Analysis
  • 36.
    SO 5 Identifyand compute ratios used in analyzing a firm’s liquidity, profitability, and solvency. Ratio Analysis Compute the Return on Assets ratio for 2007. An overall measure of profitability. $263,800 ($1,595,000 + $1,835,000) / 2 = 15.4% Net Income Average Assets Return on Assets = Profitability Ratios
  • 37.
    Quality appears to bea profitable enterprise that is becoming even more successful. Illustration 18-9 Vertical analysis of Income statements SO 4 Describe and apply vertical analysis. Ratio Analysis
  • 38.
    These results reinforce the earlier observationsthat Quality is choosing to finance its growth through retention of earnings rather than through issuing additional debt. Illustration 18-8 Vertical analysis of balance sheets SO 4 Describe and apply vertical analysis. Ratio Analysis
  • 39.
    SO 5 Identifyand compute ratios used in analyzing a firm’s liquidity, profitability, and solvency. Ratio Analysis Compute the Return on Common Stockholders’ Equity/Return on Equity ratio for 2007. Shows how many dollars of net income the company earned for each dollar invested by the owners. $263,800 - $0 ($795,000 + $1,003,000) / 2 = 29.3% Net Income – Preferred Dividends Average Common Stockholders’ Equity Return on Equity (ROE) = Profitability Ratios
  • 40.
    Quality appears to bea profitable enterprise that is becoming even more successful. Illustration 18-9 Vertical analysis of Income statements SO 4 Describe and apply vertical analysis. Ratio Analysis
  • 41.
    These results reinforce the earlier observationsthat Quality is choosing to finance its growth through retention of earnings rather than through issuing additional debt. Illustration 18-8 Vertical analysis of balance sheets SO 4 Describe and apply vertical analysis. Ratio Analysis
  • 42.
    SO 5 Identifyand compute ratios used in analyzing a firm’s liquidity, profitability, and solvency. Ratio Analysis Compute the Earnings Per Share for 2007. A measure of the net income earned on each share of common stock. $263,800 270,000 + 275,400 / 2 = $0.97 per share Net Income Weighted Average Common Shares Outstanding Earnings Per Share = Profitability Ratios
  • 43.
    Quality appears to bea profitable enterprise that is becoming even more successful. Illustration 18-9 Vertical analysis of Income statements SO 4 Describe and apply vertical analysis. Ratio Analysis
  • 44.
    These results reinforce the earlier observationsthat Quality is choosing to finance its growth through retention of earnings rather than through issuing additional debt. Illustration 18-8 Vertical analysis of balance sheets SO 4 Describe and apply vertical analysis. Ratio Analysis
  • 45.
    SO 5 Identifyand compute ratios used in analyzing a firm’s liquidity, profitability, and solvency. Ratio Analysis Compute the Price Earnings Ratio for 2007. The price-earnings (PE) ratio reflects investors’ assessments of a company’s future earnings. $12.00 $0.97 = 12.4 times Market Price per Share of Stock Earnings Per Share Price Earnings Ratio = Profitability Ratios
  • 46.
    SO 5 Identifyand compute ratios used in analyzing a firm’s liquidity, profitability, and solvency. Ratio Analysis Compute the Payout Ratio for 2007. Measures the percentage of earnings distributed in the form of cash dividends. $61,200 $263,800 = 23.2% Cash Dividends Net Income Payout Ratio = Profitability Ratios * * From analysis of retained earnings.
  • 47.
    SO 5 Identifyand compute ratios used in analyzing a firm’s liquidity, profitability, and solvency. Ratio Analysis Solvency Ratios Solvency ratios measure the ability of a company to survive over a long period of time.  Debt to total assets and times interest earned are two ratios that provide information about debt-paying ability.
  • 48.
    SO 5 Identifyand compute ratios used in analyzing a firm’s liquidity, profitability, and solvency. Ratio Analysis Compute the Debt to Total Assets Ratio for 2007. Measures the percentage of the total assets that creditors provide. $832,000 $1,835,000 = 45.3% Total Debt Total Assets Debt to Total Assets Ratio = Solvency Ratios
  • 49.
    These results reinforce the earlier observationsthat Quality is choosing to finance its growth through retention of earnings rather than through issuing additional debt. Illustration 18-8 Vertical analysis of balance sheets SO 4 Describe and apply vertical analysis. Ratio Analysis
  • 50.
    Importance (or Advantages)of Ratio Analysis: 1. Helps to understand efficacy of decisions: The ratio analysis helps you to understand whether the business firm has taken the right kind of operating, investing and financing decisions. It indicates how far they have helped in improving the performance. 2. Simplify complex figures and establish relationships: Ratios help in simplifying the complex accounting figures and bring out their relationships. They help summarise the financial information effectively and assess the managerial efficiency, firm’s credit worthiness, earning capacity, etc. 3. Helpful in comparative analysis: The ratios are not be calculated for one year only. When many year figures are kept side by side, they help a great deal in exploring the trends visible in the business. The knowledge of trend helps in making projections about the business which is a very useful feature.
  • 51.
    4. Identification ofproblem areas: Ratios help business in identifying the problem areas as well as the bright areas of the business. Problem areas would need more attention and bright areas will need polishing to have still better results. 5. Enables SWOT analysis: Ratios help a great deal in explaining the changes occurring in the business. The information of change helps the management a great deal in understanding the current threats and opportunities and allows business to do its own SWOT (Strength-Weakness-Opportunity- Threat) analysis. 6. Various comparisons: Ratios help comparisons with certain bench marks to assess as to whether firm’s performance is better or otherwise.
  • 52.
    • Limitations ofRatio Analysis: 1. Limitations of Accounting Data: Accounting data give an unwarranted impression of precision and finality. In fact, accounting data “reflect a combination of recorded facts, accounting conventions and personal judgements which affect them materially. For example, profit of the business is not a precise and final figure. It is merely an opinion of the accountant based on application of accounting policies. The soundness of the judgement necessarily depends on the competence and integrity of those who make them and on their adherence to Generally Accepted Accounting Principles and Conventions”. Thus, the financial statements may not reveal the true state of affairs of the enterprises and so the ratios will also not give the true picture. 2. Ignores Price-level Changes: The financial accounting is based on stable money measurement principle. It implicitly assumes that price level changes are either non-existent or minimal. But the truth is otherwise. We are normally living in inflationary economies where the power of money declines constantly. A change in the price-level makes analysis of financial statement of different accounting years meaningless because accounting records ignore changes in value of money.
  • 53.
    3. Variations inAccounting Practices: There are differing accounting policies for valuation of inventory, calculation of depreciation, treatment of intangibles Assets definition of certain financial variables etc., available for various aspects of business transactions. These variations leave a big question mark on the cross-sectional analysis. As there are variations in accounting practices followed by different business enterprises, a valid comparison of their financial statements is not possible. 4. Forecasting: Forecasting of future trends based only on historical analysis is not feasible. Proper forecasting requires consideration of non-financial factors as well. 5. Lack of ability to resolve problems: Their role is essentially indicative and of whistle blowing and not providing a solution to the problem.
  • 54.

Editor's Notes

  • #2 1. On the topic, “Challenges Facing Financial Accounting,” what did the AICPA Special Committee on Financial Reporting suggest should be included in future financial statements? Non-financial Measurements (customer satisfaction indexes, backlog information, and reject rates on goods purchases). Forward-looking Information Soft Assets (a company’s know-how, market dominance, marketing setup, well-trained employees, and brand image). Timeliness (no real time financial information)
  • #3 Service Cost - Actuaries compute service cost as the present value of the new benefits earned by employees during the year. Future salary levels considered in calculation. Interest on Liability - Interest accrues each year on the PBO just as it does on any discounted debt. Actual Return on Plan Assets - Increase in pension funds from interest, dividends, and realized and unrealized changes in the fair market value of the plan assets. Amortization of Unrecognized Prior Service Cost - The cost of providing retroactive benefits is allocated to pension expense in the future, specifically to the remaining service-years of the affected employees. Gain or Loss - Volatility in pension expense can be caused by sudden and large changes in the market value of plan assets and by changes in the projected benefit obligation. Two items comprise the gain or loss: difference between the actual return and the expected return on plan assets and, amortization of the unrecognized net gain or loss from previous periods