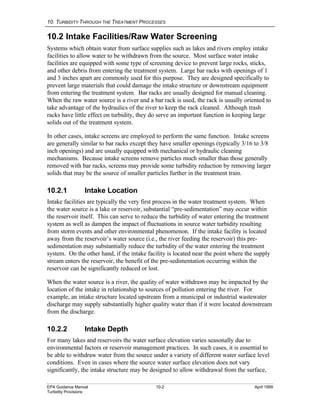
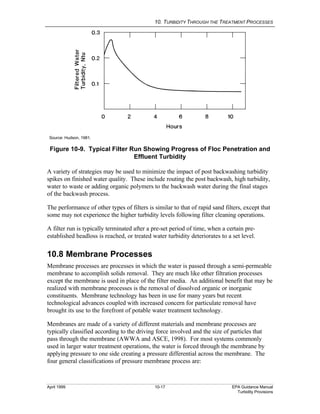
SlideShare a Scribd company logo
1 of 26
Download to read offline
April 1999 10-1 EPA Guidance Manual
Turbidity Provisions
10.TURBIDITY THROUGH THE
TREATMENT PROCESSES
10.1 Introduction
In the arena of public water supply, water treatment is provided to remove constituents
from raw water which may pose a risk to public health or are undesirable in finished water.
Turbidity is a characteristic related to the concentration of suspended solid particles in
water and has been adopted as an easy and reasonably accurate measure of overall water
quality. Turbidity can be used to measure the performance of individual treatment
processes as well as the performance of an overall water treatment system. Common
water treatment processes intended to remove suspended solids and reduce turbidity, or
aid in this removal and reduction process, include:
i Raw water screening;
i Pre-sedimentation;
i Coagulation;
i Flocculation;
i Sedimentation; and
i Filtration.
This chapter provides a general description of each of these processes and information on
the level of turbidity reduction that is commonly achieved through each. A typical water
treatment system is shown schematically in Figure 10-1.
FILTRATION
TREATED WATER
STORAGE
FLOCCULATION
R
AW
W
ATER
SO
U
R
C
E
PRE-SEDIMENTATION
RAW WATER
INTAKE COAGULATION
SEDIMENTATION
FILTER
BACKWASH
SEDIMENTATION BASIN
UNDERFLOW
DISTRIBUTION
Figure 4-1. A Typical Water Treatment System
PUMPING
Figure 10-1. A Typical Conventional Water Treatment System
10. TURBIDITY THROUGH THE TREATMENT PROCESSES
EPA Guidance Manual 10-2 April 1999
Turbidity Provisions
10.2 Intake Facilities/Raw Water Screening
Systems which obtain water from surface supplies such as lakes and rivers employ intake
facilities to allow water to be withdrawn from the source. Most surface water intake
facilities are equipped with some type of screening device to prevent large rocks, sticks,
and other debris from entering the treatment system. Large bar racks with openings of 1
and 3 inches apart are commonly used for this purpose. They are designed specifically to
prevent large materials that could damage the intake structure or downstream equipment
from entering the treatment system. Bar racks are usually designed for manual cleaning.
When the raw water source is a river and a bar rack is used, the rack is usually oriented to
take advantage of the hydraulics of the river to keep the rack cleaned. Although trash
racks have little effect on turbidity, they do serve an important function in keeping large
solids out of the treatment system.
In other cases, intake screens are employed to perform the same function. Intake screens
are generally similar to bar racks except they have smaller openings (typically 3/16 to 3/8
inch openings) and are usually equipped with mechanical or hydraulic cleaning
mechanisms. Because intake screens remove particles much smaller than those generally
removed with bar racks, screens may provide some turbidity reduction by removing larger
solids that may be the source of smaller particles further in the treatment train.
10.2.1 Intake Location
Intake facilities are typically the very first process in the water treatment system. When
the water source is a lake or reservoir, substantial “pre-sedimentation” may occur within
the reservoir itself. This can serve to reduce the turbidity of water entering the treatment
system as well as dampen the impact of fluctuations in source water turbidity resulting
from storm events and other environmental phenomenon. If the intake facility is located
away from the reservoir’s water source (i.e., the river feeding the reservoir) this pre-
sedimentation may substantially reduce the turbidity of the water entering the treatment
system. On the other hand, if the intake facility is located near the point where the supply
stream enters the reservoir, the benefit of the pre-sedimentation occurring within the
reservoir can be significantly reduced or lost.
When the water source is a river, the quality of water withdrawn may be impacted by the
location of the intake in relationship to sources of pollution entering the river. For
example, an intake structure located upstream from a municipal or industrial wastewater
discharge may supply substantially higher quality water than if it were located downstream
from the discharge.
10.2.2 Intake Depth
For many lakes and reservoirs the water surface elevation varies seasonally due to
environmental factors or reservoir management practices. In such cases, it is essential to
be able to withdraw water from the source under a variety of different water surface level
conditions. Even in cases where the source water surface elevation does not vary
significantly, the intake structure may be designed to allow withdrawal from the surface,
10. TURBIDITY THROUGH THE TREATMENT PROCESSES
April 1999 10-3 EPA Guidance Manual
Turbidity Provisions
or from different levels beneath the surface. This capability can have a significant impact
on the quality of water entering the treatment system. Many times stratification within a
lake or reservoir exists continually or occurs on a seasonal basis. In these cases, the
quality of water may vary significantly from near the surface to tens or hundreds of feet
below the surface. For example, if algae growth is a problem, water withdrawn from
several feet beneath the surface may have substantially lower turbidity than water
withdrawn from the surface, as algae needs sunlight to survive and is typically found near
the water surface.
10.2.3 Effect on Turbidity
Intake screens are not intended to reduce the turbidity of the water entering the treatment
system. The solids removed by intake screens are large enough that they typically do not
directly impact turbidity, though subsequent deterioration and break-up of these solids
could contribute to increased levels of turbidity later in the treatment process. The
physical location of the intake structure and the flexibility it provides for varying the depth
from which source water is withdrawn can significantly influence the turbidity of the water
entering the treatment system.
10.3 Pre-sedimentation
Pre-sedimentation is commonly used for water supplies where raw water turbidity is
continually high, is high on a seasonal basis, or is high sporadically due to storms or other
environmental events within the watershed. Pre-sedimentation may also be used in
situations where substantial amounts of sand and gravel may be present in the source
water. Depending on the purpose of the pre-sedimentation process, the pre-sedimentation
basins may be relatively large settling ponds or small concrete basins. When ponds are
utilized, they are generally designed to remove large quantities of silt from the raw water
and typically provide hydraulic detention times ranging from a few hours to a few days.
Smaller concrete basins that provide less than 20 minutes detention time are sometimes
used to provide grit removal. The larger settling ponds are generally not equipped with
mechanical sludge removal facilities and must be periodically cleaned by dredging or other
means. The concrete pre-sedimentation basins may be equipped with mechanical
equipment to remove solids from the basin bottom, or they may be designed to promote
manual cleaning using a fire hose or other equipment.
When pre-sedimentation is intended to remove silt and other fine suspended solids,
chemical addition is often used to enhance process performance. Organic polymers are
the chemicals most commonly added prior to pre-sedimentation to enhance solids removal,
but alum and ferric chloride are also sometimes used. The chemicals are added to the raw
water as it enters the pre-sedimentation basin to promote solid separation.
10.3.1 Effect on Turbidity
Pre-sedimentation facility performance depends largely on facility design. Factors such as
the ability to provide low velocity plug flow through the pre-sedimentation facility and the
capability to add chemicals are critical to achieving optimal system performance. The
10. TURBIDITY THROUGH THE TREATMENT PROCESSES
EPA Guidance Manual 10-4 April 1999
Turbidity Provisions
characteristics of the suspended solids in the raw water also play a key role in facility
performance. In cases where well-designed pre-sedimentation facilities are available and
adequate hydraulic detention times are provided (generally greater than 12 hours),
significant turbidity reduction can be achieved through the pre-sedimentation process.
In cases where pre-sedimentation is used primarily to remove grit from the raw water
before it enters subsequent treatment processes, detention times are generally limited to 10
to 20 minutes and very little turbidity reduction is achieved.
10.4 Coagulation
Coagulation is the process of conditioning suspended solids particles to promote their
agglomeration and produce larger particles that can be more readily removed in
subsequent treatment processes. In many cases, dissolved organic substances are
adsorbed on the surface of suspended solids particles and effective coagulation can be an
effective step in their removal as well (AWWA and ASCE, 1990). The particles
suspended in raw water typically vary widely in size. Typical sizes for different types of
particles commonly found in water supplies can be seen in Figure 8-1.
Colloidal size particles typically carry an electrical charge (AWWA and ASCE, 1990).
When the suspended particles are similarly charged, the resulting repulsive forces between
particles tend to “stabilize” the suspension and prevent particle agglomeration. The
process of coagulation is complex and may involve several different mechanisms to
achieve “destabilization”, which allows particle agglomeration and enhances subsequent
removal.
Coagulation is typically accomplished through chemical addition and mixing. Following
coagulation, the processes of flocculation, sedimentation, and filtration are used to remove
the “destabilized” particles from suspension.
10.4.1 Chemicals
Chemicals commonly used in the coagulation process include aluminum or iron salts and
organic polymers. The most common aluminum salt used for coagulation is aluminum
sulfate, or alum. Alum may react in different ways to achieve coagulation. When used at
relatively low doses (<5 mg/l), charge neutralization (destabilization) is believed to be the
primary mechanism involved. At higher dosages, the primary coagulation mechanism is
entrapment. In this case, aluminum hydroxide (Al(OH)2) precipitates forming a “sweep-
floc” which tends to capture suspended solids as it settles out of suspension.
Solution pH plays an important role when alum is used for coagulation since the solubility
of the aluminum species in water is pH dependent. If the pH value of a mixed solution is
between 4 and 5, alum is generally present in the form of positive ions (i.e., Al(OH)2+
,
Al8(OH)4+
, and Al3+
). However, optimum sweep and sweep coagulation occur when
negatively-charged forms of alum predominate, which occurs when the pH is between 6
and 8. Figure 10-2 depicts the solubility of some of these aluminum species present during
a typical coagulation process. Figure 10-2 depicts some of the aluminum species involved
10. TURBIDITY THROUGH THE TREATMENT PROCESSES
April 1999 10-5 EPA Guidance Manual
Turbidity Provisions
in alum coagulation and the conditions of aluminum concentration and pH under which
they occur (AWWA and ASCE, 1990).
When alum is used and charge neutralization is the primary coagulation mechanism,
effective flash mixing is critical to the success of the process. When the primary
mechanism is entrapment, effective flash mixing is less critical, and flocculation is the more
important process.
Source: AWWA and ASCE, 1990.
Figure 10-2. The Alum Coagulation Diagram and Its Relationship to
Zeta Potential
Ferric Chloride (FeCl3) is the most common iron salt used to achieve coagulation. Its
reactions in the coagulation process are similar to those of alum, but the relative solubility
and pH ranges differ significantly from those of alum.
Both alum and ferric chloride can be used to generate inorganic polymeric coagulants that
have been used for coagulation. These coagulants are typically generated by partially
IEP (IOSOELECTRIC POINT)
-4
-5
-6
+
0
-
LOG(Al)(mol/L)ZETAPOTENTIAL
pH OF MIXED SOLUTION
2 4 6 8 10 12
CHARGE NEUTRALIZATION
CORONA TO ZERO ZETA
POTENTIAL WITH
Al(OH) (s)3
Al(OH)4
-
COLLOID COATED
WITH ( Al(OH) (s) )3
n +
3Al(OH) (s)
IEP (IOSOELECTRIC PAINT)
UNCOATED
COLLOID
2
Al(OH) +
+
Al (OH)4
208
+
Al 3
AlTOTAL
ED
0.3
1
3
100
30
10
B
C
A
CHARGE NEUTRALIZATION
TO ZERO ZETA
POTENTIAL WITH
Al (OH) /Al(OH) (s)X
RESTABILIZATION ZONE
SWEEP COAGULATION
Y
n+
3
OPTIMUM SWEEP
IEP
ALUMASAl(SO)x14.3HO-mg/l2432
IEP (ISOELECTRIC POINT)
10. TURBIDITY THROUGH THE TREATMENT PROCESSES
EPA Guidance Manual 10-6 April 1999
Turbidity Provisions
neutralizing concentrated solutions of alum or ferric chloride with a base such as sodium
hydroxide prior to their use in the coagulation process (AWWA and ASCE, 1990). The
resulting inorganic polymers may have some advantages over alum or ferric chloride in
cold waters or in low alkalinity waters.
Organic polymers tend to be large molecules composed of chains of smaller “monomer”
groups (AWWA and ASCE, 1990). Because of their large size and charge characteristics,
polymers can promote destabilization through bridging, charge neutralization, or both.
Polymers are often used in conjunction with other coagulants such as alum or ferric
chloride to optimize solids removal.
10.4.2 Rapid Mixing
Mixing is utilized as part of the coagulation process to distribute the coagulant chemicals
throughout the water stream. When alum or ferric chloride are used to achieve
destabilization through charge neutralization, it is extremely important that the coagulant
chemical be distributed quickly and efficiently because it is the intermediate products of
the coagulant reaction that are the destabilizing agents. The life of these intermediate
species is short and they must contact the solids particles in the water if destabilization is
to be achieved. When other mechanisms are predominant in the coagulation process, or
when organic polymers are being used as the coagulant chemical, immediate distribution
of the coagulant chemical is not as critical and less intense mixing may be acceptable, or
even desirable. In some cases, excessive mixing may serve to break-up coagulant
molecules or floc particles, thereby reducing the effectiveness of subsequent solids
removal processes.
Mixing intensity is typically quantified with a number known as the “velocity gradient” or
“G value”. The G value is a function of the power input into the mixing process and the
volume of the reaction basin. Typical G values for coagulation mixing range from 300 to
8000 sec–1
(Hudson, 1981).
The time required to achieve efficient coagulation varies, depending on the coagulation
mechanism involved. When charge neutralization is the mechanism involved, the
detention time required may be one second or less. When sweep floc or entrapment is the
mechanism involved, longer detention times on the order of 1 to 30 seconds may be
appropriate (Kawumara, 1991; AWWA and ASCE, 1998; Hudson, 1981).
10.4.3 Effect on Turbidity
Coagulation by itself does not achieve turbidity reduction, in fact turbidity may increase
during the coagulation process due to the additional insoluble compounds generated
through chemical addition. The subsequent processes of flocculation, sedimentation, and
filtration are used in conjunction with coagulation to achieve suspended solids and
turbidity reduction.
10. TURBIDITY THROUGH THE TREATMENT PROCESSES
April 1999 10-7 EPA Guidance Manual
Turbidity Provisions
10.5 Flocculation
Flocculation is the physical process of agglomerating small particles into larger ones that
can be more easily removed from suspension. Flocculation is almost always used in
conjunction with, and preceded by coagulation. During the coagulation process the
repulsive forces between solids particles are reduced or eliminated. Flocculation is the
process of bringing the destabilized particles into contact with one another to form larger
“floc” particles. These larger particles are more readily removed from the water in
subsequent processes.
Flocculation is generally accomplished by mixing the destabilized suspension to provide
the opportunity for the particles to come into contact with one another and stick together.
10.5.1 Slow Mixing
Mixing is a key aspect of the flocculation process. Often the intensity of mixing is reduced
as the water proceeds through the flocculation process to achieve optimum performance.
At the beginning of the process, the mixing is fairly intense to maximize the particle
contact opportunities. Mixing intensity values (G values) in this area are typically in the
range of 60 to 70 sec-1
(Kawamura, 1996).
Toward the end of the flocculation process, mixing intensity is generally reduced to
minimize the potential for breaking up the floc particles that have begun to form. In this
portion of the process, G values are commonly in the 10 to 30 sec-1
range (Kawamura,
1996). Many times mixing intensity is tapered through several different stages of the
flocculation process to optimize process effectiveness.
A wide variety of flocculation mixing mechanisms have been used in water treatment.
These include vertical shaft mechanical mixers, horizontal shaft mechanical mixers, and
hydraulic mixing systems.
10.5.2 Detention Time
The amount of time the water spends in the flocculation process is a key performance
parameter. Adequate time must be provided to allow generation of particles sufficiently
large to allow their efficient removal in subsequent treatment processes. The optimum
particle size may vary significantly depending on the downstream treatment processes
utilized. For example, when sedimentation is used, large floc particles are typically
desirable because they tend to settle out of suspension readily. If filtration directly follows
the flocculation process, smaller floc particles may be the most desirable since they tend to
be stronger and less susceptible to break-up by the shear forces encountered within the
filters. Overall detention time in the flocculation process typically ranges from 10 to 30
minutes and is generally provided in several different basins or basin segments. This
allows the mixing intensity to be varied through the process.
10. TURBIDITY THROUGH THE TREATMENT PROCESSES
EPA Guidance Manual 10-8 April 1999
Turbidity Provisions
10.5.3 Effect on Turbidity
As with coagulation, the purpose of the flocculation process is not to directly reduce
turbidity or suspended solids levels, but rather to prepare the solids for subsequent
removal. The reduction in number of suspended solids particles in suspension is typically
achieved in the flocculation process as the smaller particles are combined to form larger
ones. This process may, or may not result in a reduction in turbidity.
10.6 Sedimentation/Clarification
Sedimentation is the process by which solids are removed from the water by means of
gravity separation. In the sedimentation process, the water passes through a basin in
which relatively quiescent conditions prevail. Under these conditions, the floc particles
formed during flocculation settle to the bottom of the basin while the “clear” water passes
out of the basin over an effluent baffle or weir. As shown in Figure 10-3, the solids
collect on the basin bottom and are removed, typically by a mechanical “sludge collection”
device. The sludge collection device scrapes the solids (sludge) to a collection point
within the basin from which it is pumped directly to disposal or to a sludge treatment
process.
Conventional sedimentation typically involves one or more basins. These “clarifiers” are
relatively large open tanks, either circular or rectangular in shape. In properly designed
clarifiers, velocity currents are reduced to the point where gravity is the predominant force
acting on the water/solids suspension. Under this condition, the difference in specific
gravity between the water and the solids particles causes the solids particles to settle to the
bottom of the basin.
High rate sedimentation is similar to conventional sedimentation except that the
sedimentation basin has been modified through the addition of some mechanical or other
device to aid in the settling process. These mechanical devices typically consist of plates
or tubes intended to reduce the distance the solids particles must settle through the water
before they reach the bottom of the basin and can be removed. Figure 10-4 illustrates a
plate settler used for high rate sedimentation.
Another high rate clarification process employs an “adsorption clarifier” and is designed to
provide flocculation and clarifications within a single process. These clarifiers consist of a
basin filled with adsorption media, generally small particles of either plastic or rock, about
the size of pea gravel. As the water passes through the media, hydraulic mixing promotes
flocculation and the flocculated particles adhere to the surface of the media particles. The
media is cleaned periodically using an air or air and water backwash process to remove the
solids.
Solids Contact clarifiers represent an entirely different approach to high rate clarification.
They consist of a basin similar to that used for a conventional clarifier but with a sludge
recycle system to promote development of a dense sludge blanket as depicted in Figure
10-5.
10. TURBIDITY THROUGH THE TREATMENT PROCESSES
April 1999 10-9 EPA Guidance Manual
Turbidity Provisions
Source: AWWA and ASCE, 1990.
Figure 10-3. Circular Radial-flow Clarifier
10. TURBIDITY THROUGH THE TREATMENT PROCESSES
EPA Guidance Manual 10-10 April 1999
Turbidity Provisions
Source: AWWA and ASCE, 1998.
Figure 10-4. Plate Settlers Used for High Rate Sedimentation
Source: AWWA and ASCE, 1998.
Figure 10-5. Accelerator Solids Contact Unit
INLET ORIFICE
10. TURBIDITY THROUGH THE TREATMENT PROCESSES
April 1999 10-11 EPA Guidance Manual
Turbidity Provisions
As the water enters the bottom of the basin and passes upward through the sludge blanket,
the flocculated solids in the blanket tend to contact and capture or adsorb the solids from
the water.
10.6.1 Effect on Turbidity
Suspended solids removal and turbidity reduction rates achieved through sedimentation
may range from about 50 to 90 percent, depending on the nature of the solids, the level of
pretreatment provided, and the design of the clarifiers. Common values are in the 60 to 80
percent range (Hudson, 1981). A primary function of the sedimentation or clarification
process is to reduce the load of solids going to the filters. Optimization of the clarification
process will minimize the solids loading on the filters and contribute to enhanced filter
performance and better overall treated water quality.
10.7 Filtration
Like clarification, filtration is a process in which solids are removed from water and
substantial turbidity removal is achieved. Optimization used prior to the filtration process
will control loading rates while allowing the system to achieve maximum filtration rates. In
fact, filtration is the final step to achieve turbidity reduction in most water treatment
operations. The water leaving the filtration process should be well within turbidity limits.
In the filtration process, the water passes through a bed of granular filter media or other
filtering material and solids are physically retained on the media. After passing through
the filter media, the “filtered” water is collected and removed from the filter. The solids
retained on the media are also periodically collected and removed. As with the
sedimentation process, the performance of most filters depends largely on the preparatory
treatment processes of coagulation and flocculation. Without effective use of these
processes, only marginal filter performance can be expected.
Filters are classified according to the type of media used and the operational conditions
employed. The primary types of filters used in domestic water treatment include:
i Rapid Sand Filters;
i Pressure Filters;
i Slow Sand Filters; and
i Precoat Filters.
10.7.1 Conventional Rapid Sand Filters
Rapid sand filters are the most commonly used type of filters in water treatment systems
today. They get their name from the type of media employed (sand) and from the rate at
which they are hydraulically loaded. A sectional drawing of a typical rapid sand filter is
shown in Figure 10-6.
10. TURBIDITY THROUGH THE TREATMENT PROCESSES
EPA Guidance Manual 10-12 April 1999
Turbidity Provisions
Source: AWWA and ASCE, 1998.
Figure 10-6. Typical Rapid Sand Filter
Water enters the filter unit above the media and flows by gravity downward through the
filter media to the underdrain or collection system, where it is removed from the filter.
When the filter media becomes clogged with solids it is cleaned through a “backwash”
process. In the backwash process water, and in some instances, air is introduced to the
filter at a relatively high rate through the underdrain system. The water and air flow
upward through the media, expanding the media bed and creating a scrubbing or scouring
action which removes solids accumulated on the media surface and in inter-particle sites
within the media bed. After passing through the media bed, the backwash water and the
solids it contains are removed from the filter with a series of collection troughs.
Media
A variety of different types of media are used in rapid sand filters. As the name implies,
the primary media is sand. In some cases all of the sand is the same size, but more
commonly the media consists of particles of varying composition, size, and density. Filters
with more than one type and size of media are referred to as dual media, mixed media, or
multi-media filters, depending on the media provided. As the backwashing process in
these filters concludes and the media particles settle back into position in the filter bed, the
particles become stratified due to their differing sizes and densities. The largest and least
dense media particles accumulate near the top of the media bed and the smallest and most
dense particles migrate to the bottom. With this media stratification, when the filter is
placed back into service and the water passes down through the bed of media, it first
encounters large particles and then finer and finer sand until it reaches the underdrain
10. TURBIDITY THROUGH THE TREATMENT PROCESSES
April 1999 10-13 EPA Guidance Manual
Turbidity Provisions
system. This stratification tends to minimize the “blinding” effect that occurs when solid
particles accumulate at the very top of the media bed. It also provides a much greater
volume for solids storage within the filter bed, which allows longer filter runs between
backwash operations.
The top, or coarsest layer of media is often composed of anthracite coal rather than sand.
The relatively light coal remains at the top of the filter bed after filter cleaning
(backwashing), even though its particle sizes are relatively large. Conversely, high density
garnet sand is used for the smallest layer of filter media. The high density of this material
causes it to settle quickly to the bottom of the filter bed following backwash operations,
even though its particles are relatively small.
Hydraulics
Filter performance is affected significantly by its hydraulic characteristics. Typical rapid
sand filter loading rates range from 2 to 8 gallons per minute per square foot of filter bed
surface area. As the filter bed becomes dirty and clogged with solids, the resistance to
flow increases. Ultimately flow will cease when the resistance to flow is greater that the
gravitational force compelling it. As the “head” required to push water through the filter
increases, the rate of flow tends to decrease and solids particles are pushed further and
further into the bed of media. Ultimately, if sufficient head is available, solids will be
driven completely through the bed and appear in the filtered water, a condition known as
“breakthrough”. The filter run should be terminated and backwash initiated before
breakthrough occurs.
Controls
Typical filter control parameters include:
i Filter loading rate;
i Filter run length;
i Headloss;
i Filtered water turbidity;
i Backwash rate; and
i Backwash duration.
Control of these parameters gives the operator a great deal of influence in determining the
performance of a filter. Often, however, there are conflicting objectives associated with
filter operation. For example, the goal of maximizing water production may conflict with
the objective of minimizing treated water turbidity. The operator must use good
judgement in establishing operational goals and exercising process control to achieve
optimal finished water quality and production.
10. TURBIDITY THROUGH THE TREATMENT PROCESSES
EPA Guidance Manual 10-14 April 1999
Turbidity Provisions
10.7.2 Slow Sand Filters
Slow sand filters have been used for nearly two centuries and have been proven to an
effective “low-tech” method of treating some waters (AWWA and ASCE, 1990). A slow
sand filter consists of a bed of uniform, relatively fine grain sand underlain by an
underdrain system as depicted in Figure 10-7.
Source: AWWA and ASCE, 1998.
Figure 10-7. Typical Covered Slow Sand Filter Installation
Water is introduced at the top of the bed and under the influence of gravity it passes
downward through the bed to the underdrain system. Slow sand filters are loaded at much
lower rates than rapid sand filters, with typical hydraulic loading rates ranging from 0.04
to 0.1 gallons per minute per square foot of filter bed area (AWWA and ASCE, 1998).
Since the sand used in slow sand filters is relatively uniform in size and fine grained, most
of the solids removal and turbidity reduction occurs at the very top of the sand bed. As
operation of the filter continues, a layer of dirt and micro-organisms builds up at the
surface of the bed. This layer is known as the “schmutzdecke” and contributes to the
effectiveness of the filter in removing suspended solids and reducing turbidity. After a
period of operation the headloss through the filter becomes excessive and the filter must
be cleaned. Cleaning is accomplished by letting the water level drop below the top of the
filter media and then physically removing the schmutzdecke along with the top 0.8 to 1.2
inches of sand. Typical slow sand filter runs between cleaning are one to six months
(Kawamura, 1996).
Generally slow sand filters are not proceeded by coagulation or flocculation processes,
making them one of the simplest water filtration processes available. However, relatively
large land areas are required and, with their simplicity comes little operational flexibility.
The only basic operational controls available to the slow sand filter operator are hydraulic
loading and frequency of cleaning.
AND BACKWASHING
10. TURBIDITY THROUGH THE TREATMENT PROCESSES
April 1999 10-15 EPA Guidance Manual
Turbidity Provisions
Slow sand filters can be very effective in removing suspended solids and reducing
turbidity, depending on the nature of the solids particles involved, however, they have
been found to be limited in their capability to remove clay particles and color (AWWA and
ASCE, 1990).
10.7.3 Pressure Filters
Pressure filters are essentially a variation of the conventional rapid sand filter. They
employ the same types of media and function in much the same way. The primary
difference is that pressure filters are contained within a pressurized vessel, usually made of
steel, and pressure is used to push the water through the filter bed rather than gravity as
depicted in Figure 10-8.
Since pressure filters function much like conventional rapid sand filters, their capability to
remove suspended solids and reduce turbidity is similar.
The primary advantage of pressure filters is that they do not require the vertical space for
several feet of water above the filter bed and the water leaves the filter under pressure,
thus eliminating the potential for air binding associated with conventional rapid sand
filters. Disadvantages include the lack of access for visual observation of the filter bed and
the possibly greater potential to experience turbidity “breakthrough” due to the higher
pressure of force driving the filtration process.
Source: AWWA and ASCE, 1990.
Figure 10-8. Cross Section of a Typical Pressure Filter
BAFFLE PLATE
FILTERING SURFACE
SAND
GRAVEL
CONCRETE FILL
MANIFOLD AND
LATERALS
INFLUENT
EFFLUENT
SAMPLE
FAUCET
10. TURBIDITY THROUGH THE TREATMENT PROCESSES
EPA Guidance Manual 10-16 April 1999
Turbidity Provisions
10.7.4 Precoat/Diatomaceous Earth Filters
Precoat filters represent an entirely different kind of filtration mechanism. Instead of using
sand or other granular material as the filtration medium, precoat filters use a thin layer of
“diatomaceous earth” or similar material to form a thin layer of filter media over a
supporting fabric or “septum”, which in turn is supported by a rigid filter support
structure. The filter coat material is applied in a slurry before the filtration cycle begins.
When water passes through the filter under pressure, usually supplied by a pump but
sometimes by gravity, the solids in the water are captured on the surface of the filter
media. As the filtration process proceeds, additional filter media is added to the water
going to the filter. This supplemental media or “body feed”, like the suspended solids in
the water, accumulates on the surface of the filter coat, increasing the depth of the media
and preventing the surface blinding effect that would otherwise occur. When the pressure
loss through the filter becomes excessive, filtration is discontinued and the filter media
coat is washed off through a backwash process, a new pre-coat is applied, and the
filtration process begins again.
Precoat filters have the capability to remove particles down to about one micron in size.
Hydraulic loading rates are typically in the range of 0.5 to 2 gallons per minute per square
foot of coated filter surface (ASCE, 1990). Advantages include relatively low capital
cost and no need for the preliminary processes of coagulation and flocculation.
Disadvantages include the inability to handle high turbidity water, the potential for particle
pass-through if the precoat process is not effective or cracking occurs during filter
operation, and the relatively poor capability to remove color and taste and odor causing
compounds.
10.7.5 Effect on Turbidity
Conventional and direct filtration processes have the capability of producing water with
turbidity below the proposed SDWA turbidity of 0.3 NTU and even below the 0.1 NTU
Partnership for Safe Water finished water optimization goal if properly operated and
maintained.
Filter performance depends largely on the characteristics of the solids particles entering
the filter and on the characteristics of the filter itself. Generally treated water turbidity will
be relatively high for a short period immediately following the backwash cycle of rapid
sand filter operation, commonly known as post backwash turbidity spiking, but will then
improve rapidly to a level near the highest quality level the filter can produce. The filter
will then operate at or near this level for an extended period. Figure 10-9 shows typical
filtered water turbidity as a function of filter run time.
10. TURBIDITY THROUGH THE TREATMENT PROCESSES
April 1999 10-17 EPA Guidance Manual
Turbidity Provisions
Source: Hudson, 1981.
Figure 10-9. Typical Filter Run Showing Progress of Floc Penetration and
Effluent Turbidity
A variety of strategies may be used to minimize the impact of post backwashing turbidity
spikes on finished water quality. These include routing the post backwash, high turbidity,
water to waste or adding organic polymers to the backwash water during the final stages
of the backwash process.
The performance of other types of filters is similar to that of rapid sand filters, except that
some may not experience the higher turbidity levels following filter cleaning operations.
A filter run is typically terminated after a pre-set period of time, when a certain pre-
established headloss is reached, or treated water turbidity deteriorates to a set level.
10.8 Membrane Processes
Membrane processes are processes in which the water is passed through a semi-permeable
membrane to accomplish solids removal. They are much like other filtration processes
except the membrane is used in place of the filter media. An additional benefit that may be
realized with membrane processes is the removal of dissolved organic or inorganic
constituents. Membrane technology has been in use for many years but recent
technological advances coupled with increased concern for particulate removal have
brought its use to the forefront of potable water treatment technology.
Membranes are made of a variety of different materials and membrane processes are
typically classified according to the driving force involved and the size of particles that
pass through the membrane (AWWA and ASCE, 1998). For most systems commonly
used in larger water treatment operations, the water is forced through the membrane by
applying pressure to one side creating a pressure differential across the membrane. The
four general classifications of pressure membrane process are:
10. TURBIDITY THROUGH THE TREATMENT PROCESSES
EPA Guidance Manual 10-18 April 1999
Turbidity Provisions
i Microfiltration;
i Ultrafiltration;
i Nanofiltration; and
i Reverse Osmosis.
Figure 10-10 shows the size of particles generally removed by these different membrane
processes.
Micron
Scale
Approx
MW
Typical Size
Range of Bacteria
Selected
Water
Constituents
Membrane
Process*
Nanofiltration
* Media Filtration (not a Membrane Process is shown for reference only)
10 100 1000
Salts
Viruses
Colloids
SandDissolved Organics
0.001 0.01 0.1 1
Cryptosporidium
Reverse Osmosis
Ultrafiltration
Microfiltration
Media Filtration
Source: AWWA and ASCE, 1998.
Figure 10-10. Pressure-Driven Membrane Process Application Guide
Table 10-1 provides information on the typical pressure operating ranges for the different
types of pressure-driven membrane processes. Most pressure driven membrane processes
utilize either cellulose acetate or synthetic organic polymer membranes (AWWA and
ASCE, 1998). Standard pressure membrane configurations include spiral wound
membrane units and hollow fiber membrane units. Figures 10-11, 10-12, and 10-13 show
the standard membrane configurations commonly used for potable water treatment
systems.
Table 10-1. Typical Feed Pressures for Pressure Driven Membrane
Processes
Membrane Process Typical Feed Pressure (psi)
Reverse Osmosis - Brackish Water Application
Low Pressure 125 to 300
Standard Pressure 350 to 600
Reverse Osmosis - Seawater Application 800 to 1,200
Nanofiltration 50 to 150
Ultrafiltration 20 to 75
Microfiltration 15 to 30
Source: AWWA and ASCE, 1998.
10. TURBIDITY THROUGH THE TREATMENT PROCESSES
April 1999 10-19 EPA Guidance Manual
Turbidity Provisions
Source: AWWA and ASCE,1998.
Figure 10-11. Typical Spiral-Wound Reverse Osmosis Membrane
Module Driven
Source: AWWA and ASCE, 1998.
Figure 10-12. Typical Hollow Fine-Fiber Reverse Osmosis Membrane
Module
MEMBRANE
ELEMENT
MODULE MODULE
ELEMENT
MEMBRANE
MODULE
ELEMENT
MEMBRANE
PRESSURE VESSEL ANTI-TELESCOPING
SUPPORT
CONCENTRATE (bnne)
SEAL
BRINE SEALS O-RING
CONNECTOR
Cross section of pressure vessel with 3 membrane modules
SNAP RING
END CAP
WATER
PERMEATE
WATER
CONCENTRATE
OUTLET
Cutaway view of a spiral membrane module
SOURCE WATER
MEMBRANE (cast on fabric backing)
POROUS PERMEATE CARRIER
MEMBRANE (cast on fabric backing)
SOURCE WATER &
FLOW SPACER
SOURCE WATER
The permeate flows through the porous material in a
spiral path until it contacts and flows through the holes
in the permeate core tube.
Adapted from hydranautics
Water Systems diagram.
Processed water passes through the membranes
on both sides of the porous permeate carrier.
SOURCE WATER &
FLOW SPACER
SOURCE WATER
MEMBRANE LEAF
Concentrate
Permeate
water
Concentrate
SOURCE
INLET
Concentrate
Source
W
ater
DEFLECTOR
BLOCK
PERMEATE
Concentrate
Source W
ater
END PLATE
(FEED)
"O" RING
FEED
TUBE
HOLLOW
FIBERS
O RING POROUS
SUPPORT
BLOCK
END PLATE
(PERMEATE)
PERMEATE
EPOXY
TUBE
SHEET
PERMEATE
HEADER
FLOW
SCREEN
EPOXY
DEFLECTOR
BLOCK
or "NUB"
FEED
HEADER
(source
water)
CONCENTRATE
HEADER
The permeator in this figure is adapted from
E.I. duPont de Namours & Co. (Inc.) sales literature.
FIBERS
HOLLOW
10. TURBIDITY THROUGH THE TREATMENT PROCESSES
EPA Guidance Manual 10-20 April 1999
Turbidity Provisions
Source: AWWA and ASCE, 1998.
Figure 10-13. Representation of Hollow-fiber UF Module
10.8.1 Effect on Turbidity
Membrane systems provide a positive barrier to particles of a size larger than will pass
through the membrane. Consequently, the turbidity of water produced by membrane
treatment systems is usually well below 0.3 NTU. The size of particles that will pass
through the membrane depends on the structure of the membrane itself. Figure 10-10
contains information on the sizes of particles removed by different types of membrane
systems. As shown in Figure 10-10 all conventional membrane processes will effectively
remove bacteria and other large organisms such as Giardia and Cryptosporidium. Only
the more restrictive membranes are effective for removing viruses, small colloids, and
dissolved constituents. Many times membrane system performance is determined not by
treated water turbidity but by the level of other constituents such as total dissolved solids
that may be of concern in a particular situation. Please note that this assessment is based
on absolute pore sizes outlined in Figure 10-10. It does not reflect microbe pass-through
resulting from nominal pore size membranes or membrane failures (e.g., rupture, seal
leakage).
10.9 Recycle Streams
Recycle streams are waste streams generated during the water treatment process that are
returned to the treatment train with or without prior treatment. Though they are not
related to one particular treatment process, recycle streams may have a deleterious impact
on treated water quality, including turbidity. Consequently, proper management of recycle
streams is an important part of optimizing turbidity reduction in water treatment. Any
discharges of recycle streams must comply with Federal and State regulations, including
the National Pollution Discharge Elimination System (NPDES) program (40 CFR 122)
and the Pretreatment program (40 CFR 403).
Waste streams may be handled in several different ways. Historically it was a common
practice to discharge waste streams directly to surface waters. In some cases this may still
be acceptable but state or federal regulations have largely curtailed the practice of
10. TURBIDITY THROUGH THE TREATMENT PROCESSES
April 1999 10-21 EPA Guidance Manual
Turbidity Provisions
discharging water treatment waste streams directly to surface water. If a waste stream is
to be discharged to a surface water, an NPDES permit must be obtained from the
appropriate permitting authority prior to any discharge occurring. Due to these new
regulatory requirements, or to conserve water and reduce wastes, waste streams are now
recycled by many systems, with or without treatment, or discharged to a sanitary sewer
system.
10.9.1 Sources of Recycle Streams
The most common recycle streams found in potable water treatment systems include:
i Filter backwash water;
i Sludge thickener supernatant;
i Filter to waste flow; and
i Sedimentation basin underflow.
These recycle streams can represent concentrated waste flows and contain high levels of
contaminants. The continued recycle of these contaminants may affect treated water
quality. Impacts may include higher turbidity as well as higher concentrations of
pathogens and other contaminants in the plant influent. Because of its potential impact to
finished water quality, the handling of recycle streams should be carefully considered
during design and upgrade of all water treatment systems.
10.9.2 Recycle Stream Quantity and Quality
The quantity and quality of recycle streams varies considerably depending on the quality of
the raw water, the treatment processes employed and their efficiencies, and the type and
amount of chemicals used during treatment. Generally, the composite of all waste streams
generated in a conventional complete treatment system employing coagulation,
flocculation, sedimentation, and filtration will be in the neighborhood of 2 to 10 percent of
the total volume of water treated. Contaminants present in recycle streams may include:
i Suspended solids;
i Organics;
i Inorganics; and
i Microorganisms.
Reported quality parameters associated with sludges generated from alum coagulation
include (Culp and Culp, 1974):
i BOD – 40 to 150 mg/l
i COD – 340 to 5000 mg/l
i TSS – 1100 to 14,000 mg/l
i VSS – 600 to 4000 mg/l
i pH – near neutral
10. TURBIDITY THROUGH THE TREATMENT PROCESSES
EPA Guidance Manual 10-22 April 1999
Turbidity Provisions
Levels of Cryptosporidium oocysts ranging from 2,900 to 47,000 counts per mL have
been reported in recycle streams from sedimentation and filtration processes after settling
(Cornwell and Lee, 1994). Reported values of spent filter backwash water turbidity
typically range from 30 to 400 NTU (Kawamura, 1991; Cornwell and Lee, 1993).
Waste streams generated from membrane processes such as reverse osmosis may also
contain significant levels of other contaminants such as dissolved solids and salts.
10.9.3 Point of Recycle Stream Return
The point at which a recycle stream is introduced to the treatment train is also important.
Recycle streams should be introduced at the plant headworks or as close to the beginning
of the treatment system as possible to provide the maximum level of recycle stream
treatment. The point of introduction should also be one where effective mixing is
provided to thoroughly disperse the recycled flow in the raw water stream before it enters
subsequent treatment processes. Studies have shown that the timing or regularity of the
recycle stream introduction is also very important in determining it’s impact on the
performance of the treatment process (Goldgrabe-Brewen, 1995). The continuous and
steady introduction of an equalized recycle stream will have much less negative impact on
the water treatment process than sporadic introduction of larger volume recycle flows that
vary in quantity and quality.
10.9.4 Effect on Turbidity
When waste streams are recycled they may have an impact on the amount of solids loaded
to the treatment system. A model, developed by Cornwell and Lee (1993) to predict the
impact of recycled spent filter backwash water on the concentration of Giardia cysts and
Cryptosporidium cysts on water entering a treatment system, demonstrates the significant
impact recycle streams can have on water quality, even when a relatively high level of
treatment is provided for the recycle flow before it is returned to the main flow stream.
The model predicts a greater than three-fold increase in cyst concentration in the water
entering the treatment process as a result of the recycle practice, even when 70 percent of
the cysts initially present in the recycle stream are removed through treatment. Similar
impacts on turbidity can be expected.
10.10 References
1. AWWA. 1990. Water Quality and Treatment. Fourth Edition. McGraw-Hill, Inc.
2. AWWA and ASCE. 1998. Water Treatment Plant Design. Third Edition. AWWA
and ASCE, McGraw-Hill, Inc, New York, NY.
3. AWWA and ASCE. 1990. Water Treatment Plant Design. Second Edition. ASCE
and AWWA, McGraw-Hill, Inc, New York, NY.
4. Cornwell, D.A. and R.G. Lee. 1994. “Waste Stream Recycling: Its Effect on Water
Quality.” J. AWWA, 86(11): 50-63.
10. TURBIDITY THROUGH THE TREATMENT PROCESSES
April 1999 10-23 EPA Guidance Manual
Turbidity Provisions
5. Cornwell, D.A. and R.G. Lee. 1993. Recycle Stream Effects on Water Treatment.
AWWARF and AWWA.
6. Culp, G.L. and R.L. Culp. 1974. New Concepts in Water Purification. Van
Nostrand Reinhold Environmental Engineering Series, Litton Educational Publishing,
Inc.
7. Goldgrabe-Brewen, J.C. 1995. “Impacts of Recycle Streams on Water Quality.”
Conference proceedings, AWWA Water Quality Conference, Anaheim, CA.
8. Hudson, H.E. Jr. 1981. Water Clarification Processes, Practical Design and
Evaluation. Van Nostrand Reinhold Environmental Engineering Series, Litton
Educational Publishing, Inc.
9. Kawumara, S. 1991. Integrated Design of Water Treatment Facilities. John Wiley
& Sons, Inc.
10. TURBIDITY THROUGH THE TREATMENT PROCESSES
EPA Guidance Manual 10-24 April 1999
Turbidity Provisions
THIS PAGE INTENTIONALLY LEFT BLANK
10. TURBIDITY THROUGH THE TREATMENT PROCESSES
April 1999 10-25 EPA Guidance Manual
Turbidity Provisions
TABLE OF CONTENTS
10. TURBIDITY THROUGH THE TREATMENT PROCESSES............................................ 10-1
10.1 INTRODUCTION ..................................................................................................................... 10-1
10.2 INTAKE FACILITIES/RAW WATER SCREENING ......................................................................... 10-2
10.2.1 Intake Location ............................................................................................................ 10-2
10.2.2 Intake Depth................................................................................................................. 10-2
10.2.3 Effect on Turbidity ....................................................................................................... 10-3
10.3 PRE-SEDIMENTATION ............................................................................................................ 10-3
10.3.1 Effect on Turbidity ....................................................................................................... 10-3
10.4 COAGULATION...................................................................................................................... 10-4
10.4.1 Chemicals .................................................................................................................... 10-4
10.4.2 Rapid Mixing............................................................................................................... 10-6
10.4.3 Effect on Turbidity ....................................................................................................... 10-6
10.5 FLOCCULATION..................................................................................................................... 10-7
10.5.1 Slow Mixing................................................................................................................. 10-7
10.5.2 Detention Time ............................................................................................................ 10-7
10.5.3 Effect on Turbidity ....................................................................................................... 10-8
10.6 SEDIMENTATION/CLARIFICATION........................................................................................... 10-8
10.6.1 Effect on Turbidity ..................................................................................................... 10-11
10.7 FILTRATION........................................................................................................................ 10-11
10.7.1 Conventional Rapid Sand Filters ................................................................................ 10-11
10.7.2 Slow Sand Filters ....................................................................................................... 10-14
10.7.3 Pressure Filters........................................................................................................... 10-15
10.7.4 Precoat/Diatomaceous Earth Filters............................................................................ 10-16
10.7.5 Effect on Turbidity ..................................................................................................... 10-16
10.8 MEMBRANE PROCESSES....................................................................................................... 10-17
10.8.1 Effect on Turbidity ..................................................................................................... 10-20
10.9 RECYCLE STREAMS ............................................................................................................. 10-20
10.9.1 Sources of Recycle Streams ........................................................................................ 10-21
10.9.2 Recycle Stream Quantity and Quality ......................................................................... 10-21
10.9.3 Point of Recycle Stream Return .................................................................................. 10-22
10.9.4 Effect on Turbidity ..................................................................................................... 10-22
10.10 REFERENCES ................................................................................................................... 10-22
LIST OF TABLES
Table 10-1. Typical Feed Pressures for Pressure Driven Membrane Processes .................................. 10-18
LIST OF FIGURES
Figure 10-1. A Typical Conventional Water Treatment System........................................................... 10-1
Figure 10-2. The Alum Coagulation Diagram and Its Relationship to Zeta Potential .......................... 10-5
Figure 10-3. Circular Radial-flow Clarifier ........................................................................................ 10-9
Figure 10-4. Plate Settlers Used for High Rate Sedimentation .......................................................... 10-10
Figure 10-5. Accelerator Solids Contact Unit ................................................................................... 10-10
Figure 10-6. Typical Rapid Sand Filter............................................................................................. 10-12
Figure 10-7. Typical Covered Slow Sand Filter Installation.............................................................. 10-14
Figure 10-8. Cross Section of a Typical Pressure Filter...................................................................... 10-15
Figure 10-9. Typical Filter Run Showing Progress of Floc Penetration and Effluent Turbidity.......... 10-17
Figure 10-10. Pressure-Driven Membrane Process Application Guide .............................................. 10-18
Figure 10-11. Typical Spiral-Wound Reverse Osmosis Membrane Module Driven .......................... 10-19
Figure 10-12. Typical Hollow Fine-Fiber Reverse Osmosis Membrane Module ................................ 10-19
10. TURBIDITY THROUGH THE TREATMENT PROCESSES
EPA Guidance Manual 10-26 April 1999
Turbidity Provisions
Figure 10-13. Representation of Hollow-fiber UF Module................................................................. 10-20

More Related Content

What's hot

Design of 210 Mld Sewage Treatment Plant
Design of 210 Mld Sewage Treatment PlantDesign of 210 Mld Sewage Treatment Plant
Design of 210 Mld Sewage Treatment PlantARUN KUMAR
 
Visit to water treatment plant
Visit to water treatment plantVisit to water treatment plant
Visit to water treatment plantadarsh abhijit
 
Desalination Sustainably Drought Proofing Australia
Desalination Sustainably Drought Proofing AustraliaDesalination Sustainably Drought Proofing Australia
Desalination Sustainably Drought Proofing AustraliaEngineers Australia
 
Water Treatment-Domestic
Water Treatment-Domestic Water Treatment-Domestic
Water Treatment-Domestic Shubham Jain
 
Water treatment,Water Treatment & Basic Steam Distribution
Water treatment,Water Treatment&Basic Steam DistributionWater treatment,Water Treatment&Basic Steam Distribution
Water treatment,Water Treatment & Basic Steam DistributionBSMRSTU
 
Sewage Treatment Plant and its need
Sewage Treatment Plant and its needSewage Treatment Plant and its need
Sewage Treatment Plant and its needRk Singh
 
Water treatment-for-domestic-water-supply - Report
Water treatment-for-domestic-water-supply - ReportWater treatment-for-domestic-water-supply - Report
Water treatment-for-domestic-water-supply - ReportLin Hui
 
sewage treatment plant
sewage treatment plantsewage treatment plant
sewage treatment plantBhavik Patel
 
Reverse Osmosis Sea water Desalination System Presentation - Genesis Water Te...
Reverse Osmosis Sea water Desalination System Presentation - Genesis Water Te...Reverse Osmosis Sea water Desalination System Presentation - Genesis Water Te...
Reverse Osmosis Sea water Desalination System Presentation - Genesis Water Te...Nick Nicholas
 
seawater desalination technology FAQ
seawater desalination technology FAQseawater desalination technology FAQ
seawater desalination technology FAQShiny Zhang
 
Water purification Techniques
Water purification TechniquesWater purification Techniques
Water purification TechniquesAdnan Aslam
 
Sichuan Shanshui Technology Co.,Ltd.
Sichuan Shanshui Technology Co.,Ltd.Sichuan Shanshui Technology Co.,Ltd.
Sichuan Shanshui Technology Co.,Ltd.May Song
 
Design of Effective Stormwater Treatment Systems for Water Quality
Design of Effective Stormwater Treatment Systems for Water QualityDesign of Effective Stormwater Treatment Systems for Water Quality
Design of Effective Stormwater Treatment Systems for Water Qualitystrinkaus
 
Seawater desalination operation maintainence and trouble shooting
Seawater desalination operation maintainence and trouble shootingSeawater desalination operation maintainence and trouble shooting
Seawater desalination operation maintainence and trouble shootingRajesh Mon
 
Desalination of Sea Water using Membrane technology
 Desalination of Sea Water using Membrane technology Desalination of Sea Water using Membrane technology
Desalination of Sea Water using Membrane technologyChandni Sinha
 
Desalination and water reuse technologies
Desalination and water reuse technologiesDesalination and water reuse technologies
Desalination and water reuse technologiesAbengoa
 
Bruni 2012 rapid sand filtration aqua pro.ae
Bruni 2012 rapid sand filtration aqua pro.aeBruni 2012 rapid sand filtration aqua pro.ae
Bruni 2012 rapid sand filtration aqua pro.aehttp://aqua-pro.ae
 

What's hot (20)

Design of 210 Mld Sewage Treatment Plant
Design of 210 Mld Sewage Treatment PlantDesign of 210 Mld Sewage Treatment Plant
Design of 210 Mld Sewage Treatment Plant
 
Visit to water treatment plant
Visit to water treatment plantVisit to water treatment plant
Visit to water treatment plant
 
Desalination Sustainably Drought Proofing Australia
Desalination Sustainably Drought Proofing AustraliaDesalination Sustainably Drought Proofing Australia
Desalination Sustainably Drought Proofing Australia
 
Water Treatment-Domestic
Water Treatment-Domestic Water Treatment-Domestic
Water Treatment-Domestic
 
Water treatment,Water Treatment & Basic Steam Distribution
Water treatment,Water Treatment&Basic Steam DistributionWater treatment,Water Treatment&Basic Steam Distribution
Water treatment,Water Treatment & Basic Steam Distribution
 
Sewage Treatment Plant and its need
Sewage Treatment Plant and its needSewage Treatment Plant and its need
Sewage Treatment Plant and its need
 
Water treatment
Water treatmentWater treatment
Water treatment
 
Water treatment-for-domestic-water-supply - Report
Water treatment-for-domestic-water-supply - ReportWater treatment-for-domestic-water-supply - Report
Water treatment-for-domestic-water-supply - Report
 
sewage treatment plant
sewage treatment plantsewage treatment plant
sewage treatment plant
 
Water treatment process
Water treatment processWater treatment process
Water treatment process
 
Reverse Osmosis Sea water Desalination System Presentation - Genesis Water Te...
Reverse Osmosis Sea water Desalination System Presentation - Genesis Water Te...Reverse Osmosis Sea water Desalination System Presentation - Genesis Water Te...
Reverse Osmosis Sea water Desalination System Presentation - Genesis Water Te...
 
Treatment of water
Treatment of waterTreatment of water
Treatment of water
 
seawater desalination technology FAQ
seawater desalination technology FAQseawater desalination technology FAQ
seawater desalination technology FAQ
 
Water purification Techniques
Water purification TechniquesWater purification Techniques
Water purification Techniques
 
Sichuan Shanshui Technology Co.,Ltd.
Sichuan Shanshui Technology Co.,Ltd.Sichuan Shanshui Technology Co.,Ltd.
Sichuan Shanshui Technology Co.,Ltd.
 
Design of Effective Stormwater Treatment Systems for Water Quality
Design of Effective Stormwater Treatment Systems for Water QualityDesign of Effective Stormwater Treatment Systems for Water Quality
Design of Effective Stormwater Treatment Systems for Water Quality
 
Seawater desalination operation maintainence and trouble shooting
Seawater desalination operation maintainence and trouble shootingSeawater desalination operation maintainence and trouble shooting
Seawater desalination operation maintainence and trouble shooting
 
Desalination of Sea Water using Membrane technology
 Desalination of Sea Water using Membrane technology Desalination of Sea Water using Membrane technology
Desalination of Sea Water using Membrane technology
 
Desalination and water reuse technologies
Desalination and water reuse technologiesDesalination and water reuse technologies
Desalination and water reuse technologies
 
Bruni 2012 rapid sand filtration aqua pro.ae
Bruni 2012 rapid sand filtration aqua pro.aeBruni 2012 rapid sand filtration aqua pro.ae
Bruni 2012 rapid sand filtration aqua pro.ae
 

Similar to Chap 10

SETTLING OF PARTICLES IN WATER
SETTLING OF PARTICLES IN WATERSETTLING OF PARTICLES IN WATER
SETTLING OF PARTICLES IN WATERAnshdhaNANDRA1
 
Report water treatment for domestic water supplies
Report  water treatment for domestic water suppliesReport  water treatment for domestic water supplies
Report water treatment for domestic water suppliesShen Sin
 
Report water treatment for domestic water supplies (2) (1)
Report  water treatment for domestic water supplies (2) (1)Report  water treatment for domestic water supplies (2) (1)
Report water treatment for domestic water supplies (2) (1)Penny3688
 
Design of a Filtration System for a Small Scale Water Treatment Plant for a R...
Design of a Filtration System for a Small Scale Water Treatment Plant for a R...Design of a Filtration System for a Small Scale Water Treatment Plant for a R...
Design of a Filtration System for a Small Scale Water Treatment Plant for a R...inventionjournals
 
Environment management - water management
Environment management - water managementEnvironment management - water management
Environment management - water managementAnish Gawande
 
Brochure pas
Brochure pasBrochure pas
Brochure pastecompk
 
Wastewater pretreatment methods for constructed wetland: Review
Wastewater pretreatment methods for constructed wetland: ReviewWastewater pretreatment methods for constructed wetland: Review
Wastewater pretreatment methods for constructed wetland: Reviewpetro karungamye
 
Design and Different Sections of a Waste Water Treatment Plant
Design and Different Sections of a Waste Water Treatment PlantDesign and Different Sections of a Waste Water Treatment Plant
Design and Different Sections of a Waste Water Treatment PlantIRJET Journal
 
Alternative water supply technologies
Alternative water supply technologiesAlternative water supply technologies
Alternative water supply technologiesPriodeep Chowdhury
 
Coagulation_and_Flocculation_Process_Fun.pdf
Coagulation_and_Flocculation_Process_Fun.pdfCoagulation_and_Flocculation_Process_Fun.pdf
Coagulation_and_Flocculation_Process_Fun.pdfERICK RT
 
SITE VISIT in south state of PRESENTATION.pptx
SITE VISIT in south state of PRESENTATION.pptxSITE VISIT in south state of PRESENTATION.pptx
SITE VISIT in south state of PRESENTATION.pptxYogeshKherde2
 
SITE VISIT in south state of PRESENTATION.pptx
SITE VISIT in south state of PRESENTATION.pptxSITE VISIT in south state of PRESENTATION.pptx
SITE VISIT in south state of PRESENTATION.pptxYogeshKherde2
 
Sand Wand Sediment Removal System for In-stream Restoration
Sand Wand Sediment Removal System for In-stream RestorationSand Wand Sediment Removal System for In-stream Restoration
Sand Wand Sediment Removal System for In-stream RestorationStreamside
 

Similar to Chap 10 (20)

Sewage treatment
Sewage treatmentSewage treatment
Sewage treatment
 
SETTLING OF PARTICLES IN WATER
SETTLING OF PARTICLES IN WATERSETTLING OF PARTICLES IN WATER
SETTLING OF PARTICLES IN WATER
 
Report water treatment for domestic water supplies
Report  water treatment for domestic water suppliesReport  water treatment for domestic water supplies
Report water treatment for domestic water supplies
 
Report water treatment for domestic water supplies (2) (1)
Report  water treatment for domestic water supplies (2) (1)Report  water treatment for domestic water supplies (2) (1)
Report water treatment for domestic water supplies (2) (1)
 
Design of a Filtration System for a Small Scale Water Treatment Plant for a R...
Design of a Filtration System for a Small Scale Water Treatment Plant for a R...Design of a Filtration System for a Small Scale Water Treatment Plant for a R...
Design of a Filtration System for a Small Scale Water Treatment Plant for a R...
 
Design of a Filtration System for a Small Scale Water Treatment Plant for a R...
Design of a Filtration System for a Small Scale Water Treatment Plant for a R...Design of a Filtration System for a Small Scale Water Treatment Plant for a R...
Design of a Filtration System for a Small Scale Water Treatment Plant for a R...
 
Environment management - water management
Environment management - water managementEnvironment management - water management
Environment management - water management
 
Brochure pas
Brochure pasBrochure pas
Brochure pas
 
Wastewater pretreatment methods for constructed wetland: Review
Wastewater pretreatment methods for constructed wetland: ReviewWastewater pretreatment methods for constructed wetland: Review
Wastewater pretreatment methods for constructed wetland: Review
 
Design and Different Sections of a Waste Water Treatment Plant
Design and Different Sections of a Waste Water Treatment PlantDesign and Different Sections of a Waste Water Treatment Plant
Design and Different Sections of a Waste Water Treatment Plant
 
Alternative water supply technologies
Alternative water supply technologiesAlternative water supply technologies
Alternative water supply technologies
 
Coagulation_and_Flocculation_Process_Fun.pdf
Coagulation_and_Flocculation_Process_Fun.pdfCoagulation_and_Flocculation_Process_Fun.pdf
Coagulation_and_Flocculation_Process_Fun.pdf
 
Reverse Osmosis System
Reverse Osmosis SystemReverse Osmosis System
Reverse Osmosis System
 
SITE VISIT in south state of PRESENTATION.pptx
SITE VISIT in south state of PRESENTATION.pptxSITE VISIT in south state of PRESENTATION.pptx
SITE VISIT in south state of PRESENTATION.pptx
 
SITE VISIT in south state of PRESENTATION.pptx
SITE VISIT in south state of PRESENTATION.pptxSITE VISIT in south state of PRESENTATION.pptx
SITE VISIT in south state of PRESENTATION.pptx
 
Treatment processes
Treatment processesTreatment processes
Treatment processes
 
R.o
R.oR.o
R.o
 
Sand Wand Sediment Removal System for In-stream Restoration
Sand Wand Sediment Removal System for In-stream RestorationSand Wand Sediment Removal System for In-stream Restoration
Sand Wand Sediment Removal System for In-stream Restoration
 
Article two
Article twoArticle two
Article two
 
Water treatment
Water treatmentWater treatment
Water treatment
 

Recently uploaded

KSHARA STURA .pptx---KSHARA KARMA THERAPY (CAUSTIC THERAPY)————IMP.OF KSHARA ...
KSHARA STURA .pptx---KSHARA KARMA THERAPY (CAUSTIC THERAPY)————IMP.OF KSHARA ...KSHARA STURA .pptx---KSHARA KARMA THERAPY (CAUSTIC THERAPY)————IMP.OF KSHARA ...
KSHARA STURA .pptx---KSHARA KARMA THERAPY (CAUSTIC THERAPY)————IMP.OF KSHARA ...M56BOOKSTORE PRODUCT/SERVICE
 
Introduction to AI in Higher Education_draft.pptx
Introduction to AI in Higher Education_draft.pptxIntroduction to AI in Higher Education_draft.pptx
Introduction to AI in Higher Education_draft.pptxpboyjonauth
 
Enzyme, Pharmaceutical Aids, Miscellaneous Last Part of Chapter no 5th.pdf
Enzyme, Pharmaceutical Aids, Miscellaneous Last Part of Chapter no 5th.pdfEnzyme, Pharmaceutical Aids, Miscellaneous Last Part of Chapter no 5th.pdf
Enzyme, Pharmaceutical Aids, Miscellaneous Last Part of Chapter no 5th.pdfSumit Tiwari
 
Proudly South Africa powerpoint Thorisha.pptx
Proudly South Africa powerpoint Thorisha.pptxProudly South Africa powerpoint Thorisha.pptx
Proudly South Africa powerpoint Thorisha.pptxthorishapillay1
 
Painted Grey Ware.pptx, PGW Culture of India
Painted Grey Ware.pptx, PGW Culture of IndiaPainted Grey Ware.pptx, PGW Culture of India
Painted Grey Ware.pptx, PGW Culture of IndiaVirag Sontakke
 
Meghan Sutherland In Media Res Media Component
Meghan Sutherland In Media Res Media ComponentMeghan Sutherland In Media Res Media Component
Meghan Sutherland In Media Res Media ComponentInMediaRes1
 
Incoming and Outgoing Shipments in 1 STEP Using Odoo 17
Incoming and Outgoing Shipments in 1 STEP Using Odoo 17Incoming and Outgoing Shipments in 1 STEP Using Odoo 17
Incoming and Outgoing Shipments in 1 STEP Using Odoo 17Celine George
 
Biting mechanism of poisonous snakes.pdf
Biting mechanism of poisonous snakes.pdfBiting mechanism of poisonous snakes.pdf
Biting mechanism of poisonous snakes.pdfadityarao40181
 
Roles & Responsibilities in Pharmacovigilance
Roles & Responsibilities in PharmacovigilanceRoles & Responsibilities in Pharmacovigilance
Roles & Responsibilities in PharmacovigilanceSamikshaHamane
 
भारत-रोम व्यापार.pptx, Indo-Roman Trade,
भारत-रोम व्यापार.pptx, Indo-Roman Trade,भारत-रोम व्यापार.pptx, Indo-Roman Trade,
भारत-रोम व्यापार.pptx, Indo-Roman Trade,Virag Sontakke
 
Introduction to ArtificiaI Intelligence in Higher Education
Introduction to ArtificiaI Intelligence in Higher EducationIntroduction to ArtificiaI Intelligence in Higher Education
Introduction to ArtificiaI Intelligence in Higher Educationpboyjonauth
 
Full Stack Web Development Course for Beginners
Full Stack Web Development Course  for BeginnersFull Stack Web Development Course  for Beginners
Full Stack Web Development Course for BeginnersSabitha Banu
 
Alper Gobel In Media Res Media Component
Alper Gobel In Media Res Media ComponentAlper Gobel In Media Res Media Component
Alper Gobel In Media Res Media ComponentInMediaRes1
 
Presiding Officer Training module 2024 lok sabha elections
Presiding Officer Training module 2024 lok sabha electionsPresiding Officer Training module 2024 lok sabha elections
Presiding Officer Training module 2024 lok sabha electionsanshu789521
 
Final demo Grade 9 for demo Plan dessert.pptx
Final demo Grade 9 for demo Plan dessert.pptxFinal demo Grade 9 for demo Plan dessert.pptx
Final demo Grade 9 for demo Plan dessert.pptxAvyJaneVismanos
 
Earth Day Presentation wow hello nice great
Earth Day Presentation wow hello nice greatEarth Day Presentation wow hello nice great
Earth Day Presentation wow hello nice greatYousafMalik24
 
Solving Puzzles Benefits Everyone (English).pptx
Solving Puzzles Benefits Everyone (English).pptxSolving Puzzles Benefits Everyone (English).pptx
Solving Puzzles Benefits Everyone (English).pptxOH TEIK BIN
 

Recently uploaded (20)

KSHARA STURA .pptx---KSHARA KARMA THERAPY (CAUSTIC THERAPY)————IMP.OF KSHARA ...
KSHARA STURA .pptx---KSHARA KARMA THERAPY (CAUSTIC THERAPY)————IMP.OF KSHARA ...KSHARA STURA .pptx---KSHARA KARMA THERAPY (CAUSTIC THERAPY)————IMP.OF KSHARA ...
KSHARA STURA .pptx---KSHARA KARMA THERAPY (CAUSTIC THERAPY)————IMP.OF KSHARA ...
 
Introduction to AI in Higher Education_draft.pptx
Introduction to AI in Higher Education_draft.pptxIntroduction to AI in Higher Education_draft.pptx
Introduction to AI in Higher Education_draft.pptx
 
OS-operating systems- ch04 (Threads) ...
OS-operating systems- ch04 (Threads) ...OS-operating systems- ch04 (Threads) ...
OS-operating systems- ch04 (Threads) ...
 
Enzyme, Pharmaceutical Aids, Miscellaneous Last Part of Chapter no 5th.pdf
Enzyme, Pharmaceutical Aids, Miscellaneous Last Part of Chapter no 5th.pdfEnzyme, Pharmaceutical Aids, Miscellaneous Last Part of Chapter no 5th.pdf
Enzyme, Pharmaceutical Aids, Miscellaneous Last Part of Chapter no 5th.pdf
 
Proudly South Africa powerpoint Thorisha.pptx
Proudly South Africa powerpoint Thorisha.pptxProudly South Africa powerpoint Thorisha.pptx
Proudly South Africa powerpoint Thorisha.pptx
 
ESSENTIAL of (CS/IT/IS) class 06 (database)
ESSENTIAL of (CS/IT/IS) class 06 (database)ESSENTIAL of (CS/IT/IS) class 06 (database)
ESSENTIAL of (CS/IT/IS) class 06 (database)
 
Painted Grey Ware.pptx, PGW Culture of India
Painted Grey Ware.pptx, PGW Culture of IndiaPainted Grey Ware.pptx, PGW Culture of India
Painted Grey Ware.pptx, PGW Culture of India
 
9953330565 Low Rate Call Girls In Rohini Delhi NCR
9953330565 Low Rate Call Girls In Rohini  Delhi NCR9953330565 Low Rate Call Girls In Rohini  Delhi NCR
9953330565 Low Rate Call Girls In Rohini Delhi NCR
 
Meghan Sutherland In Media Res Media Component
Meghan Sutherland In Media Res Media ComponentMeghan Sutherland In Media Res Media Component
Meghan Sutherland In Media Res Media Component
 
Incoming and Outgoing Shipments in 1 STEP Using Odoo 17
Incoming and Outgoing Shipments in 1 STEP Using Odoo 17Incoming and Outgoing Shipments in 1 STEP Using Odoo 17
Incoming and Outgoing Shipments in 1 STEP Using Odoo 17
 
Biting mechanism of poisonous snakes.pdf
Biting mechanism of poisonous snakes.pdfBiting mechanism of poisonous snakes.pdf
Biting mechanism of poisonous snakes.pdf
 
Roles & Responsibilities in Pharmacovigilance
Roles & Responsibilities in PharmacovigilanceRoles & Responsibilities in Pharmacovigilance
Roles & Responsibilities in Pharmacovigilance
 
भारत-रोम व्यापार.pptx, Indo-Roman Trade,
भारत-रोम व्यापार.pptx, Indo-Roman Trade,भारत-रोम व्यापार.pptx, Indo-Roman Trade,
भारत-रोम व्यापार.pptx, Indo-Roman Trade,
 
Introduction to ArtificiaI Intelligence in Higher Education
Introduction to ArtificiaI Intelligence in Higher EducationIntroduction to ArtificiaI Intelligence in Higher Education
Introduction to ArtificiaI Intelligence in Higher Education
 
Full Stack Web Development Course for Beginners
Full Stack Web Development Course  for BeginnersFull Stack Web Development Course  for Beginners
Full Stack Web Development Course for Beginners
 
Alper Gobel In Media Res Media Component
Alper Gobel In Media Res Media ComponentAlper Gobel In Media Res Media Component
Alper Gobel In Media Res Media Component
 
Presiding Officer Training module 2024 lok sabha elections
Presiding Officer Training module 2024 lok sabha electionsPresiding Officer Training module 2024 lok sabha elections
Presiding Officer Training module 2024 lok sabha elections
 
Final demo Grade 9 for demo Plan dessert.pptx
Final demo Grade 9 for demo Plan dessert.pptxFinal demo Grade 9 for demo Plan dessert.pptx
Final demo Grade 9 for demo Plan dessert.pptx
 
Earth Day Presentation wow hello nice great
Earth Day Presentation wow hello nice greatEarth Day Presentation wow hello nice great
Earth Day Presentation wow hello nice great
 
Solving Puzzles Benefits Everyone (English).pptx
Solving Puzzles Benefits Everyone (English).pptxSolving Puzzles Benefits Everyone (English).pptx
Solving Puzzles Benefits Everyone (English).pptx
 

Chap 10

  • 1. April 1999 10-1 EPA Guidance Manual Turbidity Provisions 10.TURBIDITY THROUGH THE TREATMENT PROCESSES 10.1 Introduction In the arena of public water supply, water treatment is provided to remove constituents from raw water which may pose a risk to public health or are undesirable in finished water. Turbidity is a characteristic related to the concentration of suspended solid particles in water and has been adopted as an easy and reasonably accurate measure of overall water quality. Turbidity can be used to measure the performance of individual treatment processes as well as the performance of an overall water treatment system. Common water treatment processes intended to remove suspended solids and reduce turbidity, or aid in this removal and reduction process, include: i Raw water screening; i Pre-sedimentation; i Coagulation; i Flocculation; i Sedimentation; and i Filtration. This chapter provides a general description of each of these processes and information on the level of turbidity reduction that is commonly achieved through each. A typical water treatment system is shown schematically in Figure 10-1. FILTRATION TREATED WATER STORAGE FLOCCULATION R AW W ATER SO U R C E PRE-SEDIMENTATION RAW WATER INTAKE COAGULATION SEDIMENTATION FILTER BACKWASH SEDIMENTATION BASIN UNDERFLOW DISTRIBUTION Figure 4-1. A Typical Water Treatment System PUMPING Figure 10-1. A Typical Conventional Water Treatment System Figure 10-1. A Typical Conventional Water Treatment System
  • 2. 10. TURBIDITY THROUGH THE TREATMENT PROCESSES EPA Guidance Manual 10-2 April 1999 Turbidity Provisions 10.2 Intake Facilities/Raw Water Screening Systems which obtain water from surface supplies such as lakes and rivers employ intake facilities to allow water to be withdrawn from the source. Most surface water intake facilities are equipped with some type of screening device to prevent large rocks, sticks, and other debris from entering the treatment system. Large bar racks with openings of 1 and 3 inches apart are commonly used for this purpose. They are designed specifically to prevent large materials that could damage the intake structure or downstream equipment from entering the treatment system. Bar racks are usually designed for manual cleaning. When the raw water source is a river and a bar rack is used, the rack is usually oriented to take advantage of the hydraulics of the river to keep the rack cleaned. Although trash racks have little effect on turbidity, they do serve an important function in keeping large solids out of the treatment system. In other cases, intake screens are employed to perform the same function. Intake screens are generally similar to bar racks except they have smaller openings (typically 3/16 to 3/8 inch openings) and are usually equipped with mechanical or hydraulic cleaning mechanisms. Because intake screens remove particles much smaller than those generally removed with bar racks, screens may provide some turbidity reduction by removing larger solids that may be the source of smaller particles further in the treatment train. 10.2.1 Intake Location Intake facilities are typically the very first process in the water treatment system. When the water source is a lake or reservoir, substantial “pre-sedimentation” may occur within the reservoir itself. This can serve to reduce the turbidity of water entering the treatment system as well as dampen the impact of fluctuations in source water turbidity resulting from storm events and other environmental phenomenon. If the intake facility is located away from the reservoir’s water source (i.e., the river feeding the reservoir) this pre- sedimentation may substantially reduce the turbidity of the water entering the treatment system. On the other hand, if the intake facility is located near the point where the supply stream enters the reservoir, the benefit of the pre-sedimentation occurring within the reservoir can be significantly reduced or lost. When the water source is a river, the quality of water withdrawn may be impacted by the location of the intake in relationship to sources of pollution entering the river. For example, an intake structure located upstream from a municipal or industrial wastewater discharge may supply substantially higher quality water than if it were located downstream from the discharge. 10.2.2 Intake Depth For many lakes and reservoirs the water surface elevation varies seasonally due to environmental factors or reservoir management practices. In such cases, it is essential to be able to withdraw water from the source under a variety of different water surface level conditions. Even in cases where the source water surface elevation does not vary significantly, the intake structure may be designed to allow withdrawal from the surface,
  • 3. 10. TURBIDITY THROUGH THE TREATMENT PROCESSES April 1999 10-3 EPA Guidance Manual Turbidity Provisions or from different levels beneath the surface. This capability can have a significant impact on the quality of water entering the treatment system. Many times stratification within a lake or reservoir exists continually or occurs on a seasonal basis. In these cases, the quality of water may vary significantly from near the surface to tens or hundreds of feet below the surface. For example, if algae growth is a problem, water withdrawn from several feet beneath the surface may have substantially lower turbidity than water withdrawn from the surface, as algae needs sunlight to survive and is typically found near the water surface. 10.2.3 Effect on Turbidity Intake screens are not intended to reduce the turbidity of the water entering the treatment system. The solids removed by intake screens are large enough that they typically do not directly impact turbidity, though subsequent deterioration and break-up of these solids could contribute to increased levels of turbidity later in the treatment process. The physical location of the intake structure and the flexibility it provides for varying the depth from which source water is withdrawn can significantly influence the turbidity of the water entering the treatment system. 10.3 Pre-sedimentation Pre-sedimentation is commonly used for water supplies where raw water turbidity is continually high, is high on a seasonal basis, or is high sporadically due to storms or other environmental events within the watershed. Pre-sedimentation may also be used in situations where substantial amounts of sand and gravel may be present in the source water. Depending on the purpose of the pre-sedimentation process, the pre-sedimentation basins may be relatively large settling ponds or small concrete basins. When ponds are utilized, they are generally designed to remove large quantities of silt from the raw water and typically provide hydraulic detention times ranging from a few hours to a few days. Smaller concrete basins that provide less than 20 minutes detention time are sometimes used to provide grit removal. The larger settling ponds are generally not equipped with mechanical sludge removal facilities and must be periodically cleaned by dredging or other means. The concrete pre-sedimentation basins may be equipped with mechanical equipment to remove solids from the basin bottom, or they may be designed to promote manual cleaning using a fire hose or other equipment. When pre-sedimentation is intended to remove silt and other fine suspended solids, chemical addition is often used to enhance process performance. Organic polymers are the chemicals most commonly added prior to pre-sedimentation to enhance solids removal, but alum and ferric chloride are also sometimes used. The chemicals are added to the raw water as it enters the pre-sedimentation basin to promote solid separation. 10.3.1 Effect on Turbidity Pre-sedimentation facility performance depends largely on facility design. Factors such as the ability to provide low velocity plug flow through the pre-sedimentation facility and the capability to add chemicals are critical to achieving optimal system performance. The
  • 4. 10. TURBIDITY THROUGH THE TREATMENT PROCESSES EPA Guidance Manual 10-4 April 1999 Turbidity Provisions characteristics of the suspended solids in the raw water also play a key role in facility performance. In cases where well-designed pre-sedimentation facilities are available and adequate hydraulic detention times are provided (generally greater than 12 hours), significant turbidity reduction can be achieved through the pre-sedimentation process. In cases where pre-sedimentation is used primarily to remove grit from the raw water before it enters subsequent treatment processes, detention times are generally limited to 10 to 20 minutes and very little turbidity reduction is achieved. 10.4 Coagulation Coagulation is the process of conditioning suspended solids particles to promote their agglomeration and produce larger particles that can be more readily removed in subsequent treatment processes. In many cases, dissolved organic substances are adsorbed on the surface of suspended solids particles and effective coagulation can be an effective step in their removal as well (AWWA and ASCE, 1990). The particles suspended in raw water typically vary widely in size. Typical sizes for different types of particles commonly found in water supplies can be seen in Figure 8-1. Colloidal size particles typically carry an electrical charge (AWWA and ASCE, 1990). When the suspended particles are similarly charged, the resulting repulsive forces between particles tend to “stabilize” the suspension and prevent particle agglomeration. The process of coagulation is complex and may involve several different mechanisms to achieve “destabilization”, which allows particle agglomeration and enhances subsequent removal. Coagulation is typically accomplished through chemical addition and mixing. Following coagulation, the processes of flocculation, sedimentation, and filtration are used to remove the “destabilized” particles from suspension. 10.4.1 Chemicals Chemicals commonly used in the coagulation process include aluminum or iron salts and organic polymers. The most common aluminum salt used for coagulation is aluminum sulfate, or alum. Alum may react in different ways to achieve coagulation. When used at relatively low doses (<5 mg/l), charge neutralization (destabilization) is believed to be the primary mechanism involved. At higher dosages, the primary coagulation mechanism is entrapment. In this case, aluminum hydroxide (Al(OH)2) precipitates forming a “sweep- floc” which tends to capture suspended solids as it settles out of suspension. Solution pH plays an important role when alum is used for coagulation since the solubility of the aluminum species in water is pH dependent. If the pH value of a mixed solution is between 4 and 5, alum is generally present in the form of positive ions (i.e., Al(OH)2+ , Al8(OH)4+ , and Al3+ ). However, optimum sweep and sweep coagulation occur when negatively-charged forms of alum predominate, which occurs when the pH is between 6 and 8. Figure 10-2 depicts the solubility of some of these aluminum species present during a typical coagulation process. Figure 10-2 depicts some of the aluminum species involved
  • 5. 10. TURBIDITY THROUGH THE TREATMENT PROCESSES April 1999 10-5 EPA Guidance Manual Turbidity Provisions in alum coagulation and the conditions of aluminum concentration and pH under which they occur (AWWA and ASCE, 1990). When alum is used and charge neutralization is the primary coagulation mechanism, effective flash mixing is critical to the success of the process. When the primary mechanism is entrapment, effective flash mixing is less critical, and flocculation is the more important process. Source: AWWA and ASCE, 1990. Figure 10-2. The Alum Coagulation Diagram and Its Relationship to Zeta Potential Ferric Chloride (FeCl3) is the most common iron salt used to achieve coagulation. Its reactions in the coagulation process are similar to those of alum, but the relative solubility and pH ranges differ significantly from those of alum. Both alum and ferric chloride can be used to generate inorganic polymeric coagulants that have been used for coagulation. These coagulants are typically generated by partially IEP (IOSOELECTRIC POINT) -4 -5 -6 + 0 - LOG(Al)(mol/L)ZETAPOTENTIAL pH OF MIXED SOLUTION 2 4 6 8 10 12 CHARGE NEUTRALIZATION CORONA TO ZERO ZETA POTENTIAL WITH Al(OH) (s)3 Al(OH)4 - COLLOID COATED WITH ( Al(OH) (s) )3 n + 3Al(OH) (s) IEP (IOSOELECTRIC PAINT) UNCOATED COLLOID 2 Al(OH) + + Al (OH)4 208 + Al 3 AlTOTAL ED 0.3 1 3 100 30 10 B C A CHARGE NEUTRALIZATION TO ZERO ZETA POTENTIAL WITH Al (OH) /Al(OH) (s)X RESTABILIZATION ZONE SWEEP COAGULATION Y n+ 3 OPTIMUM SWEEP IEP ALUMASAl(SO)x14.3HO-mg/l2432 IEP (ISOELECTRIC POINT)
  • 6. 10. TURBIDITY THROUGH THE TREATMENT PROCESSES EPA Guidance Manual 10-6 April 1999 Turbidity Provisions neutralizing concentrated solutions of alum or ferric chloride with a base such as sodium hydroxide prior to their use in the coagulation process (AWWA and ASCE, 1990). The resulting inorganic polymers may have some advantages over alum or ferric chloride in cold waters or in low alkalinity waters. Organic polymers tend to be large molecules composed of chains of smaller “monomer” groups (AWWA and ASCE, 1990). Because of their large size and charge characteristics, polymers can promote destabilization through bridging, charge neutralization, or both. Polymers are often used in conjunction with other coagulants such as alum or ferric chloride to optimize solids removal. 10.4.2 Rapid Mixing Mixing is utilized as part of the coagulation process to distribute the coagulant chemicals throughout the water stream. When alum or ferric chloride are used to achieve destabilization through charge neutralization, it is extremely important that the coagulant chemical be distributed quickly and efficiently because it is the intermediate products of the coagulant reaction that are the destabilizing agents. The life of these intermediate species is short and they must contact the solids particles in the water if destabilization is to be achieved. When other mechanisms are predominant in the coagulation process, or when organic polymers are being used as the coagulant chemical, immediate distribution of the coagulant chemical is not as critical and less intense mixing may be acceptable, or even desirable. In some cases, excessive mixing may serve to break-up coagulant molecules or floc particles, thereby reducing the effectiveness of subsequent solids removal processes. Mixing intensity is typically quantified with a number known as the “velocity gradient” or “G value”. The G value is a function of the power input into the mixing process and the volume of the reaction basin. Typical G values for coagulation mixing range from 300 to 8000 sec–1 (Hudson, 1981). The time required to achieve efficient coagulation varies, depending on the coagulation mechanism involved. When charge neutralization is the mechanism involved, the detention time required may be one second or less. When sweep floc or entrapment is the mechanism involved, longer detention times on the order of 1 to 30 seconds may be appropriate (Kawumara, 1991; AWWA and ASCE, 1998; Hudson, 1981). 10.4.3 Effect on Turbidity Coagulation by itself does not achieve turbidity reduction, in fact turbidity may increase during the coagulation process due to the additional insoluble compounds generated through chemical addition. The subsequent processes of flocculation, sedimentation, and filtration are used in conjunction with coagulation to achieve suspended solids and turbidity reduction.
  • 7. 10. TURBIDITY THROUGH THE TREATMENT PROCESSES April 1999 10-7 EPA Guidance Manual Turbidity Provisions 10.5 Flocculation Flocculation is the physical process of agglomerating small particles into larger ones that can be more easily removed from suspension. Flocculation is almost always used in conjunction with, and preceded by coagulation. During the coagulation process the repulsive forces between solids particles are reduced or eliminated. Flocculation is the process of bringing the destabilized particles into contact with one another to form larger “floc” particles. These larger particles are more readily removed from the water in subsequent processes. Flocculation is generally accomplished by mixing the destabilized suspension to provide the opportunity for the particles to come into contact with one another and stick together. 10.5.1 Slow Mixing Mixing is a key aspect of the flocculation process. Often the intensity of mixing is reduced as the water proceeds through the flocculation process to achieve optimum performance. At the beginning of the process, the mixing is fairly intense to maximize the particle contact opportunities. Mixing intensity values (G values) in this area are typically in the range of 60 to 70 sec-1 (Kawamura, 1996). Toward the end of the flocculation process, mixing intensity is generally reduced to minimize the potential for breaking up the floc particles that have begun to form. In this portion of the process, G values are commonly in the 10 to 30 sec-1 range (Kawamura, 1996). Many times mixing intensity is tapered through several different stages of the flocculation process to optimize process effectiveness. A wide variety of flocculation mixing mechanisms have been used in water treatment. These include vertical shaft mechanical mixers, horizontal shaft mechanical mixers, and hydraulic mixing systems. 10.5.2 Detention Time The amount of time the water spends in the flocculation process is a key performance parameter. Adequate time must be provided to allow generation of particles sufficiently large to allow their efficient removal in subsequent treatment processes. The optimum particle size may vary significantly depending on the downstream treatment processes utilized. For example, when sedimentation is used, large floc particles are typically desirable because they tend to settle out of suspension readily. If filtration directly follows the flocculation process, smaller floc particles may be the most desirable since they tend to be stronger and less susceptible to break-up by the shear forces encountered within the filters. Overall detention time in the flocculation process typically ranges from 10 to 30 minutes and is generally provided in several different basins or basin segments. This allows the mixing intensity to be varied through the process.
  • 8. 10. TURBIDITY THROUGH THE TREATMENT PROCESSES EPA Guidance Manual 10-8 April 1999 Turbidity Provisions 10.5.3 Effect on Turbidity As with coagulation, the purpose of the flocculation process is not to directly reduce turbidity or suspended solids levels, but rather to prepare the solids for subsequent removal. The reduction in number of suspended solids particles in suspension is typically achieved in the flocculation process as the smaller particles are combined to form larger ones. This process may, or may not result in a reduction in turbidity. 10.6 Sedimentation/Clarification Sedimentation is the process by which solids are removed from the water by means of gravity separation. In the sedimentation process, the water passes through a basin in which relatively quiescent conditions prevail. Under these conditions, the floc particles formed during flocculation settle to the bottom of the basin while the “clear” water passes out of the basin over an effluent baffle or weir. As shown in Figure 10-3, the solids collect on the basin bottom and are removed, typically by a mechanical “sludge collection” device. The sludge collection device scrapes the solids (sludge) to a collection point within the basin from which it is pumped directly to disposal or to a sludge treatment process. Conventional sedimentation typically involves one or more basins. These “clarifiers” are relatively large open tanks, either circular or rectangular in shape. In properly designed clarifiers, velocity currents are reduced to the point where gravity is the predominant force acting on the water/solids suspension. Under this condition, the difference in specific gravity between the water and the solids particles causes the solids particles to settle to the bottom of the basin. High rate sedimentation is similar to conventional sedimentation except that the sedimentation basin has been modified through the addition of some mechanical or other device to aid in the settling process. These mechanical devices typically consist of plates or tubes intended to reduce the distance the solids particles must settle through the water before they reach the bottom of the basin and can be removed. Figure 10-4 illustrates a plate settler used for high rate sedimentation. Another high rate clarification process employs an “adsorption clarifier” and is designed to provide flocculation and clarifications within a single process. These clarifiers consist of a basin filled with adsorption media, generally small particles of either plastic or rock, about the size of pea gravel. As the water passes through the media, hydraulic mixing promotes flocculation and the flocculated particles adhere to the surface of the media particles. The media is cleaned periodically using an air or air and water backwash process to remove the solids. Solids Contact clarifiers represent an entirely different approach to high rate clarification. They consist of a basin similar to that used for a conventional clarifier but with a sludge recycle system to promote development of a dense sludge blanket as depicted in Figure 10-5.
  • 9. 10. TURBIDITY THROUGH THE TREATMENT PROCESSES April 1999 10-9 EPA Guidance Manual Turbidity Provisions Source: AWWA and ASCE, 1990. Figure 10-3. Circular Radial-flow Clarifier
  • 10. 10. TURBIDITY THROUGH THE TREATMENT PROCESSES EPA Guidance Manual 10-10 April 1999 Turbidity Provisions Source: AWWA and ASCE, 1998. Figure 10-4. Plate Settlers Used for High Rate Sedimentation Source: AWWA and ASCE, 1998. Figure 10-5. Accelerator Solids Contact Unit INLET ORIFICE
  • 11. 10. TURBIDITY THROUGH THE TREATMENT PROCESSES April 1999 10-11 EPA Guidance Manual Turbidity Provisions As the water enters the bottom of the basin and passes upward through the sludge blanket, the flocculated solids in the blanket tend to contact and capture or adsorb the solids from the water. 10.6.1 Effect on Turbidity Suspended solids removal and turbidity reduction rates achieved through sedimentation may range from about 50 to 90 percent, depending on the nature of the solids, the level of pretreatment provided, and the design of the clarifiers. Common values are in the 60 to 80 percent range (Hudson, 1981). A primary function of the sedimentation or clarification process is to reduce the load of solids going to the filters. Optimization of the clarification process will minimize the solids loading on the filters and contribute to enhanced filter performance and better overall treated water quality. 10.7 Filtration Like clarification, filtration is a process in which solids are removed from water and substantial turbidity removal is achieved. Optimization used prior to the filtration process will control loading rates while allowing the system to achieve maximum filtration rates. In fact, filtration is the final step to achieve turbidity reduction in most water treatment operations. The water leaving the filtration process should be well within turbidity limits. In the filtration process, the water passes through a bed of granular filter media or other filtering material and solids are physically retained on the media. After passing through the filter media, the “filtered” water is collected and removed from the filter. The solids retained on the media are also periodically collected and removed. As with the sedimentation process, the performance of most filters depends largely on the preparatory treatment processes of coagulation and flocculation. Without effective use of these processes, only marginal filter performance can be expected. Filters are classified according to the type of media used and the operational conditions employed. The primary types of filters used in domestic water treatment include: i Rapid Sand Filters; i Pressure Filters; i Slow Sand Filters; and i Precoat Filters. 10.7.1 Conventional Rapid Sand Filters Rapid sand filters are the most commonly used type of filters in water treatment systems today. They get their name from the type of media employed (sand) and from the rate at which they are hydraulically loaded. A sectional drawing of a typical rapid sand filter is shown in Figure 10-6.
  • 12. 10. TURBIDITY THROUGH THE TREATMENT PROCESSES EPA Guidance Manual 10-12 April 1999 Turbidity Provisions Source: AWWA and ASCE, 1998. Figure 10-6. Typical Rapid Sand Filter Water enters the filter unit above the media and flows by gravity downward through the filter media to the underdrain or collection system, where it is removed from the filter. When the filter media becomes clogged with solids it is cleaned through a “backwash” process. In the backwash process water, and in some instances, air is introduced to the filter at a relatively high rate through the underdrain system. The water and air flow upward through the media, expanding the media bed and creating a scrubbing or scouring action which removes solids accumulated on the media surface and in inter-particle sites within the media bed. After passing through the media bed, the backwash water and the solids it contains are removed from the filter with a series of collection troughs. Media A variety of different types of media are used in rapid sand filters. As the name implies, the primary media is sand. In some cases all of the sand is the same size, but more commonly the media consists of particles of varying composition, size, and density. Filters with more than one type and size of media are referred to as dual media, mixed media, or multi-media filters, depending on the media provided. As the backwashing process in these filters concludes and the media particles settle back into position in the filter bed, the particles become stratified due to their differing sizes and densities. The largest and least dense media particles accumulate near the top of the media bed and the smallest and most dense particles migrate to the bottom. With this media stratification, when the filter is placed back into service and the water passes down through the bed of media, it first encounters large particles and then finer and finer sand until it reaches the underdrain
  • 13. 10. TURBIDITY THROUGH THE TREATMENT PROCESSES April 1999 10-13 EPA Guidance Manual Turbidity Provisions system. This stratification tends to minimize the “blinding” effect that occurs when solid particles accumulate at the very top of the media bed. It also provides a much greater volume for solids storage within the filter bed, which allows longer filter runs between backwash operations. The top, or coarsest layer of media is often composed of anthracite coal rather than sand. The relatively light coal remains at the top of the filter bed after filter cleaning (backwashing), even though its particle sizes are relatively large. Conversely, high density garnet sand is used for the smallest layer of filter media. The high density of this material causes it to settle quickly to the bottom of the filter bed following backwash operations, even though its particles are relatively small. Hydraulics Filter performance is affected significantly by its hydraulic characteristics. Typical rapid sand filter loading rates range from 2 to 8 gallons per minute per square foot of filter bed surface area. As the filter bed becomes dirty and clogged with solids, the resistance to flow increases. Ultimately flow will cease when the resistance to flow is greater that the gravitational force compelling it. As the “head” required to push water through the filter increases, the rate of flow tends to decrease and solids particles are pushed further and further into the bed of media. Ultimately, if sufficient head is available, solids will be driven completely through the bed and appear in the filtered water, a condition known as “breakthrough”. The filter run should be terminated and backwash initiated before breakthrough occurs. Controls Typical filter control parameters include: i Filter loading rate; i Filter run length; i Headloss; i Filtered water turbidity; i Backwash rate; and i Backwash duration. Control of these parameters gives the operator a great deal of influence in determining the performance of a filter. Often, however, there are conflicting objectives associated with filter operation. For example, the goal of maximizing water production may conflict with the objective of minimizing treated water turbidity. The operator must use good judgement in establishing operational goals and exercising process control to achieve optimal finished water quality and production.
  • 14. 10. TURBIDITY THROUGH THE TREATMENT PROCESSES EPA Guidance Manual 10-14 April 1999 Turbidity Provisions 10.7.2 Slow Sand Filters Slow sand filters have been used for nearly two centuries and have been proven to an effective “low-tech” method of treating some waters (AWWA and ASCE, 1990). A slow sand filter consists of a bed of uniform, relatively fine grain sand underlain by an underdrain system as depicted in Figure 10-7. Source: AWWA and ASCE, 1998. Figure 10-7. Typical Covered Slow Sand Filter Installation Water is introduced at the top of the bed and under the influence of gravity it passes downward through the bed to the underdrain system. Slow sand filters are loaded at much lower rates than rapid sand filters, with typical hydraulic loading rates ranging from 0.04 to 0.1 gallons per minute per square foot of filter bed area (AWWA and ASCE, 1998). Since the sand used in slow sand filters is relatively uniform in size and fine grained, most of the solids removal and turbidity reduction occurs at the very top of the sand bed. As operation of the filter continues, a layer of dirt and micro-organisms builds up at the surface of the bed. This layer is known as the “schmutzdecke” and contributes to the effectiveness of the filter in removing suspended solids and reducing turbidity. After a period of operation the headloss through the filter becomes excessive and the filter must be cleaned. Cleaning is accomplished by letting the water level drop below the top of the filter media and then physically removing the schmutzdecke along with the top 0.8 to 1.2 inches of sand. Typical slow sand filter runs between cleaning are one to six months (Kawamura, 1996). Generally slow sand filters are not proceeded by coagulation or flocculation processes, making them one of the simplest water filtration processes available. However, relatively large land areas are required and, with their simplicity comes little operational flexibility. The only basic operational controls available to the slow sand filter operator are hydraulic loading and frequency of cleaning. AND BACKWASHING
  • 15. 10. TURBIDITY THROUGH THE TREATMENT PROCESSES April 1999 10-15 EPA Guidance Manual Turbidity Provisions Slow sand filters can be very effective in removing suspended solids and reducing turbidity, depending on the nature of the solids particles involved, however, they have been found to be limited in their capability to remove clay particles and color (AWWA and ASCE, 1990). 10.7.3 Pressure Filters Pressure filters are essentially a variation of the conventional rapid sand filter. They employ the same types of media and function in much the same way. The primary difference is that pressure filters are contained within a pressurized vessel, usually made of steel, and pressure is used to push the water through the filter bed rather than gravity as depicted in Figure 10-8. Since pressure filters function much like conventional rapid sand filters, their capability to remove suspended solids and reduce turbidity is similar. The primary advantage of pressure filters is that they do not require the vertical space for several feet of water above the filter bed and the water leaves the filter under pressure, thus eliminating the potential for air binding associated with conventional rapid sand filters. Disadvantages include the lack of access for visual observation of the filter bed and the possibly greater potential to experience turbidity “breakthrough” due to the higher pressure of force driving the filtration process. Source: AWWA and ASCE, 1990. Figure 10-8. Cross Section of a Typical Pressure Filter BAFFLE PLATE FILTERING SURFACE SAND GRAVEL CONCRETE FILL MANIFOLD AND LATERALS INFLUENT EFFLUENT SAMPLE FAUCET
  • 16. 10. TURBIDITY THROUGH THE TREATMENT PROCESSES EPA Guidance Manual 10-16 April 1999 Turbidity Provisions 10.7.4 Precoat/Diatomaceous Earth Filters Precoat filters represent an entirely different kind of filtration mechanism. Instead of using sand or other granular material as the filtration medium, precoat filters use a thin layer of “diatomaceous earth” or similar material to form a thin layer of filter media over a supporting fabric or “septum”, which in turn is supported by a rigid filter support structure. The filter coat material is applied in a slurry before the filtration cycle begins. When water passes through the filter under pressure, usually supplied by a pump but sometimes by gravity, the solids in the water are captured on the surface of the filter media. As the filtration process proceeds, additional filter media is added to the water going to the filter. This supplemental media or “body feed”, like the suspended solids in the water, accumulates on the surface of the filter coat, increasing the depth of the media and preventing the surface blinding effect that would otherwise occur. When the pressure loss through the filter becomes excessive, filtration is discontinued and the filter media coat is washed off through a backwash process, a new pre-coat is applied, and the filtration process begins again. Precoat filters have the capability to remove particles down to about one micron in size. Hydraulic loading rates are typically in the range of 0.5 to 2 gallons per minute per square foot of coated filter surface (ASCE, 1990). Advantages include relatively low capital cost and no need for the preliminary processes of coagulation and flocculation. Disadvantages include the inability to handle high turbidity water, the potential for particle pass-through if the precoat process is not effective or cracking occurs during filter operation, and the relatively poor capability to remove color and taste and odor causing compounds. 10.7.5 Effect on Turbidity Conventional and direct filtration processes have the capability of producing water with turbidity below the proposed SDWA turbidity of 0.3 NTU and even below the 0.1 NTU Partnership for Safe Water finished water optimization goal if properly operated and maintained. Filter performance depends largely on the characteristics of the solids particles entering the filter and on the characteristics of the filter itself. Generally treated water turbidity will be relatively high for a short period immediately following the backwash cycle of rapid sand filter operation, commonly known as post backwash turbidity spiking, but will then improve rapidly to a level near the highest quality level the filter can produce. The filter will then operate at or near this level for an extended period. Figure 10-9 shows typical filtered water turbidity as a function of filter run time.
  • 17. 10. TURBIDITY THROUGH THE TREATMENT PROCESSES April 1999 10-17 EPA Guidance Manual Turbidity Provisions Source: Hudson, 1981. Figure 10-9. Typical Filter Run Showing Progress of Floc Penetration and Effluent Turbidity A variety of strategies may be used to minimize the impact of post backwashing turbidity spikes on finished water quality. These include routing the post backwash, high turbidity, water to waste or adding organic polymers to the backwash water during the final stages of the backwash process. The performance of other types of filters is similar to that of rapid sand filters, except that some may not experience the higher turbidity levels following filter cleaning operations. A filter run is typically terminated after a pre-set period of time, when a certain pre- established headloss is reached, or treated water turbidity deteriorates to a set level. 10.8 Membrane Processes Membrane processes are processes in which the water is passed through a semi-permeable membrane to accomplish solids removal. They are much like other filtration processes except the membrane is used in place of the filter media. An additional benefit that may be realized with membrane processes is the removal of dissolved organic or inorganic constituents. Membrane technology has been in use for many years but recent technological advances coupled with increased concern for particulate removal have brought its use to the forefront of potable water treatment technology. Membranes are made of a variety of different materials and membrane processes are typically classified according to the driving force involved and the size of particles that pass through the membrane (AWWA and ASCE, 1998). For most systems commonly used in larger water treatment operations, the water is forced through the membrane by applying pressure to one side creating a pressure differential across the membrane. The four general classifications of pressure membrane process are:
  • 18. 10. TURBIDITY THROUGH THE TREATMENT PROCESSES EPA Guidance Manual 10-18 April 1999 Turbidity Provisions i Microfiltration; i Ultrafiltration; i Nanofiltration; and i Reverse Osmosis. Figure 10-10 shows the size of particles generally removed by these different membrane processes. Micron Scale Approx MW Typical Size Range of Bacteria Selected Water Constituents Membrane Process* Nanofiltration * Media Filtration (not a Membrane Process is shown for reference only) 10 100 1000 Salts Viruses Colloids SandDissolved Organics 0.001 0.01 0.1 1 Cryptosporidium Reverse Osmosis Ultrafiltration Microfiltration Media Filtration Source: AWWA and ASCE, 1998. Figure 10-10. Pressure-Driven Membrane Process Application Guide Table 10-1 provides information on the typical pressure operating ranges for the different types of pressure-driven membrane processes. Most pressure driven membrane processes utilize either cellulose acetate or synthetic organic polymer membranes (AWWA and ASCE, 1998). Standard pressure membrane configurations include spiral wound membrane units and hollow fiber membrane units. Figures 10-11, 10-12, and 10-13 show the standard membrane configurations commonly used for potable water treatment systems. Table 10-1. Typical Feed Pressures for Pressure Driven Membrane Processes Membrane Process Typical Feed Pressure (psi) Reverse Osmosis - Brackish Water Application Low Pressure 125 to 300 Standard Pressure 350 to 600 Reverse Osmosis - Seawater Application 800 to 1,200 Nanofiltration 50 to 150 Ultrafiltration 20 to 75 Microfiltration 15 to 30 Source: AWWA and ASCE, 1998.
  • 19. 10. TURBIDITY THROUGH THE TREATMENT PROCESSES April 1999 10-19 EPA Guidance Manual Turbidity Provisions Source: AWWA and ASCE,1998. Figure 10-11. Typical Spiral-Wound Reverse Osmosis Membrane Module Driven Source: AWWA and ASCE, 1998. Figure 10-12. Typical Hollow Fine-Fiber Reverse Osmosis Membrane Module MEMBRANE ELEMENT MODULE MODULE ELEMENT MEMBRANE MODULE ELEMENT MEMBRANE PRESSURE VESSEL ANTI-TELESCOPING SUPPORT CONCENTRATE (bnne) SEAL BRINE SEALS O-RING CONNECTOR Cross section of pressure vessel with 3 membrane modules SNAP RING END CAP WATER PERMEATE WATER CONCENTRATE OUTLET Cutaway view of a spiral membrane module SOURCE WATER MEMBRANE (cast on fabric backing) POROUS PERMEATE CARRIER MEMBRANE (cast on fabric backing) SOURCE WATER & FLOW SPACER SOURCE WATER The permeate flows through the porous material in a spiral path until it contacts and flows through the holes in the permeate core tube. Adapted from hydranautics Water Systems diagram. Processed water passes through the membranes on both sides of the porous permeate carrier. SOURCE WATER & FLOW SPACER SOURCE WATER MEMBRANE LEAF Concentrate Permeate water Concentrate SOURCE INLET Concentrate Source W ater DEFLECTOR BLOCK PERMEATE Concentrate Source W ater END PLATE (FEED) "O" RING FEED TUBE HOLLOW FIBERS O RING POROUS SUPPORT BLOCK END PLATE (PERMEATE) PERMEATE EPOXY TUBE SHEET PERMEATE HEADER FLOW SCREEN EPOXY DEFLECTOR BLOCK or "NUB" FEED HEADER (source water) CONCENTRATE HEADER The permeator in this figure is adapted from E.I. duPont de Namours & Co. (Inc.) sales literature. FIBERS HOLLOW
  • 20. 10. TURBIDITY THROUGH THE TREATMENT PROCESSES EPA Guidance Manual 10-20 April 1999 Turbidity Provisions Source: AWWA and ASCE, 1998. Figure 10-13. Representation of Hollow-fiber UF Module 10.8.1 Effect on Turbidity Membrane systems provide a positive barrier to particles of a size larger than will pass through the membrane. Consequently, the turbidity of water produced by membrane treatment systems is usually well below 0.3 NTU. The size of particles that will pass through the membrane depends on the structure of the membrane itself. Figure 10-10 contains information on the sizes of particles removed by different types of membrane systems. As shown in Figure 10-10 all conventional membrane processes will effectively remove bacteria and other large organisms such as Giardia and Cryptosporidium. Only the more restrictive membranes are effective for removing viruses, small colloids, and dissolved constituents. Many times membrane system performance is determined not by treated water turbidity but by the level of other constituents such as total dissolved solids that may be of concern in a particular situation. Please note that this assessment is based on absolute pore sizes outlined in Figure 10-10. It does not reflect microbe pass-through resulting from nominal pore size membranes or membrane failures (e.g., rupture, seal leakage). 10.9 Recycle Streams Recycle streams are waste streams generated during the water treatment process that are returned to the treatment train with or without prior treatment. Though they are not related to one particular treatment process, recycle streams may have a deleterious impact on treated water quality, including turbidity. Consequently, proper management of recycle streams is an important part of optimizing turbidity reduction in water treatment. Any discharges of recycle streams must comply with Federal and State regulations, including the National Pollution Discharge Elimination System (NPDES) program (40 CFR 122) and the Pretreatment program (40 CFR 403). Waste streams may be handled in several different ways. Historically it was a common practice to discharge waste streams directly to surface waters. In some cases this may still be acceptable but state or federal regulations have largely curtailed the practice of
  • 21. 10. TURBIDITY THROUGH THE TREATMENT PROCESSES April 1999 10-21 EPA Guidance Manual Turbidity Provisions discharging water treatment waste streams directly to surface water. If a waste stream is to be discharged to a surface water, an NPDES permit must be obtained from the appropriate permitting authority prior to any discharge occurring. Due to these new regulatory requirements, or to conserve water and reduce wastes, waste streams are now recycled by many systems, with or without treatment, or discharged to a sanitary sewer system. 10.9.1 Sources of Recycle Streams The most common recycle streams found in potable water treatment systems include: i Filter backwash water; i Sludge thickener supernatant; i Filter to waste flow; and i Sedimentation basin underflow. These recycle streams can represent concentrated waste flows and contain high levels of contaminants. The continued recycle of these contaminants may affect treated water quality. Impacts may include higher turbidity as well as higher concentrations of pathogens and other contaminants in the plant influent. Because of its potential impact to finished water quality, the handling of recycle streams should be carefully considered during design and upgrade of all water treatment systems. 10.9.2 Recycle Stream Quantity and Quality The quantity and quality of recycle streams varies considerably depending on the quality of the raw water, the treatment processes employed and their efficiencies, and the type and amount of chemicals used during treatment. Generally, the composite of all waste streams generated in a conventional complete treatment system employing coagulation, flocculation, sedimentation, and filtration will be in the neighborhood of 2 to 10 percent of the total volume of water treated. Contaminants present in recycle streams may include: i Suspended solids; i Organics; i Inorganics; and i Microorganisms. Reported quality parameters associated with sludges generated from alum coagulation include (Culp and Culp, 1974): i BOD – 40 to 150 mg/l i COD – 340 to 5000 mg/l i TSS – 1100 to 14,000 mg/l i VSS – 600 to 4000 mg/l i pH – near neutral
  • 22. 10. TURBIDITY THROUGH THE TREATMENT PROCESSES EPA Guidance Manual 10-22 April 1999 Turbidity Provisions Levels of Cryptosporidium oocysts ranging from 2,900 to 47,000 counts per mL have been reported in recycle streams from sedimentation and filtration processes after settling (Cornwell and Lee, 1994). Reported values of spent filter backwash water turbidity typically range from 30 to 400 NTU (Kawamura, 1991; Cornwell and Lee, 1993). Waste streams generated from membrane processes such as reverse osmosis may also contain significant levels of other contaminants such as dissolved solids and salts. 10.9.3 Point of Recycle Stream Return The point at which a recycle stream is introduced to the treatment train is also important. Recycle streams should be introduced at the plant headworks or as close to the beginning of the treatment system as possible to provide the maximum level of recycle stream treatment. The point of introduction should also be one where effective mixing is provided to thoroughly disperse the recycled flow in the raw water stream before it enters subsequent treatment processes. Studies have shown that the timing or regularity of the recycle stream introduction is also very important in determining it’s impact on the performance of the treatment process (Goldgrabe-Brewen, 1995). The continuous and steady introduction of an equalized recycle stream will have much less negative impact on the water treatment process than sporadic introduction of larger volume recycle flows that vary in quantity and quality. 10.9.4 Effect on Turbidity When waste streams are recycled they may have an impact on the amount of solids loaded to the treatment system. A model, developed by Cornwell and Lee (1993) to predict the impact of recycled spent filter backwash water on the concentration of Giardia cysts and Cryptosporidium cysts on water entering a treatment system, demonstrates the significant impact recycle streams can have on water quality, even when a relatively high level of treatment is provided for the recycle flow before it is returned to the main flow stream. The model predicts a greater than three-fold increase in cyst concentration in the water entering the treatment process as a result of the recycle practice, even when 70 percent of the cysts initially present in the recycle stream are removed through treatment. Similar impacts on turbidity can be expected. 10.10 References 1. AWWA. 1990. Water Quality and Treatment. Fourth Edition. McGraw-Hill, Inc. 2. AWWA and ASCE. 1998. Water Treatment Plant Design. Third Edition. AWWA and ASCE, McGraw-Hill, Inc, New York, NY. 3. AWWA and ASCE. 1990. Water Treatment Plant Design. Second Edition. ASCE and AWWA, McGraw-Hill, Inc, New York, NY. 4. Cornwell, D.A. and R.G. Lee. 1994. “Waste Stream Recycling: Its Effect on Water Quality.” J. AWWA, 86(11): 50-63.
  • 23. 10. TURBIDITY THROUGH THE TREATMENT PROCESSES April 1999 10-23 EPA Guidance Manual Turbidity Provisions 5. Cornwell, D.A. and R.G. Lee. 1993. Recycle Stream Effects on Water Treatment. AWWARF and AWWA. 6. Culp, G.L. and R.L. Culp. 1974. New Concepts in Water Purification. Van Nostrand Reinhold Environmental Engineering Series, Litton Educational Publishing, Inc. 7. Goldgrabe-Brewen, J.C. 1995. “Impacts of Recycle Streams on Water Quality.” Conference proceedings, AWWA Water Quality Conference, Anaheim, CA. 8. Hudson, H.E. Jr. 1981. Water Clarification Processes, Practical Design and Evaluation. Van Nostrand Reinhold Environmental Engineering Series, Litton Educational Publishing, Inc. 9. Kawumara, S. 1991. Integrated Design of Water Treatment Facilities. John Wiley & Sons, Inc.
  • 24. 10. TURBIDITY THROUGH THE TREATMENT PROCESSES EPA Guidance Manual 10-24 April 1999 Turbidity Provisions THIS PAGE INTENTIONALLY LEFT BLANK
  • 25. 10. TURBIDITY THROUGH THE TREATMENT PROCESSES April 1999 10-25 EPA Guidance Manual Turbidity Provisions TABLE OF CONTENTS 10. TURBIDITY THROUGH THE TREATMENT PROCESSES............................................ 10-1 10.1 INTRODUCTION ..................................................................................................................... 10-1 10.2 INTAKE FACILITIES/RAW WATER SCREENING ......................................................................... 10-2 10.2.1 Intake Location ............................................................................................................ 10-2 10.2.2 Intake Depth................................................................................................................. 10-2 10.2.3 Effect on Turbidity ....................................................................................................... 10-3 10.3 PRE-SEDIMENTATION ............................................................................................................ 10-3 10.3.1 Effect on Turbidity ....................................................................................................... 10-3 10.4 COAGULATION...................................................................................................................... 10-4 10.4.1 Chemicals .................................................................................................................... 10-4 10.4.2 Rapid Mixing............................................................................................................... 10-6 10.4.3 Effect on Turbidity ....................................................................................................... 10-6 10.5 FLOCCULATION..................................................................................................................... 10-7 10.5.1 Slow Mixing................................................................................................................. 10-7 10.5.2 Detention Time ............................................................................................................ 10-7 10.5.3 Effect on Turbidity ....................................................................................................... 10-8 10.6 SEDIMENTATION/CLARIFICATION........................................................................................... 10-8 10.6.1 Effect on Turbidity ..................................................................................................... 10-11 10.7 FILTRATION........................................................................................................................ 10-11 10.7.1 Conventional Rapid Sand Filters ................................................................................ 10-11 10.7.2 Slow Sand Filters ....................................................................................................... 10-14 10.7.3 Pressure Filters........................................................................................................... 10-15 10.7.4 Precoat/Diatomaceous Earth Filters............................................................................ 10-16 10.7.5 Effect on Turbidity ..................................................................................................... 10-16 10.8 MEMBRANE PROCESSES....................................................................................................... 10-17 10.8.1 Effect on Turbidity ..................................................................................................... 10-20 10.9 RECYCLE STREAMS ............................................................................................................. 10-20 10.9.1 Sources of Recycle Streams ........................................................................................ 10-21 10.9.2 Recycle Stream Quantity and Quality ......................................................................... 10-21 10.9.3 Point of Recycle Stream Return .................................................................................. 10-22 10.9.4 Effect on Turbidity ..................................................................................................... 10-22 10.10 REFERENCES ................................................................................................................... 10-22 LIST OF TABLES Table 10-1. Typical Feed Pressures for Pressure Driven Membrane Processes .................................. 10-18 LIST OF FIGURES Figure 10-1. A Typical Conventional Water Treatment System........................................................... 10-1 Figure 10-2. The Alum Coagulation Diagram and Its Relationship to Zeta Potential .......................... 10-5 Figure 10-3. Circular Radial-flow Clarifier ........................................................................................ 10-9 Figure 10-4. Plate Settlers Used for High Rate Sedimentation .......................................................... 10-10 Figure 10-5. Accelerator Solids Contact Unit ................................................................................... 10-10 Figure 10-6. Typical Rapid Sand Filter............................................................................................. 10-12 Figure 10-7. Typical Covered Slow Sand Filter Installation.............................................................. 10-14 Figure 10-8. Cross Section of a Typical Pressure Filter...................................................................... 10-15 Figure 10-9. Typical Filter Run Showing Progress of Floc Penetration and Effluent Turbidity.......... 10-17 Figure 10-10. Pressure-Driven Membrane Process Application Guide .............................................. 10-18 Figure 10-11. Typical Spiral-Wound Reverse Osmosis Membrane Module Driven .......................... 10-19 Figure 10-12. Typical Hollow Fine-Fiber Reverse Osmosis Membrane Module ................................ 10-19
  • 26. 10. TURBIDITY THROUGH THE TREATMENT PROCESSES EPA Guidance Manual 10-26 April 1999 Turbidity Provisions Figure 10-13. Representation of Hollow-fiber UF Module................................................................. 10-20