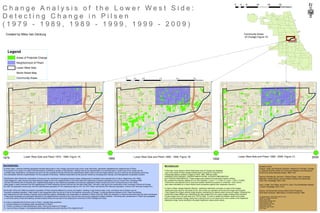
Sources: Esri, HERE, DeLorme, USGS, Intermap, INCREMENT P, NRCan, Esri Japan, METI, Esri China
(Hong Kong), Esri Korea, Esri (Thailand), MapmyIndia, NGCC, © OpenStreetMap contributors, and the GIS
User Community
Sources: Esri, HERE, DeLorme, USGS, Intermap, INCREMENT P, NRCan, Esri Japan, METI, Esri China
(Hong Kong), Esri Korea, Esri (Thailand), MapmyIndia, NGCC, © OpenStreetMap contributors, and the GIS
User Community
Sources: Esri, HERE, DeLorme, USGS, Intermap, INCREMENT P, NRCan, Esri Japan, METI, Esri China
(Hong Kong), Esri Korea, Esri (Thailand), MapmyIndia, NGCC, © OpenStreetMap contributors, and the GIS
User Community
C h a n g e A n a l y s i s o f t h e L o w e r W e s t S i d e :C h a n g e A n a l y s i s o f t h e L o w e r W e s t S i d e :
D e t e c t i n g C h a n g e i n P i l s e nD e t e c t i n g C h a n g e i n P i l s e n
( 1 9 7 9 - 1 9 8 9 , 1 9 8 9 - 1 9 9 9 , 1 9 9 9 - 2 0 0 9 )( 1 9 7 9 - 1 9 8 9 , 1 9 8 9 - 1 9 9 9 , 1 9 9 9 - 2 0 0 9 )
Created by Miles Van Denburg
·
20091989 1999
Lower West Side and Pilsen 1979 - 1989: Figure 1A1979 Lower West Side and Pilsen 1989 - 1999: Figure 1B Lower West Side and Pilsen 1999 - 2009: Figure 1C
Legend
Areas of Potential Change
Neighborhood of Pilsen
Lower West Side
World Street Map
Community Areas 0 0.8 1.6 2.4 3.20.4
Kilometers
0 8 16 24 324
Kilometers
In these maps, I examine potential geospatial changes taking place in the Chicago community area of the Lower West Side, specifically highlighting the neighborhood of Pilsen.
The purpose of our study is to utilize GIS technology to contribute to studies of Gentrification, defined here as the transformation of a working-class or vacant area of the central city into
a middle-class residential or commercial use area. We also considered the fact that the term gentrification itself is often broad and highly political, and as a result we are specifically examining
the urbanization element of gentrification; for the purposes of this study, I defined urbanization as the process marked by increasing size, density, and heterogeneity of population clusters.
Gentrification often follows the urbanization of areas and can contribute to increasing property values, displacement of residents and a general loss of culture. Beginning in the 1950s,
funds flagged for urban renewal and redevelopment began to flow into neighborhoods on the North Side with traditionally immigrant populations such as Lincoln Park. Following WWII
with the incremental loss of industrial jobs, neighborhoods began to lose traditional populations and become subjected to blight, poverty and crime. During this time in the 1950s,
there began a mass movement into the neighborhood of Pilsen following a forced removal from the Near West Side. This was in part due to the construction of the University of Illinois at Chicago.
By 1960, the population would swell, with the initial Mexican population of .5% reaching as high as 14%. By 1970, Pilsen had become 55% Mexican population, of whom 22% had been foreign born.
By the late 1970s and 1980s the Hispanic population of Pilsen became affected by poverty and neglect, resulting in high dropout rates, crime, and illness due to factors such as
industrial workplace relocation. Pilsen today is well recognized within the city as a hub for the Mexican community of Chicago. It holds the Mexican Museum of Art, Plaza Tenochtitlan,
and restaurants and food vendors of equally various Mexican regions. Mobilization and organization of residents in Pilsen since the 1950s has resulted in a vibrant environment that has drawn developers.
These same developers are particularly attracted to the neighborhood's proximity to the Loop and the new young college/post college residents. That being said, development in Pilsen has propagated
a communal sense of fear and loathing, directed towards those who are seen to be stripping the community of their heritage and house.
In order to understand the forces at work in Pilsen, I posited three questions:
1) Is there evidence of increasing urban development in Pilsen?
2) If there is evidence of said development urban, what is the evidence of change?
3) How are these changes in demographics/landscape affecting the public identity of the neighborhood?
In this map I have utilized a World Street base map of Chicago and displayed
upon it the results of three change analysis tests conducted on Channel 2 of
4 temporally distinct Landsat 5 images of 1979, 1989, 1999 and 2009;
LM20240311979175AAA03, LT50230311989181XXX08, LE70230311999185EDC00
and LT50230312009156PAC02. These images were obtained through Earth Explorer utilizing
the Landsat Pre-collection dataset of L4-5, the Collection 1 Level-1; L7 ETM+ C1 Level -1; and L1-5 MSS.
Channel two was selected due to cloud and weather interference present on Channels 1 and 3 which
was made noticeable by a visual infrared band comparison against their respective channel 4.
In order to obtain change Detection Results, I perfomed radiometric correction on each of the images,
dividing the pixel value for the bands by the sine of their sun elevation at the time the image was acquired.
I then clipped the images utilizing image analysis maintaining the desired extent across all images. Following this,
I performed image differencing, subtracting the older images from the newer images creating three individual
10 year ranges over a 30 year span from 1979 to 2009. In order to isolate the brighter values of the areas
which incurred potential change performed a setnull functin on all values which were outside of the brightened
reflectance range, hence resulting in the green brightness values picture above.
METHODOLOGYBACKGROUND:
WORKS CITED
Casuso, Jorge, and Eduardo Camacho. Hispanics in Chicago. Chicago,
IL: Reporter and the Center for Community Research and Assistance
of the Community Renewal Society, 1985. Print.
Genova, Nicholas De, and Ana Y. Ramos-Zayas. Latino Crossings:
Mexicans, Puerto Ricans, and the Politics of Race and Citizenship.
New York: Routledge, 2003. Print.
Lees, Loretta, Tom Slater, and Elvin K. Wyly. The Gentrification Reader.
London: Routledge, 2010. Print.
Source: US Goverment Census 2000 & 2010 Projection:
GCS North American 1983 Datum: D North American 1983
Coordinate System: WGS 1984 UTM Zone 16N
Projection: Transverse Mercator
Datum: WGS 1984
False Easting: 500,000.0000
False Northing: 0.0000
Central Meridian: -87.0000
Scale Factor: 0.9996
Latitude Of Origin: 0.0000
Units: Meter
Community Areas
of Chicago:Figure 1D

Change_Analysis_Pilsen

  • 1.
    Sources: Esri, HERE,DeLorme, USGS, Intermap, INCREMENT P, NRCan, Esri Japan, METI, Esri China (Hong Kong), Esri Korea, Esri (Thailand), MapmyIndia, NGCC, © OpenStreetMap contributors, and the GIS User Community Sources: Esri, HERE, DeLorme, USGS, Intermap, INCREMENT P, NRCan, Esri Japan, METI, Esri China (Hong Kong), Esri Korea, Esri (Thailand), MapmyIndia, NGCC, © OpenStreetMap contributors, and the GIS User Community Sources: Esri, HERE, DeLorme, USGS, Intermap, INCREMENT P, NRCan, Esri Japan, METI, Esri China (Hong Kong), Esri Korea, Esri (Thailand), MapmyIndia, NGCC, © OpenStreetMap contributors, and the GIS User Community C h a n g e A n a l y s i s o f t h e L o w e r W e s t S i d e :C h a n g e A n a l y s i s o f t h e L o w e r W e s t S i d e : D e t e c t i n g C h a n g e i n P i l s e nD e t e c t i n g C h a n g e i n P i l s e n ( 1 9 7 9 - 1 9 8 9 , 1 9 8 9 - 1 9 9 9 , 1 9 9 9 - 2 0 0 9 )( 1 9 7 9 - 1 9 8 9 , 1 9 8 9 - 1 9 9 9 , 1 9 9 9 - 2 0 0 9 ) Created by Miles Van Denburg · 20091989 1999 Lower West Side and Pilsen 1979 - 1989: Figure 1A1979 Lower West Side and Pilsen 1989 - 1999: Figure 1B Lower West Side and Pilsen 1999 - 2009: Figure 1C Legend Areas of Potential Change Neighborhood of Pilsen Lower West Side World Street Map Community Areas 0 0.8 1.6 2.4 3.20.4 Kilometers 0 8 16 24 324 Kilometers In these maps, I examine potential geospatial changes taking place in the Chicago community area of the Lower West Side, specifically highlighting the neighborhood of Pilsen. The purpose of our study is to utilize GIS technology to contribute to studies of Gentrification, defined here as the transformation of a working-class or vacant area of the central city into a middle-class residential or commercial use area. We also considered the fact that the term gentrification itself is often broad and highly political, and as a result we are specifically examining the urbanization element of gentrification; for the purposes of this study, I defined urbanization as the process marked by increasing size, density, and heterogeneity of population clusters. Gentrification often follows the urbanization of areas and can contribute to increasing property values, displacement of residents and a general loss of culture. Beginning in the 1950s, funds flagged for urban renewal and redevelopment began to flow into neighborhoods on the North Side with traditionally immigrant populations such as Lincoln Park. Following WWII with the incremental loss of industrial jobs, neighborhoods began to lose traditional populations and become subjected to blight, poverty and crime. During this time in the 1950s, there began a mass movement into the neighborhood of Pilsen following a forced removal from the Near West Side. This was in part due to the construction of the University of Illinois at Chicago. By 1960, the population would swell, with the initial Mexican population of .5% reaching as high as 14%. By 1970, Pilsen had become 55% Mexican population, of whom 22% had been foreign born. By the late 1970s and 1980s the Hispanic population of Pilsen became affected by poverty and neglect, resulting in high dropout rates, crime, and illness due to factors such as industrial workplace relocation. Pilsen today is well recognized within the city as a hub for the Mexican community of Chicago. It holds the Mexican Museum of Art, Plaza Tenochtitlan, and restaurants and food vendors of equally various Mexican regions. Mobilization and organization of residents in Pilsen since the 1950s has resulted in a vibrant environment that has drawn developers. These same developers are particularly attracted to the neighborhood's proximity to the Loop and the new young college/post college residents. That being said, development in Pilsen has propagated a communal sense of fear and loathing, directed towards those who are seen to be stripping the community of their heritage and house. In order to understand the forces at work in Pilsen, I posited three questions: 1) Is there evidence of increasing urban development in Pilsen? 2) If there is evidence of said development urban, what is the evidence of change? 3) How are these changes in demographics/landscape affecting the public identity of the neighborhood? In this map I have utilized a World Street base map of Chicago and displayed upon it the results of three change analysis tests conducted on Channel 2 of 4 temporally distinct Landsat 5 images of 1979, 1989, 1999 and 2009; LM20240311979175AAA03, LT50230311989181XXX08, LE70230311999185EDC00 and LT50230312009156PAC02. These images were obtained through Earth Explorer utilizing the Landsat Pre-collection dataset of L4-5, the Collection 1 Level-1; L7 ETM+ C1 Level -1; and L1-5 MSS. Channel two was selected due to cloud and weather interference present on Channels 1 and 3 which was made noticeable by a visual infrared band comparison against their respective channel 4. In order to obtain change Detection Results, I perfomed radiometric correction on each of the images, dividing the pixel value for the bands by the sine of their sun elevation at the time the image was acquired. I then clipped the images utilizing image analysis maintaining the desired extent across all images. Following this, I performed image differencing, subtracting the older images from the newer images creating three individual 10 year ranges over a 30 year span from 1979 to 2009. In order to isolate the brighter values of the areas which incurred potential change performed a setnull functin on all values which were outside of the brightened reflectance range, hence resulting in the green brightness values picture above. METHODOLOGYBACKGROUND: WORKS CITED Casuso, Jorge, and Eduardo Camacho. Hispanics in Chicago. Chicago, IL: Reporter and the Center for Community Research and Assistance of the Community Renewal Society, 1985. Print. Genova, Nicholas De, and Ana Y. Ramos-Zayas. Latino Crossings: Mexicans, Puerto Ricans, and the Politics of Race and Citizenship. New York: Routledge, 2003. Print. Lees, Loretta, Tom Slater, and Elvin K. Wyly. The Gentrification Reader. London: Routledge, 2010. Print. Source: US Goverment Census 2000 & 2010 Projection: GCS North American 1983 Datum: D North American 1983 Coordinate System: WGS 1984 UTM Zone 16N Projection: Transverse Mercator Datum: WGS 1984 False Easting: 500,000.0000 False Northing: 0.0000 Central Meridian: -87.0000 Scale Factor: 0.9996 Latitude Of Origin: 0.0000 Units: Meter Community Areas of Chicago:Figure 1D