1. A WATER BUDGET MODEL FOR LAKE
LOWERY; POLK COUNTY FLORIDA
FRANCES CHAMPAGNE
DON ELLISON, P.G
ABSTRACT
The Water Budget Model (WBM) is part of a multi-step process used by the Southwest
Florida Water Management District (SWFWMD) to set minimum levels for various waterbodies.
Lake Lowery is a rain/evapotranspiration driven, flow through lake with a moderate leakance to
the Floridan aquifer, approximately 17 in/year averaged over the lake surface area and 5.6
in/year averaged over the watershed. The prediction model shows that when the Upper Floridan
aquifer is lowered 4 feet by pumping, the lake is lowered by almost 1 foot.
INTRODUCTION
LOWERY
Lake Lowery is located in north-central Polk County, northwest of Haines City,
approximately half a mile north of U.S. Highway 17 and a third of a mile west of U.S. Highway
27. The lake sits in the southernmost part of the Ocklawaha Basin on the border of the Peace
River Basin (Figure 1). Its irregular heart shape and variability in depth gives an approximate
surface area of 1128 acres and depth of 33 feet. The deepest point of the lake is concentrated on
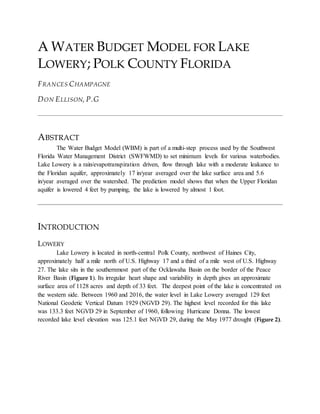
the western side. Between 1960 and 2016, the water level in Lake Lowery averaged 129 feet
National Geodetic Vertical Datum 1929 (NGVD 29). The highest level recorded for this lake
was 133.3 feet NGVD 29 in September of 1960, following Hurricane Donna. The lowest
recorded lake level elevation was 125.1 feet NGVD 29, during the May 1977 drought (Figure 2).
2. Figure 1: Lake Lowery sits in the Lake Lowery Outlet watershedin the Ocklawaha River basin (sand color) on the
border of the Peace River basin (purple).
3. Figure 2: Lake Lowery elevations in feet (NGVD 29) from January 1960 to January 2015.
According to the U.S Geological Survey (USGS), the lake’s watershed is estimated to be
3410 acres (Figure 3). The entire watershed of the area is composed of Group A and A/D type
soils. Group A soils are defined as sandy, loamy sand, or sandy loam, all of which have a high
infiltration rate. Group D soils are defined as clay loam, silty, or clay, which have a very low
infiltration rate. The A/D connotation to the aforementioned soils indicates that the soil type will
behave as Group A under drained conditions, however, it behaves like a Group D soil during
high water table conditions (Figure 4) (USDS 1986). The extreme disparity in soil group types is
a result of the local topography, with the higher sand hills being the type A soils. Many of these
sand hills with a deeper water table are utilized for citrus. The areas where the ground has a low
infiltration rate are unaltered marsh and swampland (Bethune and Tai 1987).
124
125
126
127
128
129
130
131
132
133
134
LakeElevationfeet,NGVD29 Lake Lowery Level
4. Figure 3: Topographical map of the Lake Lowery watershed(contour interval 5 ft.) The marsh elevation is between
130 and 135 ft. NGVD 29.
5. Figure 4: Soils group map of Lake Lowery watershed. Green indicating Group A soils and red indicating GroupA/D
soils. The red line outlines the watershed.
The geology that runs beneath the lake is made up of four layers (Figure 5b). The
surficial aquifer that runs through Lake Lowery is contained in Holocene deposits. Towards the
bottom of the Holocene deposits are Pliocene aged clays and clayey sands, which are at the top
of the Intermediate aquifer system. The Intermediate aquifer system is comprised of the
Hawthorn group which also makes up the confining unit. The Upper Floridan aquifer is
comprised of Ocala Limestone and portions of the Avon Park Formation (Arthur, et al. 2008).
The hydrogeology of the area (Figure 5c) is generally made up of an 80 feet thick
unconsolidated surficial deposit, which degrades down into clay towards the bottom making up
the surficial aquifer. Beneath the surficial aquifer is a 30 to 40 feet Intermediate aquifer system,
primarily made up of interbedded limestones and phosphatic clays. The thick bottom layer, the
Upper Floridan aquifer is made up mostly of carbonates (Arthur, et al. 2008). Majority of the
region that Lake Lowery is located within is a significant recharge area for the Floridan aquifer
system (Aucott 1988).
6. Figure 5a: Generalizedtopographicmapof the northeast Polk County. Dark colors indicate a higher region. Redline
is the cross-sectional path shown in Figure 5b and Figure 5c.
A
A’
7. Figure 5b: Geologicelevations from Ato A’ which shows the topography (yellow), the topof the Hawthorn Group
(brown), the topof the Ocala Limestone (green), andthe top of the Avon Park Formation (purple).
-250
-200
-150
-100
-50
0
50
100
150
200
250
0 10000 20000 30000 40000 50000 60000 70000 80000 90000
Elevationfeet,NGVD29
Distance, feet
Geologic Cross-Sectionof Lake Lowery; A-A'
Lake Lowery
Hawthorn Group
Ocala Limestone
Avon Park Formation
A
A'
8. Figure 5c: Hydraulicelevations from Ato A’. The Surficial (yellow topography) below the lake is approximately 80
feet above the Intermediate layer (red), which is approximately 35 feet above the Upper-Floridan (blue) (Arthur, et al.
2008).
Majority of the area surrounding Lake Lowery is rural, and undeveloped. The
development that has occurred around the lake consists of mostly residential growth and citrus
groves (Figure 6). The potable and almost all of the irrigation water supply comes from the
Floridan aquifer.
-150
-100
-50
0
50
100
150
200
250
0 10000 20000 30000 40000 50000 60000 70000 80000 90000
Elevationfeet,NGVD29
Distance, feet
Hydrologic Cross-SectionalArea, Lake Lowery A-A'
Lake Lowery
Surficial
Intermediate
Upper-Floridan
A
A'
9. Figure 6: 2011 Land use map around Lake Lowery. Light green is wetlands, sand is agriculture, pink is urban, and
brown is rangeland. Black line indicates watershed area.
There are four structures on the lake (Figure 7). Between 2001 and 2003, these structures
were reassessed and altered during this time, with the bulk of the modification made in 2002.
Site 1 consists of four corrugated plastic pipes of a 24 inch diameter with invert elevations of
129.6 feet and 130.05 feet. The flow from the lake through the culvert is from northeast to
southwest. The final pipe in the quartet has been plugged. Site 2 consists of four 24 inch concrete
pipes with an invert elevation of 131.0 feet, due to a weir, and one 18 inch concrete pipe conduit
with an invert elevation of 129.7 feet. The flow through Site 2 is from the northeast to the
southwest. Site 3 consists of a drainage box and outlet pipe of 36 inches with an initial invert
elevation of 131.0 feet and a top elevation of 133.0 feet. The flow through Site 3 is from north to
south. Site 4 consists of two 46 inch reinforced concrete pipes capped by two flap gates on the
north side of the conduit to prevent water flowing from the north to enter the lake. The invert
elevation is 127.6 feet and 127.6 feet. The flow direction of Site 4 would be south to north under
high elevation conditions (Keith & Schnars, P.A. 2003). As of March 2016, these flap gates
seemed to be non-functional.
10. Figure 7: Structure locations aroundLake Lowery. Site 1 is four corrugated plasticpipes. Site 2 is four concrete pipes
with a weir and one conduit. Site 3 is a drainage box. Site 4 is two flapper valve pipes that may not be functional.
MODEL
The Water Budget Model (WBM) is part of a multi-step process used by the SWFWMD
to set minimum levels for various waterbodies. These minimum flow levels dictate the “limit at
which further withdrawals would be significantly harmful to the water resources or ecology of
the area” (Section 373.042, Florida Statutes). These minimum flows are established and used by
SWFWMD for water resource permitting and planning. Exceedance percentiles are based on
Historic water levels. Historic is defined as the period where there are no measurable impacts
from water withdrawals and the structural condition is the same as present day conditions (Carr,
Hancock and Leeper 2015).
The WBM is used to show the relationship between the water that enters the lake and the
water that leaves the lake. It can then be used to approximate exceedance percentiles. The
percentiles are identified as the tenth percentile (P10), fiftieth percentile (P50), and ninetieth
percentile (P90) and are defined as the elevation the lake surface equaled or exceeded ten percent
of the time, half of the time, and ninety percent of the time, respectively.
11. The WBM is a spreadsheet based tool which includes various hydrologic processes such
as rainfall, evapotranspiration, overland flow, channel inflow and outflow, Surficial aquifer
inflow and outflow, and Upper Floridan aquifer inflow and outflow (Carr, Hancock and Leeper
2015).
METHODS
Microsoft Excel 2010 was used to set up and edit the WBM. Most of the data inserted
into the model had been obtained from SWFWMD’s Water Management Information System
(WMIS) database.
The period of record for the Lake Lowery WBM started January 1, 2003 and ran through
2015. This was chosen as there have been no known alterations to the lake since 2003, and also
allows the model to extend as close as possible to the present day.
LAKE LEVELS/STAGE
Lake levels are measured by a number of gauges, which are recorded and sourced into
SWFWMD’s Water Management Information System (WMIS). Site identification (SID) 17710
was used for lake elevation measurements and contained a date range from September 1998 to
January 2016. Gaps in the dataset were linearly infilled.
The lake stage-area and stage-volume estimates were determined by the topography and
bathymetry of the lake and the surrounding watershed. From this information, a three-
dimensional (3D) digital elevation model was formed to then calculate the lake’s surface area
and bathymetric data in 0.1 foot intervals starting with the highest possible surface elevation
down to the deepest point of the lake. These were then combined calculate the volume of water
the lake contained at any given stage (Figure 8) (Carr, Hancock and Leeper 2015)
12. Figure 8: The lake stage to area graph. Indicates the surface area of the lake (acres) when the lake is at a particular
depth. The red line indicates the lowest weir elevation at 129.7 feet NGVD 29.
RAIN
Rain data were collected from rain gauges within a 10 mile radius, starting with the
closest gauge, SID 26344. Any gaps in the gauge’s data were infilled using data from the next
closest gauge. This process was continued with each gauge to provide a full 10 mile radius
column of data. Any gaps which could not be filled using this method were linearly infilled.
ET
The evapotranspiration data were taken from an extensive study by the USGS on Lake
Starr, 13 miles SE of Lake Lowery (Figure 9). The USGS used the energy-budget method
derived by E. R. Anderson (1954) (as cited by Swancar, Lee and O'Hare 2000). Because the two
year study did not extend to the WBM’s selected time period, the monthly average from the
study was used instead.
90
95
100
105
110
115
120
125
130
135
140
0 500 1000 1500 2000 2500
LakeStageDepth,feeet
NGVD29
Lake Surface Area, Acres
Lake Stage to Area
13. Figure 9: Satellite mapindicating the distance between Lake Lowery and Lake Starr, which is 13 miles.
RUNOFF
The runoff was based off of the Soil Conservation Service curve number (CN) method
(Mockus 1972) using the procedure described in the USDS Technical Release 55 (1986). Runoff,
represented by Q in feet, was calculated using Equation [1]
𝑄 =
( 𝑃 − 𝐼𝑎)2
( 𝑃 − 𝐼𝑎 ) + 𝑆
( 1 )
where 𝑷 is the rainfall, 𝑰 𝒂 is the initial abstraction, which is the amount of water absorbed before
runoff begins, and 𝑺 is the potential maximum retention after runoff begins, which is related to
soil and watershed cover. The initial abstraction was approximated by Equation [2] to be:
𝐼𝑎 = 0.2𝑆 ( 2 )
(USDS 1986). The value of 0.2 is the ratio of 𝐼𝑎/𝑆. When using Equation [2], Equation [1] then
becomes Equation [3] (Mockus 1972).
14. 𝑄 =
( 𝑃 − 0.2𝑆)2
𝑃 + 0.8𝑆
( 3 )
S is related to CN by Equation [4]
𝑆 =
1000
𝐶𝑁
− 10
( 4 )
where curve number values range from 0 to 100 and are based off of antecedent moisture
conditions. Higher CN values represent more runoff as indicated by Table 1, which shows some
common CN averages (Soil Conservation Service 1989). An average CN of 75 (CN2) was used
for the normal in this model based on the conditions in Table 2. The curve number for other
antecedent moisture conditions was calculated using Equation [5], Equation [6], and Equation
[7] via the Soil and Water Assessment Tool, 2003 (Berryman & Henigar, Inc. 2005).
𝐶𝑁3 = 𝐶𝑁2 𝑒0.00673 (100−𝐶𝑁2 ) ( 5 )
𝐶𝑁1 = 𝐶𝑁2 −
20(100− 𝐶𝑁2)
100 − 𝐶𝑁2 + 𝑒2.533−0.0636 (100−𝐶 𝑁2 )
( 6 )
𝐶𝑁4 =
1
2
(𝐶𝑁1 + 𝐶𝑁2)
( 7 )
Table 1: The average curve number for each soil group (Soil Conservation Service 1989). Lower numbers mean more
infiltration, while highernumbers indicate more runoff.
HSG Soil Texture Average Common CN
A Sand, loamy 52
B Silt loam 70
C Sandy clay loam 80
D Clay loam, silty clay, clay 85
15. Table 2: The calculated curve number series based off a curve number average of 75. CN 1, 3, and 4 are based off of
antecedent moisture conditions (SWAT).
Condition
CN
Number
CN
S Ia
AMC Criteria (inch)
inch inch
Very Dry 1 57 7.59 1.52 0.00 for previous 6 days
Moderately
Dry
4 66 5.17 1.03 0.00 for previous 5 days
Normal 2 75 3.33 0.67
0.00 to 0.25 for previous
3 days
Wet 3 89 1.27 0.25
> 0.25 for previous 3
days
GROUNDWATER
The Upper Floridan aquifer elevation was based on SID 17652 which is located 3.6 miles
away from the lake. It was the only Upper Floridan aquifer well with a nearly continuous record
in the area. Comparing USGS Potentiometric surface maps of the well and the lake covering 4
years showed an average difference of 7 feet between the two locations. This was removed from
the well’s elevation to apply its measurement to the lake(Figure 10).
16. Figure 10: May 2009 potentiometricsurface map showing the relationshipbetween SID17653 elevation andLake
Lowery (Kinnaman and Dixon 2009)
The surficial aquifer elevation was based off the closest well to the lake, SID 1593179,
which was 2276 feet away. Any gaps in well SID 1593179’s data were linearly infilled. Any data
for the surficial required after SID 1593179’s period of record were based on the average
difference between the well’s elevation and the lake elevation, adding that difference to the lake
level (Figure 11). This well was then referred to as the “up-gradient” well.
SID 17653
17. Figure 11: Comparison of SID 1593179 linearly infilled(yellow) andthe lake level (blue). Shows the close relationship
between the lake and the well.
A water table elevation map was created to aid in the determining the existence of a
surficial aquifer elevation gradient on either side of the lake (Figure 12). The gradient was based
on the water level difference between SID 17653, SID 1593179, located 3.5 miles away, and SID
25226, located 6.2 miles away from SID 1593179.
A hypothetical well was then placed on the down-gradient side of the lake in the SID
1593179-SID 25226 direction. Its distance was equivalent to that of SID 1593179 from Lake
Lowery’s shore, 2276 feet. This well was then referred to as the “down-gradient” well. The water
table elevation contour map (Figure 12), though not detailed, seemed to correlate with the
elevation changes in the Hawthorn Group as seen in the cross-sectional area of the region from
northwest to southeast (Figure 5c).
124
125
126
127
128
129
130
131
132
133
134
Jan-01 Jan-02 Jan-03 Jan-04 Jan-05
Elevationfeet,NGVD29 Lake Level and Well 1593179
1593179 infilled Lake Level
18. Figure 12: A generalizedwater table contour mapusing data from four surficial wells and three lake level staff
gauges. Contours indicate the head difference at 2 foot intervals. It shows the direction of flow through the lake as
well as indicatedby a difference in gradient from the northwest side of the lake to the southeast side.
WATER BALANCING
The main purpose of the model was to simulate a reasonable water balance between the
inflow of water entering the lake and the outflow of water leaving the lake. The magnitude of
each component per year is then calculated, showing the expected inflow and outflow of water
through the lake. All daily data components must be complete, and are represented in units of
feet and day.
SURFICIAL LEAKAGE
The leakage from the surficial aquifer to the lake was calculated using Equation [8] for
the up-gradient side of the lake
𝑙 𝑠𝑢 =
𝐴 𝐿
2
𝐾 (
𝑆 𝑢 − 𝐿 𝑝
𝐷
)𝐴 𝑐
*
( 8 )
19. where 𝑨 𝑳 is the area of the lake, which is divided in half to indicate the portion of the lake which
is being influenced by the up-gradient conditions, and 𝑲 is the hydraulic conductivity. The
difference between the surficial water table elevation in the up-gradient direction, 𝑺 𝒖, and the
previous lake level that was predicted, 𝑳 𝒑, is divided by the horizontal distance between the
water table measurement and the lake, 𝑫, all of which is then multiplied by an area coefficient,
𝑨 𝒄, which reduces the area of influence due to the surface area of the lake being used. The use of
the surface area of the lake instead of the vertical cross-sectional area is an established District
procedure. Equation [9] was used the same way for the down-gradient side of the lake.
𝑙 𝑠𝑑 =
𝐴 𝐿
2
𝐾 (
𝑆 𝑑 − 𝐿 𝑝
𝐷
) 𝐴 𝑐
†
( 9 )
For both the up-gradient and down-gradient wells, the area coefficient of 0.04±0.01 ft-1
was used.
FLORIDAN LEAKAGE
The leakage to the Upper Floridan was calculated using Equation [10]
𝑙 𝐹𝐿 = 𝐴 𝐿 𝐾‡ (
𝐿 𝑝 − 𝐹𝑙
𝑏𝑖
)
( 10 )
where 𝑭𝒍 is the potentiometric elevation of the Upper Floridan aquifer, 𝑳 𝒑 is the lake level, 𝒃𝒊 is
the Intermediate thickness, and K, the hydraulic conductivity of the Intermediate aquifer. A
hydraulic conductivity of 0.0155 ft/day was used for the Intermediate aquifer, which when
divided by the thickness of the intermediate gives a leakance coefficient of 4×10⁻⁴ day-1. The
thickness of the Intermediate aquifer was used for the distance instead for the vertical distance
from the bottom of the lake to the top of the Floridan aquifer because the Intermediate aquifer is
the primary restriction to the vertical flow of water.
DCIA
The Directly Connected Impervious Area (DCIA) is the amount of water coming into
contact with impervious surface areas which is then directly contributing to the lake. It is
calculated through Equation [11]
𝐷𝐶𝐼𝐴 = ( 𝐷𝐶𝐼𝐴%)( 𝐴 𝑤 − 𝐴 𝐿 ) 𝑃 ( 11 )
where the 𝑫𝑪𝑰𝑨% is the percent of the watershed that is impervious due to manmade structures,
multiplied by the total area of the watershed, 𝑨 𝒘, minus the area of the lake, 𝑨 𝑳, all multiplied by
rain, 𝑷. Lake Lowery had a DCIA% of 11%.
* The variable does not have a set value, but must be reasoned through Darcy’s Law.
† The variable does not have a set value, but must be reasoned through Darcy’s Law.
‡ The variable does not have a set value, but must be reasoned through Darcy’s Law.
20. RUNOFF
The runoff is a calculation of the amount of water flowing overland, without taking
structures into account (Equation [12]).
𝑄𝑟 = (𝑄)(1 − 𝐷𝐶𝐼𝐴%)(𝐴 𝑤 − 𝐴 𝐿 ) ( 12 )
It is the runoff, 𝑸, derived in Equation [3], using the parameters in Table 2 multiplied by
the remaining area that is not impervious multiplied by the watershed’s land area.
CHANNEL FLOW
The channel flow (Equation [13]), for this model, is the amount of water that is exiting
out of each culvert when the lake elevation is above the culvert’s inlet elevation.
𝑄𝑐 = (𝐿 𝑝 − ℎ 𝑐)𝐴 𝐿 𝐾 § ( 13 )
It is the elevation difference of the previous lake level,𝑳 𝒑, to the culvert height, 𝒉 𝒄,
multiplied by the previous day area of the lake, 𝑨 𝑳, by the hydraulic conductivity of the outflow,
𝑲. The outflow hydraulic conductivity for the lowest culvert was 0.0014±0.0003 ft/day, and
0.0003±1 ft/day for the highest.
PREDICTION CALCULATION
The prediction calculation (Equation [14]) incorporates the results from equations [2]
and [5] through [10] to predict what the lake level should look like given the available data and
parameters.
𝑃𝑟𝑒𝑑 = 𝐿 𝑝 + [( 𝑃 − 𝐸𝑇) + (
𝐿 𝑠𝑢 + 𝑙 𝑠𝑑 + 𝑙 𝐹𝐿 + 𝑄𝑟 + 𝐷𝐶𝐼𝐴 − Σ𝑄𝑐
𝐴 𝐿
)]
( 14 )
The prediction calculation was then compared against the lake level and its percentiles.
The goal is to have the predicted lake level within five-tenths of the actual, while having realistic
fluxes that are not unreasonable according to Darcy’s Law equation. Table 3 shows a summary
of the inputs for Lake Lowery.
§ The variable does not have a set value, but must be reasoned through Darcy’s Law.
21. Table 3: Summary of Lake Lowery inputs for the water-budget model. Leakance is defined as hydraulicconductivity
divided by thickness.
Input Variable Value
Watershed Area (acres) 3410
SCS Curve Number 75
DCIA 11%
Floridan Well Site Identification No. 17652
Confining Unit K (ft/day) 0.0155
Floridan Leakance day-1 4×10⁻⁴
Surficial K(ft/day) 20
Surficial Aquifer Gradient (Up-gradient) 0.0002
Surficial Aquifer Gradient (Down-Gradient) 0.0014
Approximate Intermediate Layer Thickness (ft) 35
Culvert 1 Elevation (ft, NGVD 29) 131.2
Culvert 1 Outflow K (ft/day) N/A
Culvert 2a Elevation (ft. NGVD 29) 129.73
Culvert 2a Outflow K (ft/day) 0.0014±0.0003
Culvert 2b Elevation (ft, NGVD 29) 131.0
Culvert 2b Outflow K (ft/day) 0.0003±1
Culvert 3 Elevation (ft, NGVD 29) 131.0
Culvert 3 Outflow K (ft/day) N/A
The amount of water removed from the Floridan to zero out pumping effects was 4.2 feet,
and 0.44 feet from the surficial. The effects from pumping were evaluated through the East
Central Florida Transient (ECFT) numerical groundwater model (Barcelo 2016).
RESULTS
After balancing the components, parameters, and applying all data, the lake showed to be
influenced the most by rainfall and evapotranspiration (Table 4 and Figure 13), where rainfall
made up almost 64% of the input to the lake and evapotranspiration made up 75% of water
leaving the lake. The surficial aquifer contributed less than 1% entering the lake and 0.4±0.1%
leaving the lake. While the Floridan did not contribute to the inflow to the lake, it contributed
almost 22% to the lake’s outflow into the aquifer. The culverts only conveyed water during
periods of high lake level, though still contributed 2.5% to the total outflow of the lake. These
values apply to the lake itself and do not incorporate the entire watershed.
22. Table 4: Water Balance Table showing the amount of water entering andleaving the lake in inches per year (in/yr)
and what percentage contributes to the total inflow and outflow. The total is based off of the lake area and not the
entire watershedarea.
Inflow Rainfall
Upper-
Gradient
Surficial
In
Down-
Gradient
Surficial
In
Floridan
Aquifer Runoff
DCIA
Runoff
Channel
Inflow Total
In/year 48.3 0.6 0.1 0 16.1 10.7 0 75.9
% 63.7 0.8 0.1 0 21.2 14.1 0 100
Outflow ET
Upper-
Gradient
Surficial
Out
Down-
Gradient
Surficial
Out
Floridan
Aquifer
Channel
Outflow Total
In/year 58.2 0.0 0.4 16.7 2.0 77.3
% 75.3 0.0 0.5 21.7 2.5 100
-
Figure 13: Graphical representation of the Water Balance table showing that majority of the water that is entering and
leaving the lake is influenced by precipitation (99%) and evapotranspiration (75%).
The percentiles of the model were close to the actual lake level data, where the difference
between the P10 model and real data was 0.3 feet, and the difference for the P90 was 0.1 feet.
The P50 model and real data were equal (see Table 5 and Figure 14). This shows that the
elevation of the model is above 127.6 feet NGVD 29, 90% of the time, is above 129.0 feet
NGVD 29, half of the time, and above 130.5 feet NGVD 29, 10% of the time.
Rain
63.7%
Surficial
1.0%
Runoff
21.2%
DCIA
14.1%
Inflow (75.9 in/yr)
ET
75.3%
Surficial
0.5%
Floridan
21.7%
Channel
2.6%
Outflow (77.3 in/yr)
23. Table 5: Comparison of the P10, P50, and P90 of the data and the model. Little to no difference is seen between the
P50 and the P90, while there is a 0.3 difference in the P10.
Percentiles Data (ft) Model (ft)
P10 130.8 130.5
P50 129.0 129.0
P90 127.7 127.6
Figure 14: The Lake Lowery calibration comparing the actual lake level data (green) to that of the predicted model
data (red). The P90 and the P50 are relatively close while there is a 0.3 difference in the P10, most likely due to the
non-conformedpattern past late 2013.
The fluxes of the resulting calibration came to be 7037 ft3/day entering from the surficial
and 2870 ft3/day leaving through the surficial. When the 4.2 feet of estimated drawdown by the
ECFT numerical model was returned to the Floridan aquifer, the lake, in the model, responded
by rebounding by 0.8 feet. Additionally, the 0.44 feet returned to the surficial rebounded the lake
by 0.05 feet (Figure 15).
125
126
127
128
129
130
131
132
LakeElevationfeet,NGVD29
Calibration Model
Lowery Lake Level
Prediction Lake
Level
24. Figure 15: Lake Lowery calibration comparing actual lake level (green) to the predicted lake level (red) after
groundwater impact was removed. 4.64 feet was restored.
DISCUSSION
The model produces a non-unique solution through extrapolation and interpolation of
available data and reasonable parameters set using hydrologic methods. This solution is non-
unique due to the number of variables that are not known. The only restriction on these unknown
variables is the parameters set on them to ensure that the results are realistic and comparable to
hydrologic methods.
Though the calibration (Figure 14) does not closely correlate to the actual data after
2013, the percentiles and fluxes from the bulk of the model demonstrate that Lake Lowery is
dependent on what happens in the Floridan. The poorly correlated period post 2013 could be the
result of several possible factors such as an error within the parameter set, or an undocumented
alteration to the lake after this time.
Another possibility may be complications associated with the use of a distant Floridan
well that may have been influenced by local conditions that were not similar to the Lake Lowery
area. Evaluation of water use in the lake Lowery area (Figure 16) shows periods of increased
pumping starting in 2004. Local pumping in the area of the Floridan well may have also varied
but in an opposite manner. Pumping variations in the area of the Floridan well were not checked
at the time of this report. Rainfall impact may have been different in the area of the Floridan
well. Another factor to consider is the change of downstream structure operations from the
125
126
127
128
129
130
131
132
133
LakeElevationfeet,NGVD29 Calibration Model (no impact)
Lake Level Predicted Level Linear (Lake Level) Linear (Predicted Level)
25. County to the District in 2014. The District may be operating structures differently which might
have some effect, such as holding the water table to a higher elevation compared to the initial
potentiometric difference. Due to the distance of these structures downstream, the effect is
believed to be small but would warrant further investigation.
Figure 16: Monthly average use of the watershed around Lake Lowery within a 3 mile radius.
Support for an error in parameter setting can come from choice of data used. The Lake
Starr study is being applied, via monthly average, to simulate Lake Lowery’s evapotranspiration.
These lakes differ physically in that Lake Starr sits on a ridge while Lake Lowery sits in a basin.
Though Lake Starr and Lake Lowery are close in depth, Lake Starr is only 134 acres while Lake
Lowery is 1128 acres, effectively giving Lake Lowery a larger fetch size. Though these lakes are
similar in depth and vegetative growth, Lake Lowery’s larger surface area depth ratio may
influence the amount of evapotranspiration coming off the lake.
The surficial gradient of the lake shows that there is a steeper gradient on the southeast
side of the lake (Figure 12), which would suggest an expected observation of less water entering
the lake on the northwest side and more water leaving on the southeast side. However, the
calibration shows the opposite, with more water entering on the northwest side and less leaving
on the southeast side. Without a nearby well, or indication of capture zone influence on the
26. down-gradient side, all that could reasonably be determined or estimated is the hydraulic
conductivity.
The calculation of the amount of water leaking into the Floridan aquifer is based on the
entire surface area of the lake being leaky (Figure 17), when in fact it could be only one part of
the lake which is leaky (Figure 18). Having 16.7 in/year of water leaking into the Floridan from
the lake is reasonable when considering the watershed is putting 5.6 in/year into the Floridan,
which is close to what Bethune and Tai, (1987), estimated in their initial study.
Figure 17: Hydraulic elevations from Ato A’. Interpretation of the data to conceptually show how the parameters are
being consideredand calculated (Arthur, et al. 2008). Land surface is yellow, the water table is the blue dotted line,
the topof the Intermediate layer is red, and the upper-Floridan is blue. The leakance is indicated by the blue box.
-150
-100
-50
0
50
100
150
200
250
0 10000 20000 30000 40000 50000 60000 70000 80000 90000
Elevationfeet,NGVD29
Distance, feet
Cross-SectionalArea, Lake Lowery A-A'
Lake Lowery
Surficial
Intermediate
Upper-Floridan
Water Table
A
A'
Leakage to the
Floridan
27. Figure 18: Hydraulic elevations from Ato A’. Interpretation of the data to conceptually show how the parameters are
being consideredand how they should be calculated (Arthur, et al. 2008). Land surface is yellow, the water table
(inferred) is the blue dotted line, the top of the Intermediate layer is red, and the upper-Floridan is blue. The
leakance is indicatedby the blue box.
CONCLUSION
The water budget model is a reasonable tool for use in predicting lake behavior when
hydraulic possibilities are taken into account given the geology in the region. It takes into
account the existence of multiple unknown variables and can aid in coming up with a solution
that is realistic when applying hydrologic method. However, it is still data dependent. For a
more accurate solution, more data are needed to be known. Lake Lowery behaves as a flow-
through lake with a moderate recharge connection to the Upper Floridan aquifer. When the
pumping in the Upper Floridan results in approximately 4 feet of drawdown, the lake is
estimated to respond by approximately 1 foot of lowering. With such a relationship, further
analysis and evaluation must be taken to determine how far the lake level can safely drop before
having detrimental effects on the hydrology and ecology of the area.
REFERENCES
Arthur, Jonathan D., et al. Hydrogeologic Frameworkd of the Southwest Florida Water Management
District. Florida Geological Survey Bulletin No. 68. Tallahassee, Florida: Florida
Department of Environmental Protection , 2008.
-150
-100
-50
0
50
100
150
200
250
0 10000 20000 30000 40000 50000 60000 70000 80000 90000
Elevationfeet,NGVD29
Distance, feet
Cross-SectionalArea, Lake Lowery A-A'
Lake Lowery
Surficial
Intermediate
Upper-Floridan
Water Table
A
A'
Leakage to the
Floridan
28. Aucott, Walter R. "Areal Variation in Recharge to and Discharge from the Floridan Aquifer
System in Florida." U.S. Geological Survey, 1988.
Barcelo, Mark, interview by Don Ellison. (2016).
Berryman & Henigar, Inc. Rocky Creek Lake . Enhancement Project, Tampa Bay Water, 2005.
Bethune, Gary, and C. Charles Tai. Lake Lowery Basin; Surface Water Management Study. Technical
Publication SJ 87-5, Devision of Engineering, Department of Water Resources, Palatka,
Florida: St. Johns River Water Managment District, 1987.
Carr, David, Michael Hancock, and Douglas Leeper. "Proposed Minimum and Guidance Levels
for Lake McLeod in Polk County, Florida." Resource Evaluation, Resource Evaluation
Section Water Resource Bureau, Southwest Florida Water Managment District,
Brooksville, Florida, 2015.
Keith & Schnars, P.A. "Plans of Proposed Lake Lowery Structure Modifications." Polk County,
Florida: Polk County Natural Resources Division, 2003.
Kinnaman, Sandra L., and Joann F. Dixon."Scientific Investigations Map 3091." U. S. Geological
Survey, May 2009.
Mockus, Victor. National Engineering Handbook. Vol. Part 630. United States Department of
Agriculture, 1972.
Soil Conservation Service. "Module 104 - Runoff Curve Number Computations." Hydrology
Training Series. United States Department of Agriculture,September 1989.
Swancar, Amy, T. M. Lee, and T. M. O'Hare. "Hydrogeologic Setting, Water Budget, and
Preliminary Analysis of Ground-Water Exchange at Lake Starr, a Seepage Lake in Polk
County, Florida." Water-Resource Investigations Report 00-4030, U.S. Department of
Interior, U. S. Geological Survey, Tallahassee, 2000.
The Florida Legislature. "Chapter 373:Water Resources." Florida Statute:Natural Resources;
Conservation, Reclamation, and Use. Florida, 2015.
USDS. Urban Hydrology for Small Watersheds. Technical Release 55, United States Departmentof
Agriculture, 1986.