1. Starting withR
2. Vectors
3. Factors
4. Gen Seq & Subsetting
5. Matrices & Arrays
6. Lists & Data Frames
7. Functions
Contents
8. Managing Your Sessions
3.
Starting With R
교재
패키지설치
스터디 목적
R& MySQL 설치
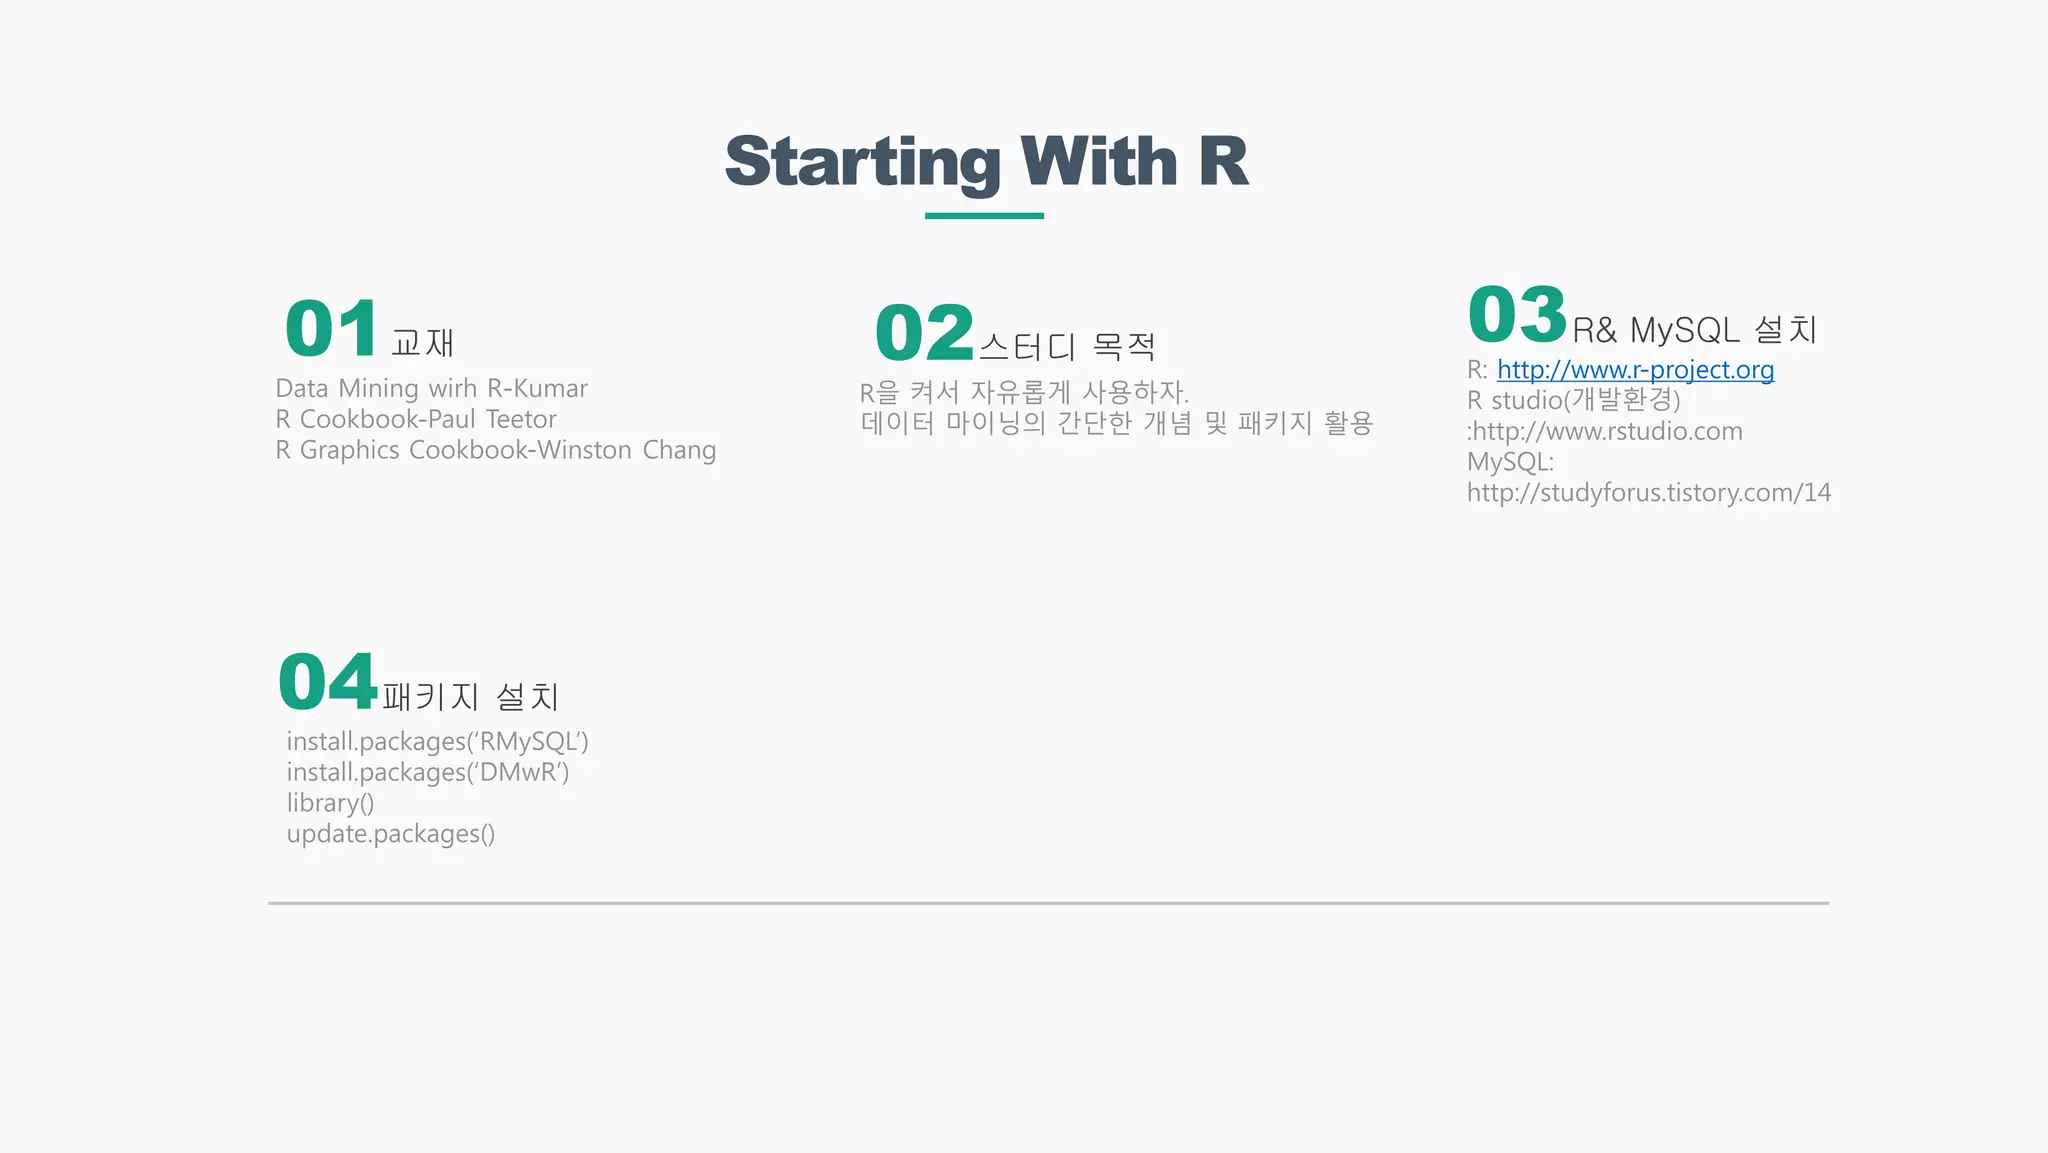
Data Mining wirh R-Kumar
R Cookbook-Paul Teetor
R Graphics Cookbook-Winston Chang
install.packages(‘RMySQL’)
install.packages(‘DMwR’)
library()
update.packages()
R을 켜서 자유롭게 사용하자.
데이터 마이닝의 간단한 개념 및 패키지 활용
R: http://www.r-project.org
R studio(개발환경)
:http://www.rstudio.com
MySQL:
http://studyforus.tistory.com/14
01 02 03
04
4.
Vectors
x<-945 x<-vextor()
Vectorization
v<-c(4,7,23.5)
v<-c(v[5],v[7])
객체에 정보를배정하는 배정문
모든 객체에는 mode(자료형식)과
length(길이)가 존재
mode에는 character, logical, numeric,
complex가 존재
mode() 와 length()로 확인할 수 있다.
NA로만 이루어진 벡터를 생성
가변 길이 벡터로 값을 배정할 때
마다 길이가 바뀐다.
몇몇 함수들은 vector를 input으로
넣으면 각각의 원소에 함수를 적용
하는 vectorization이 가능하다.
x<-sqrt(v) y<-v1+v2
이 때 두 벡터의 길이가 맞지 않으
면 recycling rule이 적용된다.
c()함수를 통해 벡터를 생성
한 벡터 안에 다른 mode가 존재하면
type coercion이 발생
NA는 결측치를 의미하는 변수
indexing은 1부터 시작한다.
원래 v에서 5번째와 7번째 원소만
을 추출하여 새로운 v에 저장
즉, 새로운 v의 length는 2
01 02 03
04 05
5.
Factors
Factor other.g<-factor(c(), levels=c())
margin.table(t,1)
g<-factor(g)
t<-table(g)
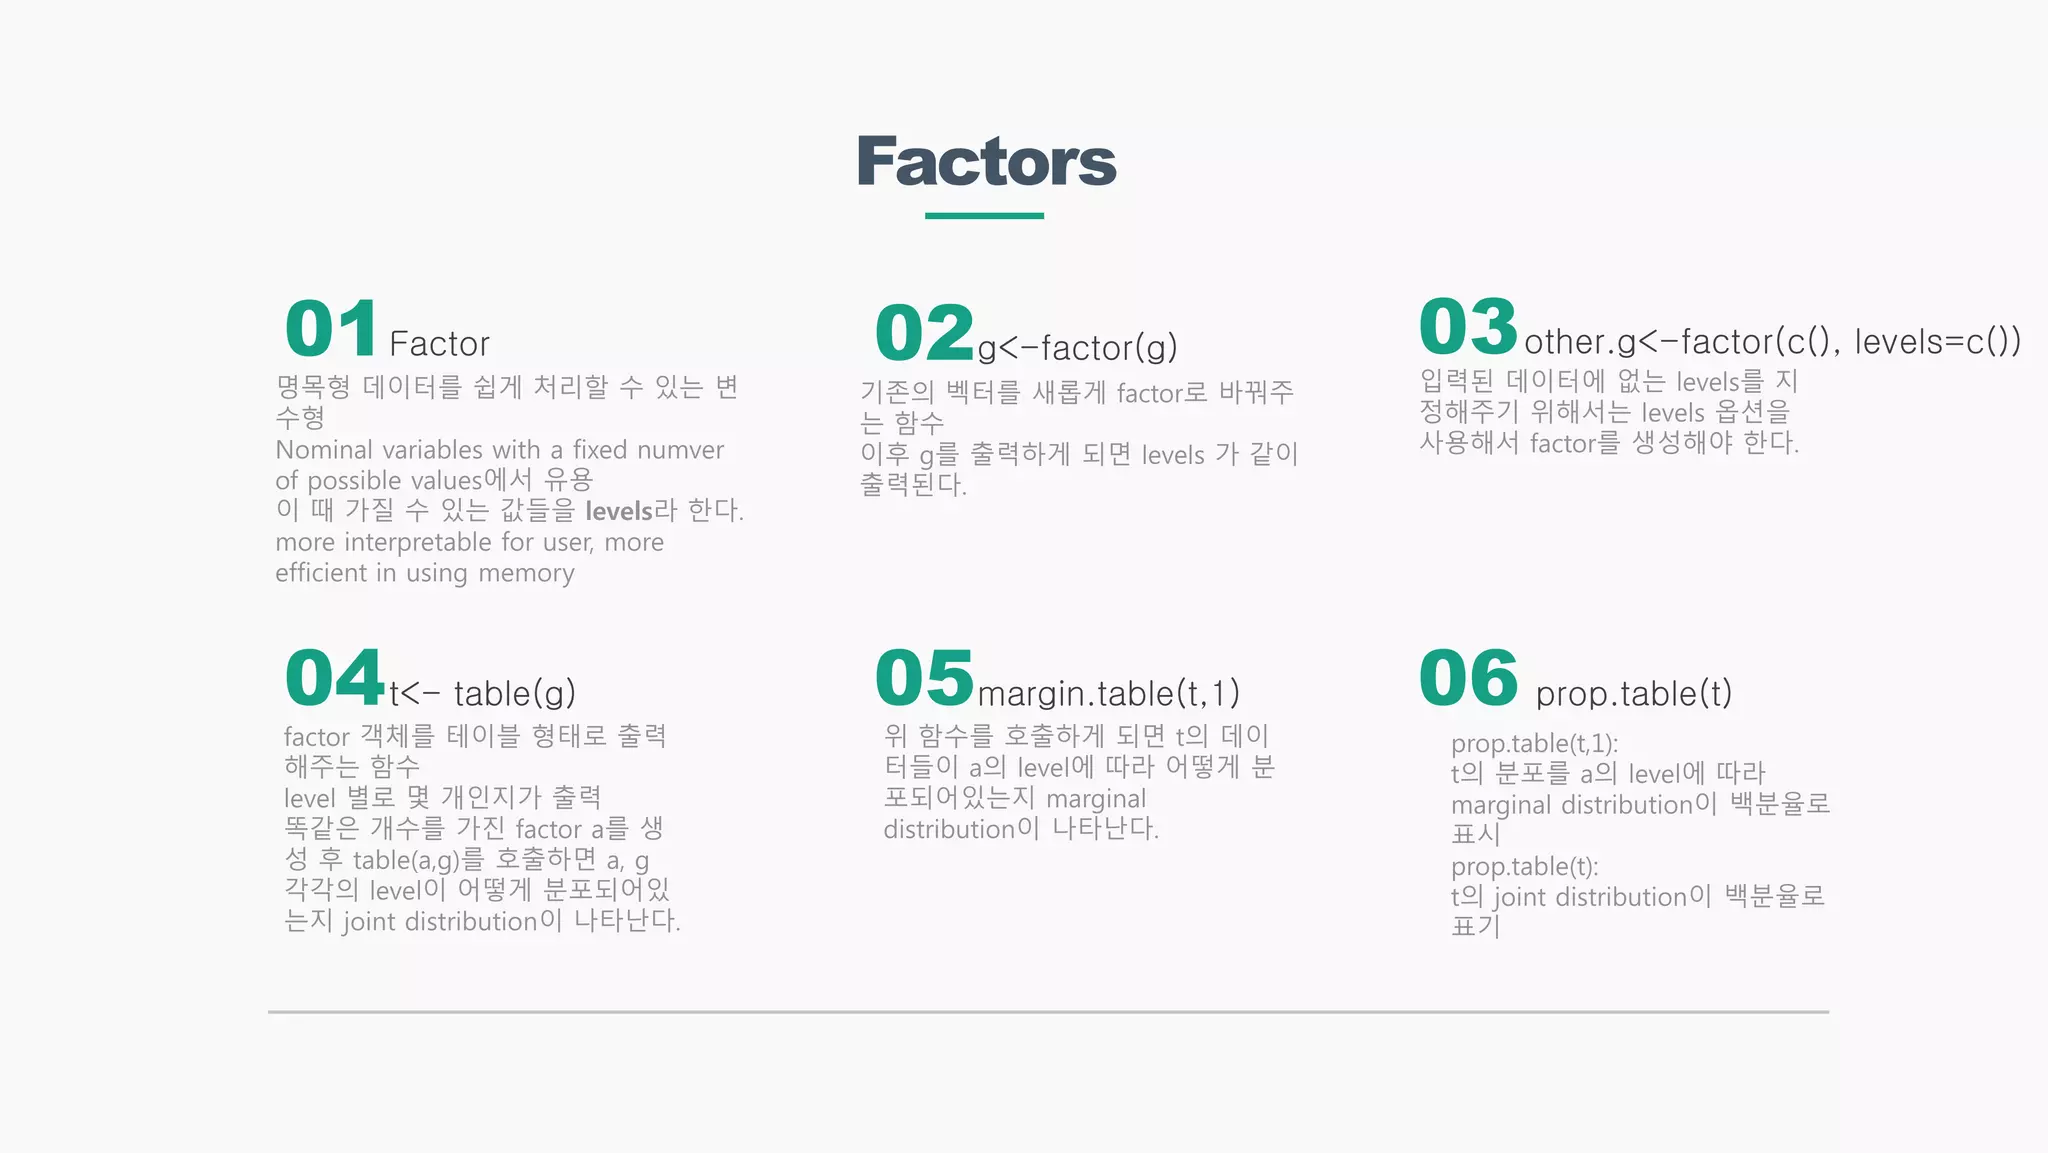
명목형 데이터를 쉽게 처리할 수 있는 변
수형
Nominal variables with a fixed numver
of possible values에서 유용
이 때 가질 수 있는 값들을 levels라 한다.
more interpretable for user, more
efficient in using memory
입력된 데이터에 없는 levels를 지
정해주기 위해서는 levels 옵션을
사용해서 factor를 생성해야 한다.
위 함수를 호출하게 되면 t의 데이
터들이 a의 level에 따라 어떻게 분
포되어있는지 marginal
distribution이 나타난다.
기존의 벡터를 새롭게 factor로 바꿔주
는 함수
이후 g를 출력하게 되면 levels 가 같이
출력된다.
factor 객체를 테이블 형태로 출력
해주는 함수
level 별로 몇 개인지가 출력
똑같은 개수를 가진 factor a를 생
성 후 table(a,g)를 호출하면 a, g
각각의 level이 어떻게 분포되어있
는지 joint distribution이 나타난다.
01 02 03
04 05 06 prop.table(t)
prop.table(t,1):
t의 분포를 a의 level에 따라
marginal distribution이 백분율로
표시
prop.table(t):
t의 joint distribution이 백분율로
표기
6.
Gen Seq &Subsetting
x<-1:1000 x<-rep(5, 10)
x<-rfunc(n, par1, …)
x<-seq(-4, 1,
0.5)
x<-gl(3, 5)
x에 1부터 1000까지 모든 정수가 순서대
로 있는 벡터를 배정
10:15 -1 : 9부터 14까지
10:(15-1) : 10부터 14까지
5:0 : 5부터 0까지(거꾸로)
5가 10번 반복되는 수열을 생성
rep(“hi”, 3)
원소: “hi”, 3번 반복
rep(1:2, 3)
원소: 1 2 , 3번 반복 (1 2 1 2 1 2 )
rep(1:2, each=3)
원소: 1 2 , 각자 3번 반복( 1 1 1 2 2 2 )
func에 해당하는 확률 분포에서 샘
플을 랜덤 추출 함.
rnorm(10): 표준정규분포에서 10
개의 샘플을 추출
rt(5, df=10): 자유도 10인 t분포에
서 5개의 샘플을 추출
-4부터 1까지 공차가 0.5인 등차수열을
생성
-4: 시작, 1: 끝, 0.5: 공차
seq(from=1, to=5, length=4)
: 시작:1, 끝:5, 수열의 길이:4
seq(length=10, from=-2, by=0.2)
: 시작:-2, 끝:0.2, 수열의 길이:10
3개의 level를 가진 factor를 생성
하여 각각 5번씩 반복
(1 1 1 1 1 2 2 2 2 2 3 3 3 3 3)
gl(2, 5, labels=c(“female”, “male”))
2개의 level를 가진 5번씩 반복하
는 factor를 생성 후, 각각의 level
에 이름을 붙여줌
01 02 03
04 05 06 Subsetting
벡터에서 내가 원하는 원소만을 추
출할 때 사용
x[x>0]: 벡터 x에서 0보다 큰 원소
만을 모아 벡터 생성
x[y]: x에서 y값을 인덱스로 하는
원소만 모아 벡터 생성
&: 논리곱
| (shift ): 논리합
x[-1]: x벡터에서 첫번째 원소 제외
names(x)로 x벡터에 숫자가 아닌
mode로도 indexing도 가능
7.
Matrices & Arrays
Matrixrbind(), cbind()
Array
행렬의 indexing
colname(), rownames()
2차원(row, column)으로 이루어진 Array.
벡터에 dim() 함수를 적용해서 생성할 수
있다.
dim(x) <- c(2,5)
:2행 5열 행렬을 생성
m<-matrix(c(), 2, 5)
: 벡터를 생성하고 행렬을 생성할 필요없
이 한번에 행렬을 생성(효율적임)
m<-matrix(c(),2,5, byrow=T)
: 행렬을 열부터 채운다.
cbind(x, y)
:벡터 x와 y를 각각 열벡터로 갖는 행렬을 생성
rbind(x, y)
:벡터 x와 y를 각각 행벡터로 갖는 행렬을 생성
2차원 이상의 행렬을 저장하기 위
해 사용
a <- array(1:24, dim=c(2,3,4) )
: 1부터 24까지의 등차수열 벡터를
만든 뒤, 이것을 2 3 4 차원을 갖는
array로 만든다.
Recycling rule과 계산 방식은
vector와 동일하게 적용된다.
m[2 ,3]
: m행렬의 2행 3열 원소를 추출
m[-2, 1]
:m행렬에 1열 중에서 2행 원소를 제외
하고 추출(벡터 형식으로)
m[1, ]
:m행렬의 1행 추출(벡터 형식으로)
m[1, , drop=F]
:m행렬의 1행을 행렬 형식으로 추출
행렬의 행과 열에 대해 벡터에서
names()와 동일한 기능을 제공
names를 설정한 뒤에는 names로
호출할 수 있다.
01 02 03
04 05
8.
Lists & DataFrames
Lists component 관리
Data Frame의 indexing
List의 indexing
Data Frames
R에서의 list는 component라고 하는 순
서가 있는 객체들의 집합이다.
각각의 component는 이름이 있으며
mode와 length가 같을 필요가 없다.
my.lst <- list(stud.id = 34453,
stud.name = “John”,
stud.marks =c(14.3, 12, 15))
names(my.lst) <- c(“id”, “name”, “marks”)
: component의 이름을 바꿈
my.lst$parents.name <-c(“Ana”, “Mike”)
: 새로운 component를 추가
length(my.lst)
:component 개수
my.lst <- my.lst[-5]
:5번째 component 삭제
other<- list(age= 19, sex= male)
lst <- c(my.lst, other)
: my.lst와 other를 합쳐서 새로운 list 생성
my.dataset$pH
: component의 이름으로 접근
my.dataset[my.dataset$pH >7, ]
: 주어진 조건을 만족하는 모든 데
이터 행을 출력
my.dataset[my.dataset$site ==“A”,
“pH”]
: 주어진 조건을 만족하는 모든 데
이터의 pH를 출력한다.
my.lst[[1]]
: 첫번째 componenet의 내용(내용의
형식을 따라감)
my.lst[1]
: 첫번째 component(list 형식)
my.lst$stud.id
: component의 이름으로 내용을 호출
Matrix와 같이 bi-dimensional이지
만 각 열의 mode가 다를 수 있다.
List의 특별한 예이다.
my.dataset <- data.frame(site=c(),
season=c(), pH=c() )
: 각 열별로 다른 벡터들을 가진다.
이 때 벡터들이 명목 변수일 경우,
R에서 자동으로 Factor로 바꿔준다.
01 02 03
04 05 06 Attach()
attach(my.dataset)
: 이 함수를 호출함으로써
my.dataset에서 indexing을 할 때,
my.dataset$을 반복하지 않아도 된
다.
detach(my.dataset)
:attach한 것을 해제한다.
9.
Lists & DataFrames
subset() my.dataset <- edit(my.dataset)
data()
Data Frame의 수
정
names()
subset(my.dataset, pH > 8)
: 05 에서의 복잡한 indexing을 거치지
않고 바로 주어진 조건을 만족하는 행을
얻을 수 있다. (값을 바꿀수는 없다.)
subset(my.dataset, season ==
“Summer”, season:pH)
:주어진 조건을 만족하는 데이터 행에서
season부터 pH까지만 출력한다.
기존의 Data Frame을 Spreadsheet
interface로 출력하여 거기서 수정을 할 수
있게 해준다.
new.data <- edit(data.frame)
:새로운 data frame을 생성하고 마찬가지
로 Spreadsheet interface 환경에서 수정하
게 해준다.
R에 built-in되어있는 data set들의
목록을 출력해준다.
data(USArrests)
:R에 built-in되어있는 USArrests의
data set을 불러온다.
my.dataset[‘condition’, ‘pH’] <-
my.dataset[‘condition’, ‘pH’] +1
: 주어진 조건을 만족하는 행들의 pH
값을 1올린다.
my.dataset$NO3 <- c()
: my.dataset의 오른쪽에 새로운 벡터를
열벡터로 갖는 component를 추가한다.
다른 mode에서와 마찬가지로 해
당 component의 이름을 바꾸는
기능을 수행한다.
names(my.dataset) <- c()
names(my.dataset)[4] <- “PO4”
07 08 09
10 11
10.
Functions
Functions 함수를 만드는방법(2)
if()
함수를 만드는 방법(1)
parameter 설정
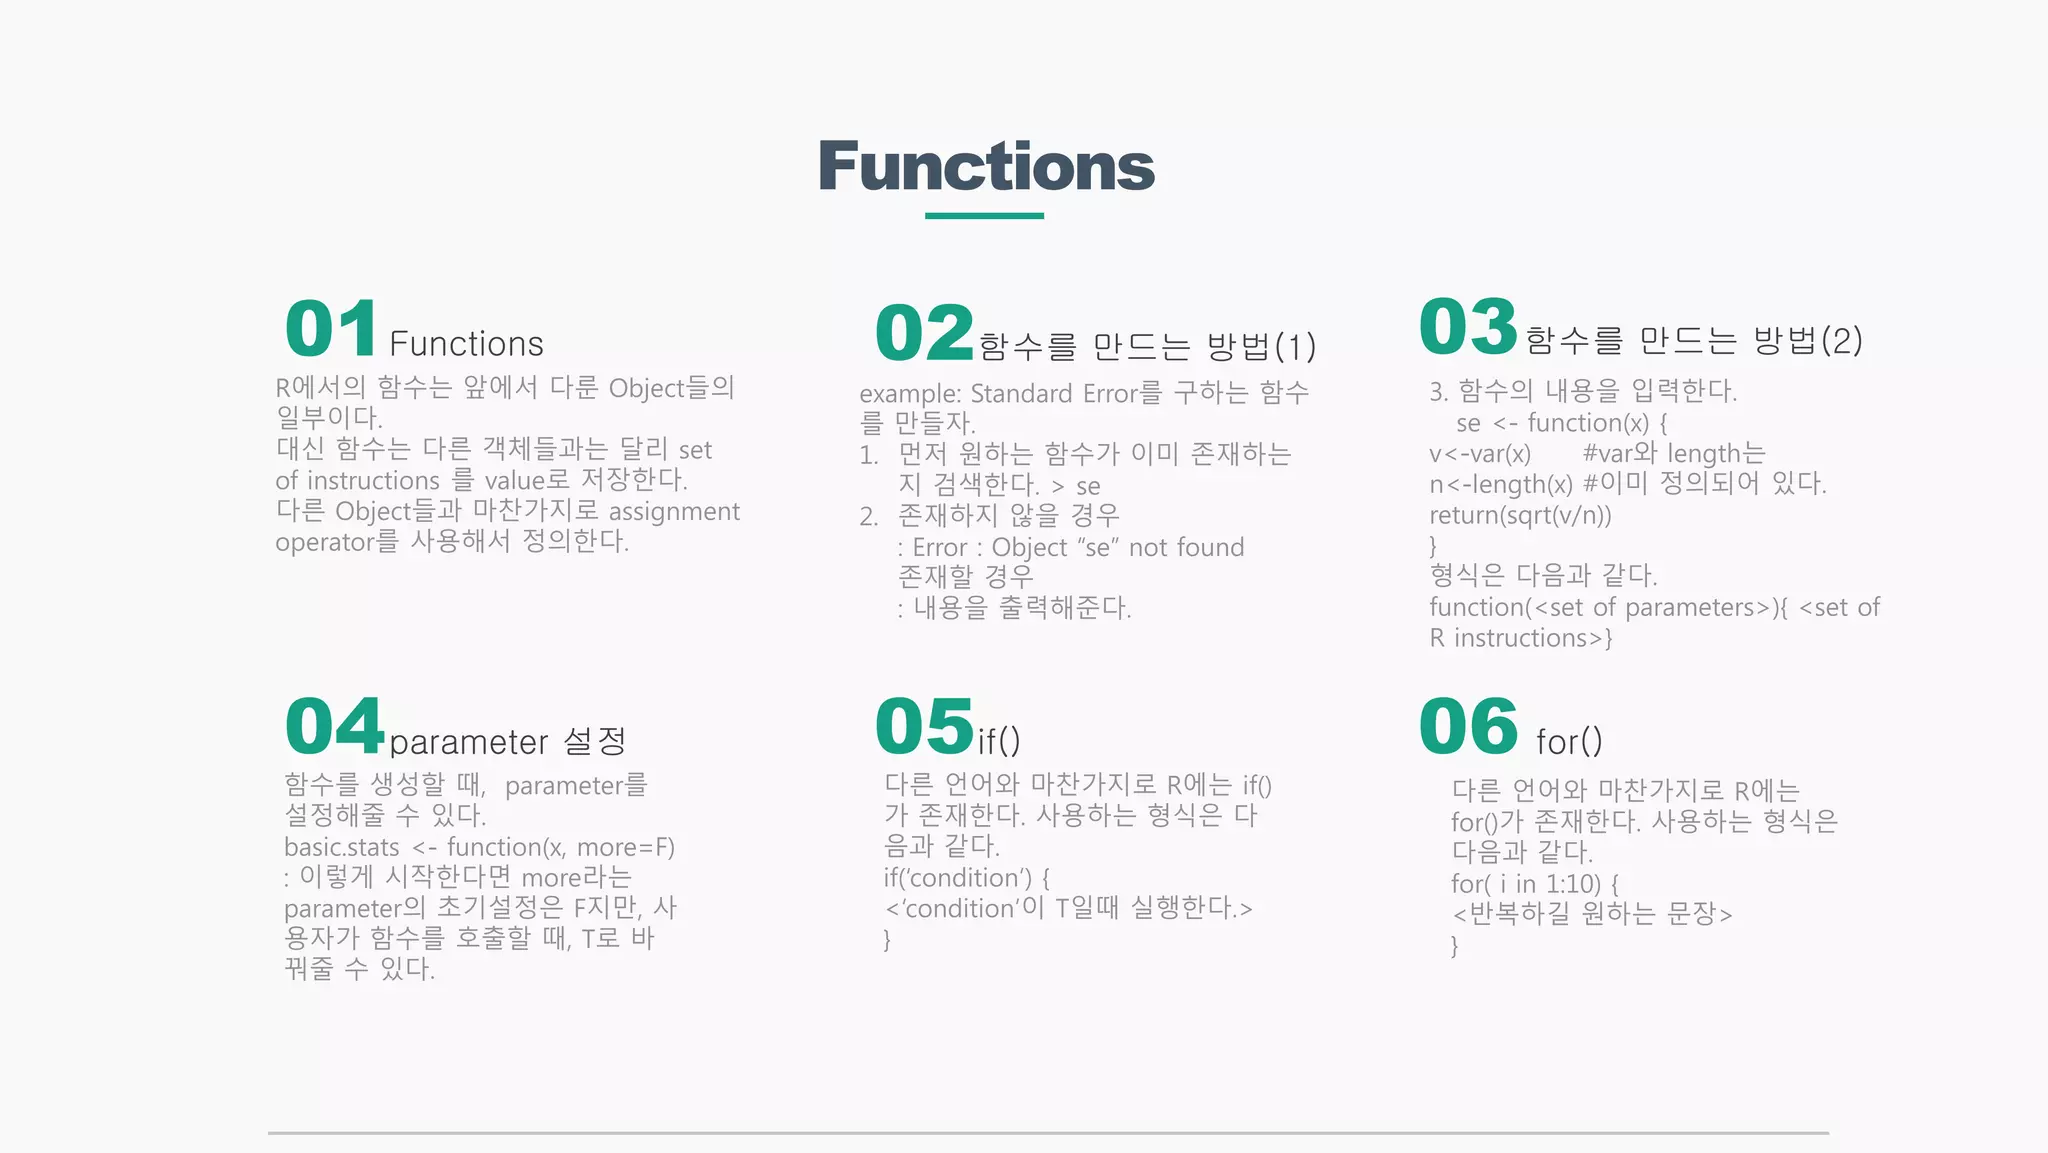
R에서의 함수는 앞에서 다룬 Object들의
일부이다.
대신 함수는 다른 객체들과는 달리 set
of instructions 를 value로 저장한다.
다른 Object들과 마찬가지로 assignment
operator를 사용해서 정의한다.
다른 언어와 마찬가지로 R에는 if()
가 존재한다. 사용하는 형식은 다
음과 같다.
if(‘condition’) {
<‘condition’이 T일때 실행한다.>
}
example: Standard Error를 구하는 함수
를 만들자.
1. 먼저 원하는 함수가 이미 존재하는
지 검색한다. > se
2. 존재하지 않을 경우
: Error : Object “se” not found
존재할 경우
: 내용을 출력해준다.
함수를 생성할 때, parameter를
설정해줄 수 있다.
basic.stats <- function(x, more=F)
: 이렇게 시작한다면 more라는
parameter의 초기설정은 F지만, 사
용자가 함수를 호출할 때, T로 바
꿔줄 수 있다.
01 02 03
04 05 06 for()
다른 언어와 마찬가지로 R에는
for()가 존재한다. 사용하는 형식은
다음과 같다.
for( i in 1:10) {
<반복하길 원하는 문장>
}
3. 함수의 내용을 입력한다.
se <- function(x) {
v<-var(x) #var와 length는
n<-length(x) #이미 정의되어 있다.
return(sqrt(v/n))
}
형식은 다음과 같다.
function(<set of parameters>){ <set of
R instructions>}
11.
Managing Your
Sessions
코드가 길어진다?객체를 저장하자!저장된 소스코드를 실행하
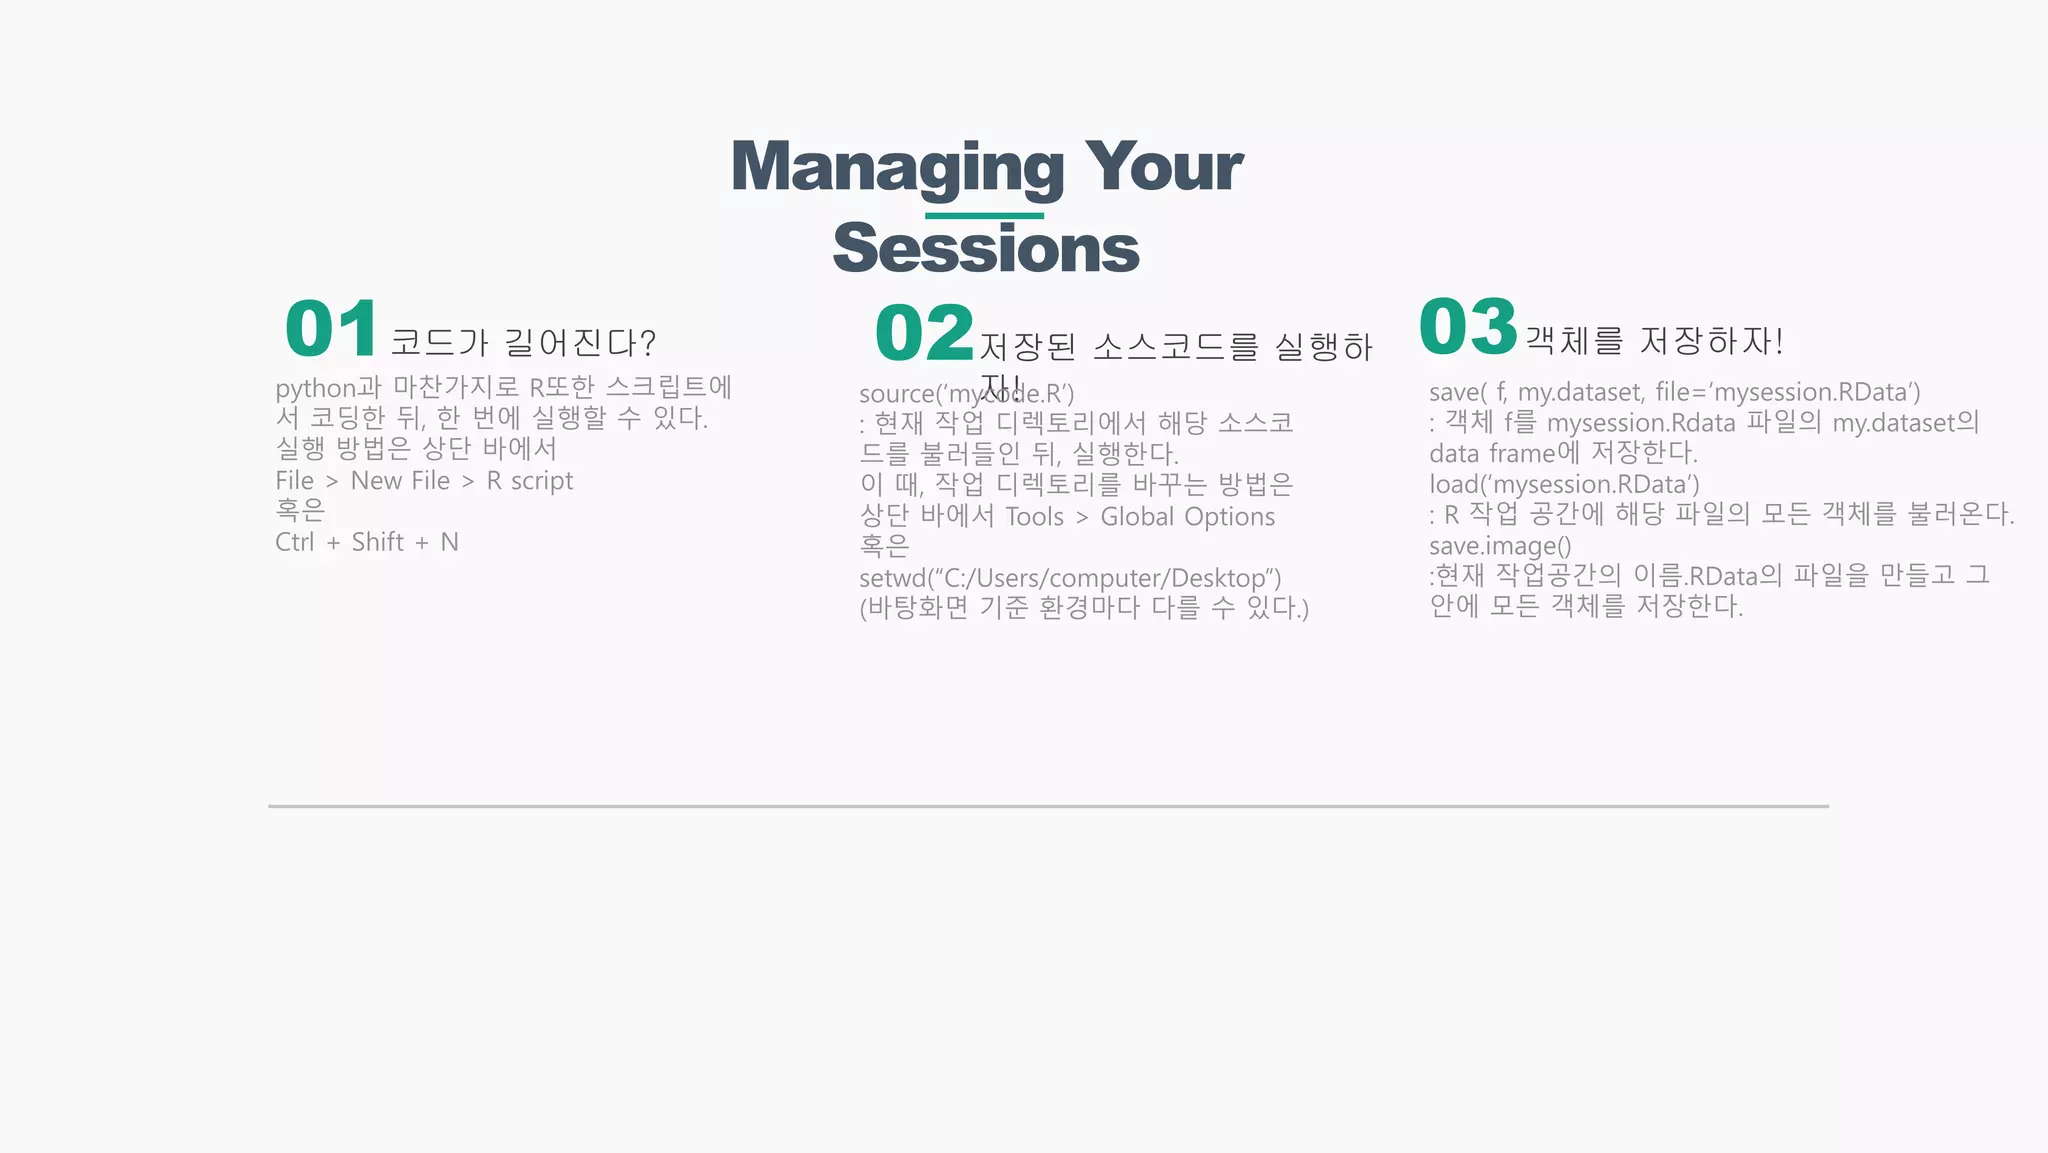
자!python과 마찬가지로 R또한 스크립트에
서 코딩한 뒤, 한 번에 실행할 수 있다.
실행 방법은 상단 바에서
File > New File > R script
혹은
Ctrl + Shift + N
source(‘mycode.R’)
: 현재 작업 디렉토리에서 해당 소스코
드를 불러들인 뒤, 실행한다.
이 때, 작업 디렉토리를 바꾸는 방법은
상단 바에서 Tools > Global Options
혹은
setwd(“C:/Users/computer/Desktop”)
(바탕화면 기준 환경마다 다를 수 있다.)
01 02 03
save( f, my.dataset, file=‘mysession.RData’)
: 객체 f를 mysession.Rdata 파일의 my.dataset의
data frame에 저장한다.
load(‘mysession.RData’)
: R 작업 공간에 해당 파일의 모든 객체를 불러온다.
save.image()
:현재 작업공간의 이름.RData의 파일을 만들고 그
안에 모든 객체를 저장한다.
![Vectors
x<-945 x<-vextor()
Vectorization
v<-c(4,7,23.5)
v<-c(v[5],v[7])
객체에 정보를 배정하는 배정문
모든 객체에는 mode(자료형식)과
length(길이)가 존재
mode에는 character, logical, numeric,
complex가 존재
mode() 와 length()로 확인할 수 있다.
NA로만 이루어진 벡터를 생성
가변 길이 벡터로 값을 배정할 때
마다 길이가 바뀐다.
몇몇 함수들은 vector를 input으로
넣으면 각각의 원소에 함수를 적용
하는 vectorization이 가능하다.
x<-sqrt(v) y<-v1+v2
이 때 두 벡터의 길이가 맞지 않으
면 recycling rule이 적용된다.
c()함수를 통해 벡터를 생성
한 벡터 안에 다른 mode가 존재하면
type coercion이 발생
NA는 결측치를 의미하는 변수
indexing은 1부터 시작한다.
원래 v에서 5번째와 7번째 원소만
을 추출하여 새로운 v에 저장
즉, 새로운 v의 length는 2
01 02 03
04 05](https://image.slidesharecdn.com/ch1ver-150705101754-lva1-app6892/75/Data-Mining-with-R-CH1-4-2048.jpg)
![Gen Seq & Subsetting
x<-1:1000 x<-rep(5, 10)
x<-rfunc(n, par1, …)
x<-seq(-4, 1,
0.5)
x<-gl(3, 5)
x에 1부터 1000까지 모든 정수가 순서대
로 있는 벡터를 배정
10:15 -1 : 9부터 14까지
10:(15-1) : 10부터 14까지
5:0 : 5부터 0까지(거꾸로)
5가 10번 반복되는 수열을 생성
rep(“hi”, 3)
원소: “hi”, 3번 반복
rep(1:2, 3)
원소: 1 2 , 3번 반복 (1 2 1 2 1 2 )
rep(1:2, each=3)
원소: 1 2 , 각자 3번 반복( 1 1 1 2 2 2 )
func에 해당하는 확률 분포에서 샘
플을 랜덤 추출 함.
rnorm(10): 표준정규분포에서 10
개의 샘플을 추출
rt(5, df=10): 자유도 10인 t분포에
서 5개의 샘플을 추출
-4부터 1까지 공차가 0.5인 등차수열을
생성
-4: 시작, 1: 끝, 0.5: 공차
seq(from=1, to=5, length=4)
: 시작:1, 끝:5, 수열의 길이:4
seq(length=10, from=-2, by=0.2)
: 시작:-2, 끝:0.2, 수열의 길이:10
3개의 level를 가진 factor를 생성
하여 각각 5번씩 반복
(1 1 1 1 1 2 2 2 2 2 3 3 3 3 3)
gl(2, 5, labels=c(“female”, “male”))
2개의 level를 가진 5번씩 반복하
는 factor를 생성 후, 각각의 level
에 이름을 붙여줌
01 02 03
04 05 06 Subsetting
벡터에서 내가 원하는 원소만을 추
출할 때 사용
x[x>0]: 벡터 x에서 0보다 큰 원소
만을 모아 벡터 생성
x[y]: x에서 y값을 인덱스로 하는
원소만 모아 벡터 생성
&: 논리곱
| (shift ): 논리합
x[-1]: x벡터에서 첫번째 원소 제외
names(x)로 x벡터에 숫자가 아닌
mode로도 indexing도 가능](https://image.slidesharecdn.com/ch1ver-150705101754-lva1-app6892/75/Data-Mining-with-R-CH1-6-2048.jpg)
![Matrices & Arrays
Matrix rbind(), cbind()
Array
행렬의 indexing
colname(), rownames()
2차원(row, column)으로 이루어진 Array.
벡터에 dim() 함수를 적용해서 생성할 수
있다.
dim(x) <- c(2,5)
:2행 5열 행렬을 생성
m<-matrix(c(), 2, 5)
: 벡터를 생성하고 행렬을 생성할 필요없
이 한번에 행렬을 생성(효율적임)
m<-matrix(c(),2,5, byrow=T)
: 행렬을 열부터 채운다.
cbind(x, y)
:벡터 x와 y를 각각 열벡터로 갖는 행렬을 생성
rbind(x, y)
:벡터 x와 y를 각각 행벡터로 갖는 행렬을 생성
2차원 이상의 행렬을 저장하기 위
해 사용
a <- array(1:24, dim=c(2,3,4) )
: 1부터 24까지의 등차수열 벡터를
만든 뒤, 이것을 2 3 4 차원을 갖는
array로 만든다.
Recycling rule과 계산 방식은
vector와 동일하게 적용된다.
m[2 ,3]
: m행렬의 2행 3열 원소를 추출
m[-2, 1]
:m행렬에 1열 중에서 2행 원소를 제외
하고 추출(벡터 형식으로)
m[1, ]
:m행렬의 1행 추출(벡터 형식으로)
m[1, , drop=F]
:m행렬의 1행을 행렬 형식으로 추출
행렬의 행과 열에 대해 벡터에서
names()와 동일한 기능을 제공
names를 설정한 뒤에는 names로
호출할 수 있다.
01 02 03
04 05](https://image.slidesharecdn.com/ch1ver-150705101754-lva1-app6892/75/Data-Mining-with-R-CH1-7-2048.jpg)
![Lists & Data Frames
Lists component 관리
Data Frame의 indexing
List의 indexing
Data Frames
R에서의 list는 component라고 하는 순
서가 있는 객체들의 집합이다.
각각의 component는 이름이 있으며
mode와 length가 같을 필요가 없다.
my.lst <- list(stud.id = 34453,
stud.name = “John”,
stud.marks =c(14.3, 12, 15))
names(my.lst) <- c(“id”, “name”, “marks”)
: component의 이름을 바꿈
my.lst$parents.name <-c(“Ana”, “Mike”)
: 새로운 component를 추가
length(my.lst)
:component 개수
my.lst <- my.lst[-5]
:5번째 component 삭제
other<- list(age= 19, sex= male)
lst <- c(my.lst, other)
: my.lst와 other를 합쳐서 새로운 list 생성
my.dataset$pH
: component의 이름으로 접근
my.dataset[my.dataset$pH >7, ]
: 주어진 조건을 만족하는 모든 데
이터 행을 출력
my.dataset[my.dataset$site ==“A”,
“pH”]
: 주어진 조건을 만족하는 모든 데
이터의 pH를 출력한다.
my.lst[[1]]
: 첫번째 componenet의 내용(내용의
형식을 따라감)
my.lst[1]
: 첫번째 component(list 형식)
my.lst$stud.id
: component의 이름으로 내용을 호출
Matrix와 같이 bi-dimensional이지
만 각 열의 mode가 다를 수 있다.
List의 특별한 예이다.
my.dataset <- data.frame(site=c(),
season=c(), pH=c() )
: 각 열별로 다른 벡터들을 가진다.
이 때 벡터들이 명목 변수일 경우,
R에서 자동으로 Factor로 바꿔준다.
01 02 03
04 05 06 Attach()
attach(my.dataset)
: 이 함수를 호출함으로써
my.dataset에서 indexing을 할 때,
my.dataset$을 반복하지 않아도 된
다.
detach(my.dataset)
:attach한 것을 해제한다.](https://image.slidesharecdn.com/ch1ver-150705101754-lva1-app6892/75/Data-Mining-with-R-CH1-8-2048.jpg)
![Lists & Data Frames
subset() my.dataset <- edit(my.dataset)
data()
Data Frame의 수
정
names()
subset(my.dataset, pH > 8)
: 05 에서의 복잡한 indexing을 거치지
않고 바로 주어진 조건을 만족하는 행을
얻을 수 있다. (값을 바꿀수는 없다.)
subset(my.dataset, season ==
“Summer”, season:pH)
:주어진 조건을 만족하는 데이터 행에서
season부터 pH까지만 출력한다.
기존의 Data Frame을 Spreadsheet
interface로 출력하여 거기서 수정을 할 수
있게 해준다.
new.data <- edit(data.frame)
:새로운 data frame을 생성하고 마찬가지
로 Spreadsheet interface 환경에서 수정하
게 해준다.
R에 built-in되어있는 data set들의
목록을 출력해준다.
data(USArrests)
:R에 built-in되어있는 USArrests의
data set을 불러온다.
my.dataset[‘condition’, ‘pH’] <-
my.dataset[‘condition’, ‘pH’] +1
: 주어진 조건을 만족하는 행들의 pH
값을 1올린다.
my.dataset$NO3 <- c()
: my.dataset의 오른쪽에 새로운 벡터를
열벡터로 갖는 component를 추가한다.
다른 mode에서와 마찬가지로 해
당 component의 이름을 바꾸는
기능을 수행한다.
names(my.dataset) <- c()
names(my.dataset)[4] <- “PO4”
07 08 09
10 11](https://image.slidesharecdn.com/ch1ver-150705101754-lva1-app6892/75/Data-Mining-with-R-CH1-9-2048.jpg)


![[Swift] Data Structure - Binary Search Tree](https://cdn.slidesharecdn.com/ss_thumbnails/swiftdatastructure-binarysearchtree-200603091904-thumbnail.jpg?width=640&height=640&fit=bounds)


![[2014년 3월 25일] mining minds 빅 데이터, 욕망을 읽다](https://cdn.slidesharecdn.com/ss_thumbnails/2014325miningminds-150907021459-lva1-app6892-thumbnail.jpg?width=640&height=640&fit=bounds)


![[PyCon KR 2018] 땀내를 줄이는 Data와 Feature 다루기](https://cdn.slidesharecdn.com/ss_thumbnails/pyconkr2018joeunparksweat-180820041651-thumbnail.jpg?width=640&height=640&fit=bounds)


![[Week5] Getting started with R](https://cdn.slidesharecdn.com/ss_thumbnails/week5rprogrammingpdf-150130233806-conversion-gate02-thumbnail.jpg?width=640&height=640&fit=bounds)


