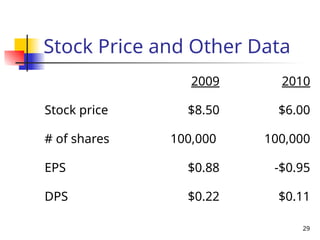
5
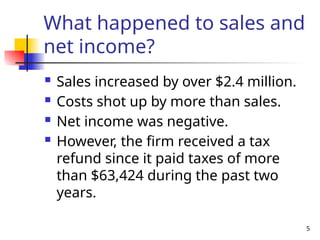
What happened tosales and
net income?
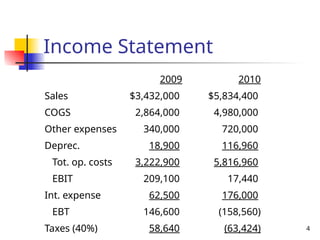
Sales increased by over $2.4 million.
Costs shot up by more than sales.
Net income was negative.
However, the firm received a tax
refund since it paid taxes of more
than $63,424 during the past two
years.
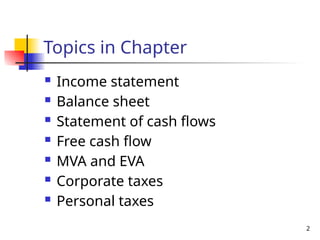
6.
6
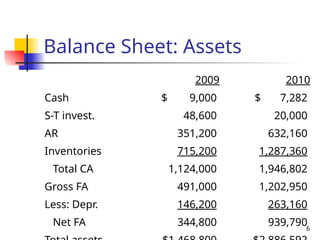
Balance Sheet: Assets
20092010
Cash $ 9,000 $ 7,282
S-T invest. 48,600 20,000
AR 351,200 632,160
Inventories 715,200 1,287,360
Total CA 1,124,000 1,946,802
Gross FA 491,000 1,202,950
Less: Depr. 146,200 263,160
Net FA 344,800 939,790
7.
7
Effect of Expansionon
Assets
Net fixed assets almost tripled in size.
AR and inventory almost doubled.
Cash and short-term investments fell.
9
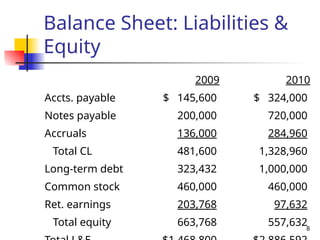
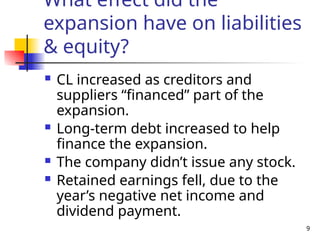
What effect didthe
expansion have on liabilities
& equity?
CL increased as creditors and
suppliers “financed” part of the
expansion.
Long-term debt increased to help
finance the expansion.
The company didn’t issue any stock.
Retained earnings fell, due to the
year’s negative net income and
dividend payment.
10.
10
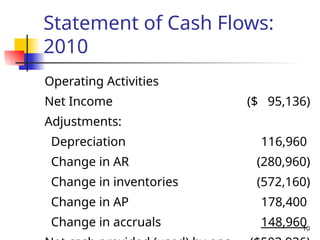
Statement of CashFlows:
2010
Operating Activities
Net Income ($ 95,136)
Adjustments:
Depreciation 116,960
Change in AR (280,960)
Change in inventories (572,160)
Change in AP 178,400
Change in accruals 148,960
11.
11
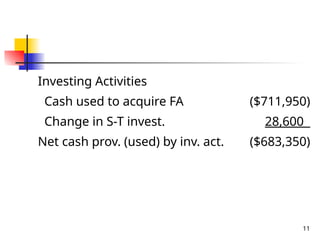
Investing Activities
Cash usedto acquire FA ($711,950)
Change in S-T invest. 28,600
Net cash prov. (used) by inv. act. ($683,350)
12.
12
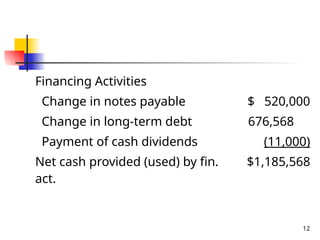
Financing Activities
Change innotes payable $ 520,000
Change in long-term debt 676,568
Payment of cash dividends (11,000)
Net cash provided (used) by fin.
act.
$1,185,568
13.
13
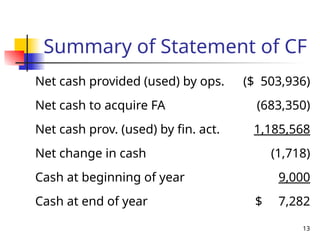
Summary of Statementof CF
Net cash provided (used) by ops. ($ 503,936)
Net cash to acquire FA (683,350)
Net cash prov. (used) by fin. act. 1,185,568
Net change in cash (1,718)
Cash at beginning of year 9,000
Cash at end of year $ 7,282
14.
14
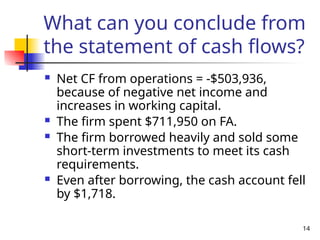
What can youconclude from
the statement of cash flows?
Net CF from operations = -$503,936,
because of negative net income and
increases in working capital.
The firm spent $711,950 on FA.
The firm borrowed heavily and sold some
short-term investments to meet its cash
requirements.
Even after borrowing, the cash account fell
by $1,718.
15.
15
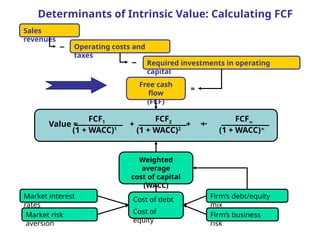
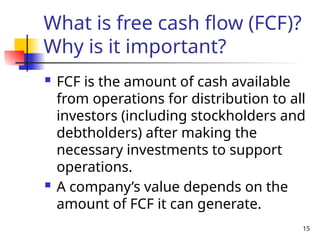
What is freecash flow (FCF)?
Why is it important?
FCF is the amount of cash available
from operations for distribution to all
investors (including stockholders and
debtholders) after making the
necessary investments to support
operations.
A company’s value depends on the
amount of FCF it can generate.
16.
16
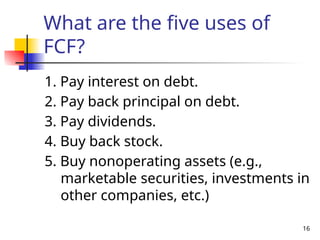
What are thefive uses of
FCF?
1. Pay interest on debt.
2. Pay back principal on debt.
3. Pay dividends.
4. Buy back stock.
5. Buy nonoperating assets (e.g.,
marketable securities, investments in
other companies, etc.)
17.
17
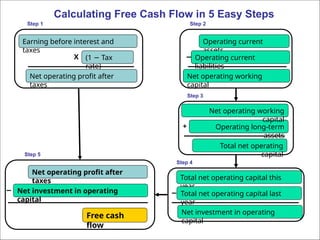
Earning before interestand
taxes
(1 Tax
−
rate)
Net operating profit after
taxes
X
Operating current
assets
Operating current
liabilities
Net operating working
capital
−
Total net operating
capital
Operating long-term
assets
+
Net operating working
capital
Free cash
flow
− Net investment in operating
capital
Net operating profit after
taxes
−
Total net operating capital this
year
Total net operating capital last
year
Net investment in operating
capital
Calculating Free Cash Flow in 5 Easy Steps
Step 1 Step 2
Step 3
Step 4
Step 5
19
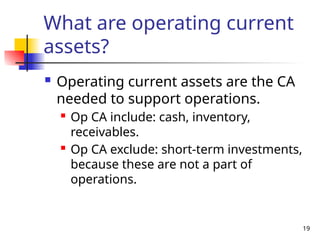
What are operatingcurrent
assets?
Operating current assets are the CA
needed to support operations.
Op CA include: cash, inventory,
receivables.
Op CA exclude: short-term investments,
because these are not a part of
operations.
20.
20
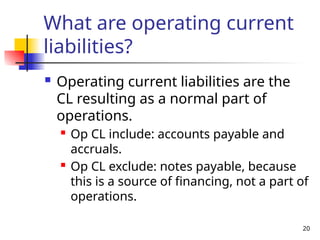
What are operatingcurrent
liabilities?
Operating current liabilities are the
CL resulting as a normal part of
operations.
Op CL include: accounts payable and
accruals.
Op CL exclude: notes payable, because
this is a source of financing, not a part of
operations.
21.
21
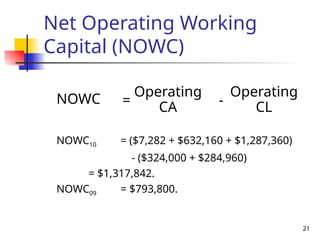
Net Operating Working
Capital(NOWC)
NOWC10 = ($7,282 + $632,160 + $1,287,360)
- ($324,000 + $284,960)
= $1,317,842.
NOWC09 = $793,800.
= -
Operating
CA
Operating
CL
NOWC
22.
22
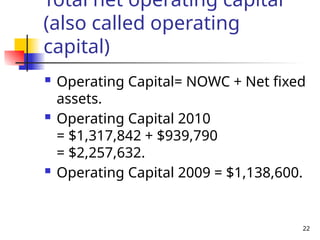
Total net operatingcapital
(also called operating
capital)
Operating Capital= NOWC + Net fixed
assets.
Operating Capital 2010
= $1,317,842 + $939,790
= $2,257,632.
Operating Capital 2009 = $1,138,600.
23.
23
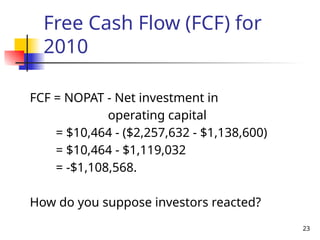
Free Cash Flow(FCF) for
2010
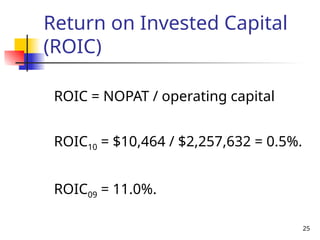
FCF = NOPAT - Net investment in
operating capital
= $10,464 - ($2,257,632 - $1,138,600)
= $10,464 - $1,119,032
= -$1,108,568.
How do you suppose investors reacted?
24.
24
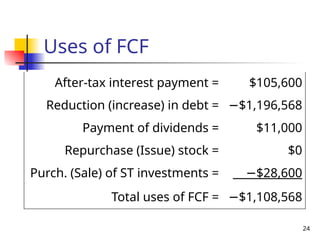
Uses of FCF
After-taxinterest payment = $105,600
Reduction (increase) in debt = −$1,196,568
Payment of dividends = $11,000
Repurchase (Issue) stock = $0
Purch. (Sale) of ST investments = −$28,600
Total uses of FCF = −$1,108,568
26
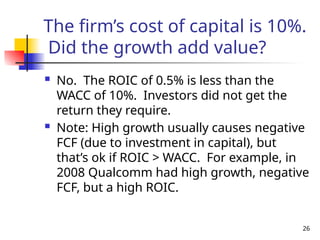
The firm’s costof capital is 10%.
Did the growth add value?
No. The ROIC of 0.5% is less than the
WACC of 10%. Investors did not get the
return they require.
Note: High growth usually causes negative
FCF (due to investment in capital), but
that’s ok if ROIC > WACC. For example, in
2008 Qualcomm had high growth, negative
FCF, but a high ROIC.
27.
27
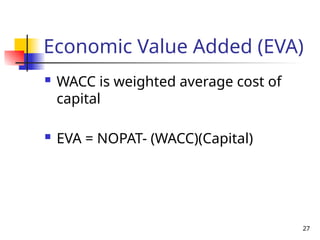
Economic Value Added(EVA)
WACC is weighted average cost of
capital
EVA = NOPAT- (WACC)(Capital)
28.
28
Economic Value Added
(WACC= 10% for both years)
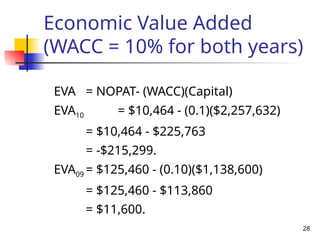
EVA = NOPAT- (WACC)(Capital)
EVA10 = $10,464 - (0.1)($2,257,632)
= $10,464 - $225,763
= -$215,299.
EVA09 = $125,460 - (0.10)($1,138,600)
= $125,460 - $113,860
= $11,600.
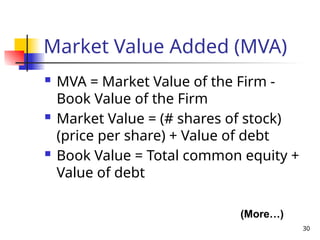
30
Market Value Added(MVA)
MVA = Market Value of the Firm -
Book Value of the Firm
Market Value = (# shares of stock)
(price per share) + Value of debt
Book Value = Total common equity +
Value of debt
(More…)
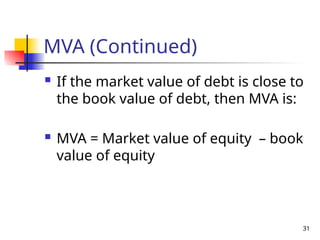
31.
31
MVA (Continued)
Ifthe market value of debt is close to
the book value of debt, then MVA is:
MVA = Market value of equity – book
value of equity
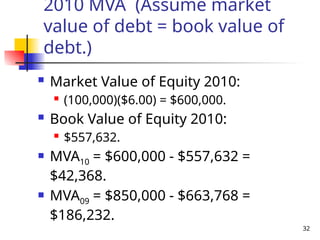
32.
32
2010 MVA (Assumemarket
value of debt = book value of
debt.)
Market Value of Equity 2010:
(100,000)($6.00) = $600,000.
Book Value of Equity 2010:
$557,632.
MVA10 = $600,000 - $557,632 =
$42,368.
MVA09 = $850,000 - $663,768 =
$186,232.
34
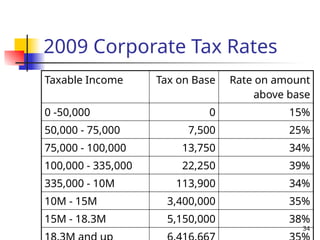
2009 Corporate TaxRates
Taxable Income Tax on Base Rate on amount
above base
0 -50,000 0 15%
50,000 - 75,000 7,500 25%
75,000 - 100,000 13,750 34%
100,000 - 335,000 22,250 39%
335,000 - 10M 113,900 34%
10M - 15M 3,400,000 35%
15M - 18.3M 5,150,000 38%
35.
35
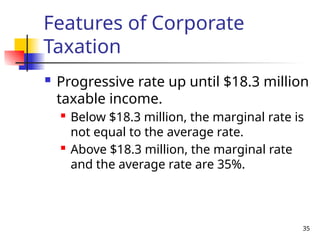
Features of Corporate
Taxation
Progressive rate up until $18.3 million
taxable income.
Below $18.3 million, the marginal rate is
not equal to the average rate.
Above $18.3 million, the marginal rate
and the average rate are 35%.
36.
36
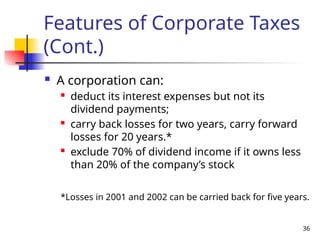
Features of CorporateTaxes
(Cont.)
A corporation can:
deduct its interest expenses but not its
dividend payments;
carry back losses for two years, carry forward
losses for 20 years.*
exclude 70% of dividend income if it owns less
than 20% of the company’s stock
*Losses in 2001 and 2002 can be carried back for five years.
37.
37
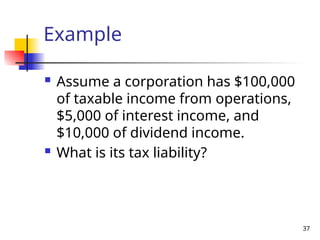
Example
Assume acorporation has $100,000
of taxable income from operations,
$5,000 of interest income, and
$10,000 of dividend income.
What is its tax liability?
38.
38
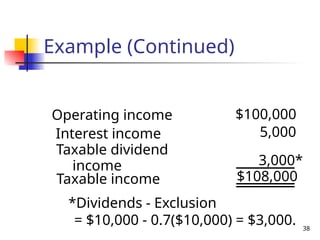
Operating income $100,000
Interestincome 5,000
Taxable dividend
income 3,000*
Taxable income $108,000
*Dividends - Exclusion
= $10,000 - 0.7($10,000) = $3,000.
Example (Continued)
39.
39
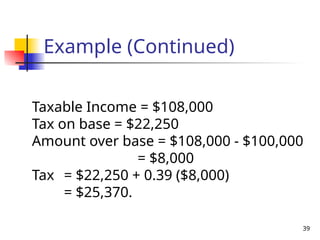
Taxable Income =$108,000
Tax on base = $22,250
Amount over base = $108,000 - $100,000
= $8,000
Tax = $22,250 + 0.39 ($8,000)
= $25,370.
Example (Continued)
40.
40
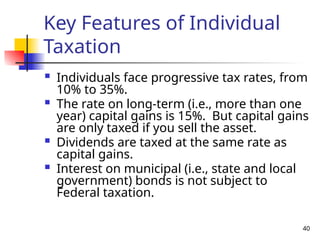
Key Features ofIndividual
Taxation
Individuals face progressive tax rates, from
10% to 35%.
The rate on long-term (i.e., more than one
year) capital gains is 15%. But capital gains
are only taxed if you sell the asset.
Dividends are taxed at the same rate as
capital gains.
Interest on municipal (i.e., state and local
government) bonds is not subject to
Federal taxation.
41.
41
Taxable versus TaxExempt
Bonds
State and local government bonds
(municipals, or “munis”) are generally
exempt from federal taxes.
42.
42
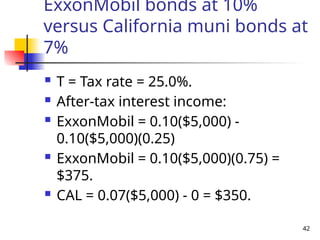
ExxonMobil bonds at10%
versus California muni bonds at
7%
T = Tax rate = 25.0%.
After-tax interest income:
ExxonMobil = 0.10($5,000) -
0.10($5,000)(0.25)
ExxonMobil = 0.10($5,000)(0.75) =
$375.
CAL = 0.07($5,000) - 0 = $350.
43.
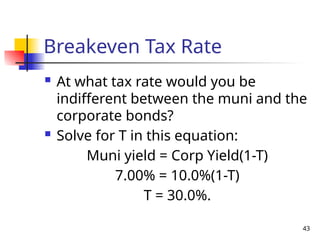
43
Breakeven Tax Rate
At what tax rate would you be
indifferent between the muni and the
corporate bonds?
Solve for T in this equation:
Muni yield = Corp Yield(1-T)
7.00% = 10.0%(1-T)
T = 30.0%.
44.
44
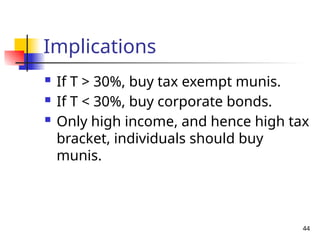
Implications
If T> 30%, buy tax exempt munis.
If T < 30%, buy corporate bonds.
Only high income, and hence high tax
bracket, individuals should buy
munis.