The document provides an overview of key financial statements (balance sheet, income statement, statement of cash flows) and concepts (accounting income vs cash flow, EVA, taxes). It includes examples from a company called D'Leon that recently expanded its operations. The expansion increased D'Leon's sales but resulted in negative net income, cash flow, and EVA in 2002 compared to 2001. D'Leon financed the expansion using external debt.
There are 76 red xxx’s – each worth 1.18 points. You only need to.docxchristalgrieg
There are 76 red xxx’s – each worth 1.18 points. You only need to fill in where you see red xxx’s (big or small)
CHAPTER 1
THE McGEE CAKE COMPANY
1. The advantages to a LLC are: xxxx
The biggest disadvantage is: xxxx
2. .xxxx
C-2 CASE SOLUTIONS
3. .xxxx
CHAPTER 2
CASH FLOWS AND FINANCIAL STATEMENTS
Below are the financial statements that you are asked to prepare.
1. The income statement for each year will look like this:
Income Statement
2010
2011
Sales
xxxx
xxxx
Cost of goods sold
163,849
206,886
Selling and administrative
xxxx
xxxx
Depreciation
46,255
52,282
EBIT
$79,110
$90,584
Interest
10,056
11,526
EBT
$69,054
$79,058
Taxes (use the problem to figure
This amount out
xxxx
xxxx
Net income
$55,243
$63,246
Dividends(read the case to find out how much this is)
xxxx
xxxx
Addition to retained earnings
(this would be whatever the net income is less the dividends paid out)
xxxx
xxxx
2. The balance sheet for each year will be:
Balance Sheet as of Dec. 31, 2010
Cash
xxxx
Accounts payable
xxxx
Accounts receivable
xxxx
Notes payable
xxxx
Inventory
xxxx
Current liabilities
$60,832
Current assets
$72,651
Long-term debt
xxxxx
Net fixed assets
xxxxxx
Owners' equity
xxxxx
Total assets
$276,719
Total liab. and equity
$276,719
In the first year, equity is not given. Therefore, we must calculate equity as a plug variable. Since total liabilities and equity is equal to total assets, equity can be calculated as:
Equity = $276,719 – 60,832 – 103,006
Equity = $112,881
Balance Sheet as of Dec. 31, 2011
Cash
xxxx
Accounts payable
xxxx
Accounts receivable
xxxx
Notes payable
xxxx
Inventory
xxxx
Current liabilities
$68,121
Current assets
$100,834
Long-term debt
xxxx
Net fixed assets
xxxx
Owners' equity
Xxxx(see below)
Total assets
$349,459
Total liab. and equity
$349,459
The owner’s equity for 2011 is the beginning of year owner’s equity, plus the addition to retained earnings, plus the new equity, so:
Equity = $112,881 + 31,623 + 20,500
Equity = $165,004
3-6 are completed for you so you can answer the questions
3. Using the OCF equation: (
OCF = EBIT + Depreciation – Taxes
The OCF for each year is:
OCF2010 = $79,110 + 46,255 – 13,811
OCF2010 = $111,554
OCF2011 = $90,584 + 52,282 – 15,812
OCF2011 = $127,054
4.
To calculate the cash flow from assets, we need to find the capital spending and change in net working capital. The capital spending for the year was:
Capital spending
Ending net fixed assets
$248,625
– Beginning net fixed assets
204,068
+ Depreciation
52,282
Net capital spending
$96,839
And the change in net working capital was:
Change in net working capital
Ending NWC
$32,713
– Beginning NWC
11,819
Change in NWC
$20,894
So, the cash flow from assets was:
Cash flow from assets
Operating cash flow
$127,054
– Net capital spending
96,839
– Change in NWC
...
ChapterTool KitChapter 211/20/18Financial Statements, Cash Flow, and Taxes2-1 Financial Statements and ReportsThe annual report contains a verbal section plus four key statements: the balance sheet, income statement, statement of stockholders' equity, and statement of cash flows.Our spreadsheets use formulas rather than fixed numbers. For example, the cell for Total assets for the most recent year contains the Sum formula rather than just a fixed number. That way, if the data for any inputs (cash, for instance) change, the spreadsheet will automatically recalculate and provide the correct new value for Total assets.In financial modeling, it is helpful to users when input data is grouped together, so you should follow this practice in your own models, too.2-2 The Balance SheetINPUT DATA SECTION: Historical Data Used in the Analysis20192018Tax rate25%25%Weighted average cost of captal (WACC)11.50%11.50%Figure 2-1MicroDrive Inc. December 31 Balance SheetsOlder version in manuscript 4/20(Millions of Dollars)Assets20192018Assets20192018Cash and equivalents$100$110Cash and equivalents$100$102Short-term investments10182Short-term investments1040Accounts receivable500410Accounts receivable500384Inventories1,000830Inventories1,000774Total current assets$1,610$1,532Total current assets$1,610$1,300Net plant and equipment2,0001,780Net property, plant, and equipment (PP&E)2,0001,780Note: Net plant and equipment is equal to cumulative purchases of fixed assets less cumulative depreciation and cumulative disposed assets. Total assets$3,610$3,312Total assets$3,610$3,080Liabilities and EquityLiabilities and EquityAccounts payable$200$190Accounts payable$200$180Notes payable150100Notes payable15028Accruals400370Accruals400370Total current liabilities$750$660Total current liabilities$750$578Long-term bonds520500Long-term bonds520350Total liabilities$1,270$1,160Total liabilities$1,270$928Preferred stock (1,000,000 shares)100100Preferred stock (1,000,000 shares)100100Common stock (50,000,000 shares)500500Common stock (50,000,000 shares)500500Retained earnings1,7401,552Retained earnings1,7401,552Total common equity$2,240$2,052Total common equity$2,240$2,052Total liabilities and equity$3,610$3,312Total liabilities and equity$3,610$3,0802-2 The Income StatementFigure 2-2MicroDrive Income Statements (and Selected Additional Information) for Years Ending December 31(Millions, Except for Per Share Data)20192018Older version in manuscript 4/20Net sales$5,000$4,800Net sales50004680Costs of goods sold except depreciation3,9003,710Costs of goods sold except depreciation$3,900$3,618Depreciation and amortizationa200180Depreciation and amortizationa200180Other operating expenses500470Other operating expenses500470Earnings before interest and taxes (EBIT)$400$440Earnings before interest and taxes (EBIT)400412Less interest 6040Less interest $60$56Pre-tax earnings$340$400Pre-tax earnings340356Taxes85100Taxes$85$89Net Income before preferred dividends$255$300Net Income before ...
Fundamentals of Corporate Finance 9th Edition Ross Test BankAndersonasaa
Fundamentals of CorpoFull download : https://goo.gl/tZHf4G Fundamentals of Corporate Finance 9th Edition Ross Test Bankrate Finance 9th Edition Ross Test Bank
Conversion worksheetGreen shaded cells are from Chapter 5 financia.docxmaxinesmith73660
Conversion worksheetGreen shaded cells are from Chapter 5 financial StatementsEnter all amounts as positive numbers. The worksheet is formatted to add debits to assets & expenses and add credits to revenues, liabilities & equityRefr. Account TitlesDebitsCreditsGov'tal Fund Balances Adjustments & EliminationsGovern-mental Funds AdjustedInternal Service FundsBalances for Gov't-wide StmtsDebitsCreditsDebitsCreditsAtype debit accounts in this columnDEBITS:type credit accounts in this columnCash830,320830,320830,320Cash with Fiscal Agent928,000928,000928,000Investments259,000259,000259,000Taxes Receivable, net274,000274,000274,000Interest Receivable, net16,85016,85016,850Inventories--Due from State Govt.580,000580,000580,000Due from Other Funds--Capital Assets-- both rows--Expenditures (expenses) Current- General Govt.1,646,9001,646,9001,646,900 Public Safety3,026,9003,026,9003,026,900 Highway and Streets2,471,9002,471,9002,471,900 Sanitation591,400591,400591,400 Health724,100724,100724,100 Welfare374,300374,300374,300 Culture and Recreation917,300917,300917,300Compensated Absences Exp--Other Expenditures (expenses)-- - Debt Service Principal800,000800,000800,000 - Interest (expenditure/expense)514,000514,000514,000 both rows - Capital Outlay5,798,1005,798,1005,798,100 - Depreciation--Other Fin. Uses - Transfers Out1,876,7001,876,7001,876,700-Total Debits21,629,77021,629,770CREDITS:Accounts Payable493,400493,400493,400Due to Other Funds40,20040,20040,200Accrued Interest Payable--Bonds Payalbe both rows--Premium on Bonds--Compensated Absence Payable--Advance from Water Utility Fund--Deferred Inflows: Property Taxes27,50027,50027,500Accumulated Depreciation both rows--Revenues-Property Taxes6,657,5006,657,5006,657,500Sales Taxes2,942,0002,942,0002,942,000Interest21,22021,22021,220Licenses & Permits800,000800,000800,000Miscellaneous350,000350,000350,000State Grant for Highway Street Expenses1,072,0001,072,0001,072,000Capital Grant- Gen Gov't332,000332,000332,000Capital Grant- Public Safety1,320,0001,320,0001,320,000----Other Financing Sources--Proceeds of Bonds4,000,0004,000,0004,000,000Premium on Bonds200,000200,000200,000Transfers In1,876,7001,876,7001,876,700Net Position at beginning of year- three rows1,497,2501,497,2501,497,250Total Credits21,629,77021,629,770column totals: debits = credits ??------
CITY OF MONROE
WORKSHEET TO CONVERT GOVERNMENTAL ACTIVITIES TO ACCRUAL BASIS
Stmt of ActivitiesProgram RevenuesNet (Expense) Revenue and Change in Net PositionExpensesCharges for ServicesOperational Grants and ContributionsCapital Grants and ContributionsGovernmental ActivitiesBusiness-Type ActivitiesTotalFunctions/ProgramsGovernmental Activities: General Government$ -$ - Public Safety-- Highways and Streets-- Sanitation-- Health-- Welfare-- Culture and Recreation-- Depreciaiton-- Interest-- Compensated Absneces-- Total Governmental Activities------Business Type Activi.
Analysis of Financial Statements.(Ratio analysis, Du Pont system ,Effects of ...Tanjin Tamanna urmi
Five Categories of Fin. Ratios
Liquidity: Ability to meet current obligations
Asset Mgmt: Proper & effective use of assets
Asset utilization (i.e., Total Asset Turnover Ratio:
TAT = Sales / T. Assets
Debt Mgmt: extent of debt & level of safety afforded creditors
Debt utilization (i.e., Equity Multiplier:
EM = T. Assets / T. Eqty
Profitability: reflects effects of liquidity, asset mgmt, & debt on operating results
Expense Control: Profit Margin:
PM = Net Income / Sales
Market Value: indicators of what investors think of firm’s past results & future prospects
Cracking the Workplace Discipline Code Main.pptxWorkforce Group
Cultivating and maintaining discipline within teams is a critical differentiator for successful organisations.
Forward-thinking leaders and business managers understand the impact that discipline has on organisational success. A disciplined workforce operates with clarity, focus, and a shared understanding of expectations, ultimately driving better results, optimising productivity, and facilitating seamless collaboration.
Although discipline is not a one-size-fits-all approach, it can help create a work environment that encourages personal growth and accountability rather than solely relying on punitive measures.
In this deck, you will learn the significance of workplace discipline for organisational success. You’ll also learn
• Four (4) workplace discipline methods you should consider
• The best and most practical approach to implementing workplace discipline.
• Three (3) key tips to maintain a disciplined workplace.
What are the main advantages of using HR recruiter services.pdfHumanResourceDimensi1
HR recruiter services offer top talents to companies according to their specific needs. They handle all recruitment tasks from job posting to onboarding and help companies concentrate on their business growth. With their expertise and years of experience, they streamline the hiring process and save time and resources for the company.
Unveiling the Secrets How Does Generative AI Work.pdfSam H
At its core, generative artificial intelligence relies on the concept of generative models, which serve as engines that churn out entirely new data resembling their training data. It is like a sculptor who has studied so many forms found in nature and then uses this knowledge to create sculptures from his imagination that have never been seen before anywhere else. If taken to cyberspace, gans work almost the same way.
Premium MEAN Stack Development Solutions for Modern BusinessesSynapseIndia
Stay ahead of the curve with our premium MEAN Stack Development Solutions. Our expert developers utilize MongoDB, Express.js, AngularJS, and Node.js to create modern and responsive web applications. Trust us for cutting-edge solutions that drive your business growth and success.
Know more: https://www.synapseindia.com/technology/mean-stack-development-company.html
RMD24 | Retail media: hoe zet je dit in als je geen AH of Unilever bent? Heid...BBPMedia1
Grote partijen zijn al een tijdje onderweg met retail media. Ondertussen worden in dit domein ook de kansen zichtbaar voor andere spelers in de markt. Maar met die kansen ontstaan ook vragen: Zelf retail media worden of erop adverteren? In welke fase van de funnel past het en hoe integreer je het in een mediaplan? Wat is nu precies het verschil met marketplaces en Programmatic ads? In dit half uur beslechten we de dilemma's en krijg je antwoorden op wanneer het voor jou tijd is om de volgende stap te zetten.
Enterprise Excellence is Inclusive Excellence.pdfKaiNexus
Enterprise excellence and inclusive excellence are closely linked, and real-world challenges have shown that both are essential to the success of any organization. To achieve enterprise excellence, organizations must focus on improving their operations and processes while creating an inclusive environment that engages everyone. In this interactive session, the facilitator will highlight commonly established business practices and how they limit our ability to engage everyone every day. More importantly, though, participants will likely gain increased awareness of what we can do differently to maximize enterprise excellence through deliberate inclusion.
What is Enterprise Excellence?
Enterprise Excellence is a holistic approach that's aimed at achieving world-class performance across all aspects of the organization.
What might I learn?
A way to engage all in creating Inclusive Excellence. Lessons from the US military and their parallels to the story of Harry Potter. How belt systems and CI teams can destroy inclusive practices. How leadership language invites people to the party. There are three things leaders can do to engage everyone every day: maximizing psychological safety to create environments where folks learn, contribute, and challenge the status quo.
Who might benefit? Anyone and everyone leading folks from the shop floor to top floor.
Dr. William Harvey is a seasoned Operations Leader with extensive experience in chemical processing, manufacturing, and operations management. At Michelman, he currently oversees multiple sites, leading teams in strategic planning and coaching/practicing continuous improvement. William is set to start his eighth year of teaching at the University of Cincinnati where he teaches marketing, finance, and management. William holds various certifications in change management, quality, leadership, operational excellence, team building, and DiSC, among others.
India Orthopedic Devices Market: Unlocking Growth Secrets, Trends and Develop...Kumar Satyam
According to TechSci Research report, “India Orthopedic Devices Market -Industry Size, Share, Trends, Competition Forecast & Opportunities, 2030”, the India Orthopedic Devices Market stood at USD 1,280.54 Million in 2024 and is anticipated to grow with a CAGR of 7.84% in the forecast period, 2026-2030F. The India Orthopedic Devices Market is being driven by several factors. The most prominent ones include an increase in the elderly population, who are more prone to orthopedic conditions such as osteoporosis and arthritis. Moreover, the rise in sports injuries and road accidents are also contributing to the demand for orthopedic devices. Advances in technology and the introduction of innovative implants and prosthetics have further propelled the market growth. Additionally, government initiatives aimed at improving healthcare infrastructure and the increasing prevalence of lifestyle diseases have led to an upward trend in orthopedic surgeries, thereby fueling the market demand for these devices.
Accpac to QuickBooks Conversion Navigating the Transition with Online Account...PaulBryant58
This article provides a comprehensive guide on how to
effectively manage the convert Accpac to QuickBooks , with a particular focus on utilizing online accounting services to streamline the process.
Putting the SPARK into Virtual Training.pptxCynthia Clay
This 60-minute webinar, sponsored by Adobe, was delivered for the Training Mag Network. It explored the five elements of SPARK: Storytelling, Purpose, Action, Relationships, and Kudos. Knowing how to tell a well-structured story is key to building long-term memory. Stating a clear purpose that doesn't take away from the discovery learning process is critical. Ensuring that people move from theory to practical application is imperative. Creating strong social learning is the key to commitment and engagement. Validating and affirming participants' comments is the way to create a positive learning environment.
3.0 Project 2_ Developing My Brand Identity Kit.pptxtanyjahb
A personal brand exploration presentation summarizes an individual's unique qualities and goals, covering strengths, values, passions, and target audience. It helps individuals understand what makes them stand out, their desired image, and how they aim to achieve it.
Skye Residences | Extended Stay Residences Near Toronto Airportmarketingjdass
Experience unparalleled EXTENDED STAY and comfort at Skye Residences located just minutes from Toronto Airport. Discover sophisticated accommodations tailored for discerning travelers.
Website Link :
https://skyeresidences.com/
https://skyeresidences.com/about-us/
https://skyeresidences.com/gallery/
https://skyeresidences.com/rooms/
https://skyeresidences.com/near-by-attractions/
https://skyeresidences.com/commute/
https://skyeresidences.com/contact/
https://skyeresidences.com/queen-suite-with-sofa-bed/
https://skyeresidences.com/queen-suite-with-sofa-bed-and-balcony/
https://skyeresidences.com/queen-suite-with-sofa-bed-accessible/
https://skyeresidences.com/2-bedroom-deluxe-queen-suite-with-sofa-bed/
https://skyeresidences.com/2-bedroom-deluxe-king-queen-suite-with-sofa-bed/
https://skyeresidences.com/2-bedroom-deluxe-queen-suite-with-sofa-bed-accessible/
#Skye Residences Etobicoke, #Skye Residences Near Toronto Airport, #Skye Residences Toronto, #Skye Hotel Toronto, #Skye Hotel Near Toronto Airport, #Hotel Near Toronto Airport, #Near Toronto Airport Accommodation, #Suites Near Toronto Airport, #Etobicoke Suites Near Airport, #Hotel Near Toronto Pearson International Airport, #Toronto Airport Suite Rentals, #Pearson Airport Hotel Suites
Global Interconnection Group Joint Venture[960] (1).pdf
ch02.ppt
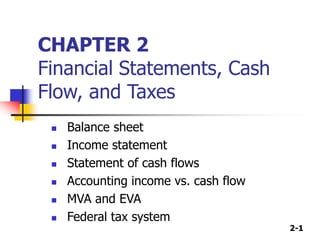
1. 2-1
CHAPTER 2
Financial Statements, Cash
Flow, and Taxes
Balance sheet
Income statement
Statement of cash flows
Accounting income vs. cash flow
MVA and EVA
Federal tax system
2. 2-2
The Annual Report
Balance sheet – provides a snapshot of a
firm’s financial position at one point in time.
Income statement – summarizes a firm’s
revenues and expenses over a given period of
time.
Statement of retained earnings – shows how
much of the firm’s earnings were retained,
rather than paid out as dividends.
Statement of cash flows – reports the impact
of a firm’s activities on cash flows over a given
period of time.
3. 2-3
Balance Sheet: Assets
Cash
A/R
Inventories
Total CA
Gross FA
Less: Dep.
Net FA
Total Assets
2002
7,282
632,160
1,287,360
1,926,802
1,202,950
263,160
939,790
2,866,592
2001
57,600
351,200
715,200
1,124,000
491,000
146,200
344,800
1,468,800
4. 2-4
Balance sheet:
Liabilities and Equity
Accts payable
Notes payable
Accruals
Total CL
Long-term debt
Common stock
Retained earnings
Total Equity
Total L & E
2002
524,160
636,808
489,600
1,650,568
723,432
460,000
32,592
492,592
2,866,592
2001
145,600
200,000
136,000
481,600
323,432
460,000
203,768
663,768
1,468,800
6. 2-6
Other data
No. of shares
EPS
DPS
Stock price
Lease pmts
2002
100,000
-$1.602
$0.11
$2.25
$40,000
2001
100,000
$0.88
$0.22
$8.50
$40,000
7. 2-7
Statement of Retained
Earnings (2002)
Balance of retained
earnings, 12/31/01
Add: Net income, 2002
Less: Dividends paid
Balance of retained
earnings, 12/31/02
$203,768
(160,176)
(11,000)
$32,592
8. 2-8
Statement of Cash Flows
(2002)
OPERATING ACTIVITIES
Net income
Add (Sources of cash):
Depreciation
Increase in A/P
Increase in accruals
Subtract (Uses of cash):
Increase in A/R
Increase in inventories
Net cash provided by ops.
(160,176)
116,960
378,560
353,600
(280,960)
(572,160)
(164,176)
9. 2-9
Statement of Cash Flows
(2002)
L-T INVESTING ACTIVITIES
Investment in fixed assets
FINANCING ACTIVITIES
Increase in notes payable
Increase in long-term debt
Payment of cash dividend
Net cash from financing
NET CHANGE IN CASH
Plus: Cash at beginning of year
Cash at end of year
(711,950)
436,808
400,000
(11,000)
825,808
(50,318)
57,600
7,282
10. 2-10
What can you conclude about
D’Leon’s financial condition from
its statement of CFs?
Net cash from operations = -$164,176,
mainly because of negative NI.
The firm borrowed $825,808 to meet
its cash requirements.
Even after borrowing, the cash
account fell by $50,318.
11. 2-11
Did the expansion create additional
net operating after taxes (NOPAT)?
NOPAT = EBIT (1 – Tax rate)
NOPAT02 = -$130,948(1 – 0.4)
= -$130,948(0.6)
= -$78,569
NOPAT01 = $114,257
12. 2-12
What effect did the expansion have
on net operating working capital?
NOWC = Current - Non-interest
assets bearing CL
NOWC02 = ($7,282 + $632,160 + $1,287,360)
– ( $524,160 + $489,600)
= $913,042
NOWC01 = $842,400
13. 2-13
What effect did the expansion have
on operating capital?
Operating capital = NOWC + Net Fixed Assets
Operating Capital02 = $913,042 + $939,790
= $1,852,832
Operating Capital01 = $1,187,200
14. 2-14
What is your assessment of the
expansion’s effect on operations?
Sales
NOPAT
NOWC
Operating capital
Net Income
2002
$6,034,000
-$78,569
$913,042
$1,852,832
-$160,176
2001
$3,432,000
$114,257
$842,400
$1,187,200
$87,960
15. 2-15
What effect did the expansion have on
net cash flow and operating cash flow?
NCF02 = NI + Dep = ($160,176) + $116,960
= -$43,216
NCF01 = $87,960 + $18,900 = $106,860
OCF02 = NOPAT + Dep
= ($78,569) + $116,960
= $38,391
OCF01 = $114,257 + $18,900
= $133,157
16. 2-16
What was the free cash flow
(FCF) for 2002?
FCF = OCF – Gross capital investment
- OR -
FCF02 = NOPAT – Net capital investment
= -$78,569 – ($1,852,832 - $1,187,200)
= -$744,201
Is negative free cash flow always a bad sign?
17. 2-17
Economic Value Added (EVA)
EVA = After-tax __ After-tax
Operating Income Capital costs
= Funds Available __ Cost of
to Investors Capital Used
= NOPAT – After-tax Cost of Capital
18. 2-18
EVA Concepts
In order to generate positive EVA, a
firm has to more than just cover
operating costs. It must also provide
a return to those who have provided
the firm with capital.
EVA takes into account the total cost
of capital, which includes the cost of
equity.
19. 2-19
What is the firm’s EVA? Assume the firm’s
after-tax percentage cost of capital was
10% in 2000 and 13% in 2001.
EVA02 = NOPAT – (A-T cost of capital) (Capital)
= -$78,569 – (0.13)($1,852,832)
= -$78,569 - $240,868
= -$319,437
EVA01 = $114,257 – (0.10)($1,187,200)
= $114,257 - $118,720
= -$4,463
20. 2-20
Did the expansion increase or
decrease MVA?
MVA = Market value __ Equity capital
of equity supplied
During the last year, the stock price has
decreased 73%. As a consequence, the
market value of equity has declined,
and therefore MVA has declined, as
well.
21. 2-21
Does D’Leon pay its suppliers
on time?
Probably not.
A/P increased 260%, over the past
year, while sales increased by only
76%.
If this continues, suppliers may cut
off D’Leon’s trade credit.
22. 2-22
Does it appear that D’Leon’s sales
price exceeds its cost per unit sold?
NO, the negative NOPAT and decline
in cash position shows that D’Leon is
spending more on its operations than
it is taking in.
23. 2-23
What if D’Leon’s sales manager decided
to offer 60-day credit terms to customers,
rather than 30-day credit terms?
If competitors match terms, and sales remain
constant …
A/R would
Cash would
If competitors don’t match, and sales double …
Short-run: Inventory and fixed assets to meet
increased sales. A/R , Cash . Company
may have to seek additional financing.
Long-run: Collections increase and the
company’s cash position would improve.
24. 2-24
How did D’Leon finance its
expansion?
D’Leon financed its expansion with
external capital.
D’Leon issued long-term debt which
reduced its financial strength and
flexibility.
25. 2-25
Would D’Leon have required external
capital if they had broken even in 2001
(Net Income = 0)?
YES, the company would still have to
finance its increase in assets. Looking
to the Statement of Cash Flows, we see
that the firm made an investment of
$711,950 in net fixed assets.
Therefore, they would have needed to
raise additional funds.
26. 2-26
What happens if D’Leon depreciates
fixed assets over 7 years (as opposed to
the current 10 years)?
No effect on physical
assets.
Fixed assets on the
balance sheet would
decline.
Net income would
decline.
Tax payments would
decline.
Cash position would
improve.
28. 2-28
Corporate and Personal Taxes
Both have a progressive structure (the higher the
income, the higher the marginal tax rate).
Corporations
Rates begin at 15% and rise to 35% for corporations
with income over $10 million.
Also subject to state tax (around 5%).
Individuals
Rates begin at 10% and rise to 38.6% for individuals
with income over $307,050.
May be subject to state tax.
29. 2-29
Tax treatment of various uses
and sources of funds
Interest paid – tax deductible for corporations
(paid out of pre-tax income), but usually not for
individuals (interest on home loans being the
exception).
Interest earned – usually fully taxable (an
exception being interest from a (muni”).
Dividends paid – paid out of after-tax income.
Dividends received – taxed as ordinary income
for individuals (“double taxation”). A portion of
dividends received by corporations is tax
excludable, in order to avoid “triple taxation”.
30. 2-30
More tax issues
Tax Loss Carry-Back and Carry-Forward – since
corporate incomes can fluctuate widely, the tax
code allows firms to carry losses back to offset
profits in previous years or forward to offset
profits in the future.
Capital gains – defined as the profits from the
sale of assets not normally transacted in the
normal course of business, capital gains for
individuals are generally taxed as ordinary
income if held for less than a year, and at the
capital gains rate if held for more than a year.
Corporations face somewhat different rules.