SlideShare a Scribd company logo
1 of 1
Open-Arm Plus Maze Results
Image 1:
Picture of an elevated plus maze used for stress-induction on the left. Sample pictures of the 3
brain regions identified from left to right: amygdala, hippocampus, hypothalamus.
Differential Neuronal Activation of Stress-Induced c-Fos
Transcription Factor in Mice Bred for High and Low Anxiety
INTRODUCTION
 Selective Breeding of Mice for High and Low anxiety (Figure 1)
 Used normal CD-1 mice to start with as generation 1
 Mice that appeared to have the highest or lowest anxiety levels mated
with each other for subsequent generations
 Mice were exposed to elevated plus maze for 5 min
− Spent average of 100 sec on open arms
Figure 1: Significant difference in time spent in open arms shown in second and
subsequent generations of selective breeding; less anxious mice spent more time on
open arm, more anxious mice spent less time on open arm.
Eric Lai, Mary Anne Hutchison, Wei Lu. NINDS
National Institutes of Health: Bethesda, MD 2015
METHODS
 Stress Induction
 4 Experimental Groups:
− Normal CD-1 Mice Stressed (n=4)
− Normal CD-1 Mice Control (n=4)
− Low Anxiety Mice Stressed (n=4)
− Low Anxiety Mice Control (n=3)
 Elevated Plus Maze
− Put up barrier so only exposed to open arm for 5 min
− Open arm divided up in 3 zones: Proximal, Medial, Distal
− Measurements taken on open arm using camera (Figure 2)
 Perfusion & Cryostat Slicing
 DAB Staining
 Work in progress of optimizing ideal conditions
− Concentrations of primary and secondary antibodies; blocking solution
− Pre mounted (free floating) vs. mounted slides
 Rinsed in PBS, TBST, .03% H2O2, Blocking Solution
− Incubated overnight in rabbit anti-c-Fos primary antibody
− Incubated in Vectastatin ABC
 All sections incubated with DAB-solution for 3 min
 Mounting
 Imaging & Analysis
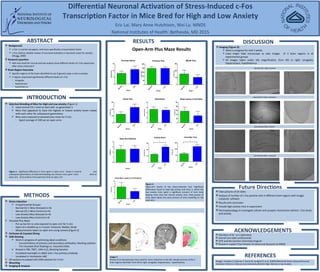
Figure 2:
Open-arm results of the stress-induction test. Significant
differences found in head dip entries and time, in which the
low anxiety mice spent a significant amount of time head
dipping more than the normal anxiety mice. Both groups of
mice spent about the same amount of time travelling on the
open arm.
RESULTS
 Imaging (Figure 3):
 Work in progress for next 2 weeks
 Used bright field microscope to take images of 3 brain regions in all
experimental groups
 All images taken under 10x magnification, from left to right: amygdala,
hippocampus, hypothalamus
DISCUSSION
REFERENCES
Muigg P, Scheiber S, Salchner P, Bunck M, Landgraf R, et al. (2009) Differential Stress-Induced Neuronal
Activation Patterns in Mouse Lines Selectively Bred for High, Normal or Low Anxiety.
ACKNOWLEDGEMENTS
 Members of Dr. Lu’s Laboratory
 Animal Care taker professionals
 OITE and the Summer Internship Program
 Research support from Division of Intramural Research at NINDS
ABSTRACT
 Background:
 c-Fos is a proto-oncogene, and more specifically a transcription factor
 c-Fos cited as reliable marker of neuronal activation in key brain areas for anxiety
(Muigg, 2009)
 Research question:
 Will mice bred for normal and low anxiety show different levels of c-Fos expression
after stress induction?
 Brain Region Overview
 Specific regions of the brain identified to see if genetics play a role in anxiety
 3 regions expressed significantly different levels of c-Fos
− Amygdala
− Hippocampus
− Hypothalamus
Future Directions
 Take pictures of all slides
 Analysis of number of c-Fos positive cells in different brain regions with ImageJ
computer software
 Results and conclusion
 Include high anxiety mice in experiment
 Electrophysiology to investigate cellular and synaptic mechanisms behind c-Fos levels
and anxiety
Normal CD-1 Mice Stressed
Low Anxiety Mice Control
Low Anxiety Mice Stressed
Normal CD-1 Mice Control

More Related Content

Similar to c-Fos Poster

Anxiolytic screening models_utkarsh
Anxiolytic screening models_utkarshAnxiolytic screening models_utkarsh
Anxiolytic screening models_utkarshUtkarsh Alok
 
Don't Miss a Beat: Understanding Continuous, Real Time Physiologic Monitoring
Don't Miss a Beat:  Understanding Continuous, Real Time Physiologic MonitoringDon't Miss a Beat:  Understanding Continuous, Real Time Physiologic Monitoring
Don't Miss a Beat: Understanding Continuous, Real Time Physiologic MonitoringInsideScientific
 
Hypothermia Poster 071312bmX3
Hypothermia Poster 071312bmX3Hypothermia Poster 071312bmX3
Hypothermia Poster 071312bmX3Arielle Dennis
 
EricSchmidtUROPposter2014
EricSchmidtUROPposter2014EricSchmidtUROPposter2014
EricSchmidtUROPposter2014Eric Schmidt
 
Behavioral phenotyping of mouse models of neurodegeneration
Behavioral phenotyping of mouse models of neurodegeneration Behavioral phenotyping of mouse models of neurodegeneration
Behavioral phenotyping of mouse models of neurodegeneration Dewan Sumsuzzman
 
TBI Presentation 02 Updated.pptx
TBI Presentation 02 Updated.pptxTBI Presentation 02 Updated.pptx
TBI Presentation 02 Updated.pptxXiaomiRedmi22
 
New microsoft office word document
New microsoft office word documentNew microsoft office word document
New microsoft office word documentharsha979797
 
Phenotypic screening using MEAs
Phenotypic screening using MEAsPhenotypic screening using MEAs
Phenotypic screening using MEAsNeuroProof GmbH
 
Preclinical screening methods of Sedative and hypnotics by syed
Preclinical screening methods of Sedative and hypnotics by syedPreclinical screening methods of Sedative and hypnotics by syed
Preclinical screening methods of Sedative and hypnotics by syedMubasheer syed
 
Screening of anxiolytic agents
Screening of anxiolytic agents Screening of anxiolytic agents
Screening of anxiolytic agents yasmeenmir1
 
Poster Human Neurophysiology
Poster Human NeurophysiologyPoster Human Neurophysiology
Poster Human NeurophysiologyValerie1502
 

Similar to c-Fos Poster (20)

fnsys-09-00015
fnsys-09-00015fnsys-09-00015
fnsys-09-00015
 
fnsys-09-00015
fnsys-09-00015fnsys-09-00015
fnsys-09-00015
 
SCM defense ppt_final
SCM defense ppt_finalSCM defense ppt_final
SCM defense ppt_final
 
Anxiolytic screening models_utkarsh
Anxiolytic screening models_utkarshAnxiolytic screening models_utkarsh
Anxiolytic screening models_utkarsh
 
Hypothermia Abstract
Hypothermia Abstract Hypothermia Abstract
Hypothermia Abstract
 
Don't Miss a Beat: Understanding Continuous, Real Time Physiologic Monitoring
Don't Miss a Beat:  Understanding Continuous, Real Time Physiologic MonitoringDon't Miss a Beat:  Understanding Continuous, Real Time Physiologic Monitoring
Don't Miss a Beat: Understanding Continuous, Real Time Physiologic Monitoring
 
Hypothermia Poster 071312bmX3
Hypothermia Poster 071312bmX3Hypothermia Poster 071312bmX3
Hypothermia Poster 071312bmX3
 
2 neurogenesis
2 neurogenesis2 neurogenesis
2 neurogenesis
 
EricSchmidtUROPposter2014
EricSchmidtUROPposter2014EricSchmidtUROPposter2014
EricSchmidtUROPposter2014
 
Behavioral phenotyping of mouse models of neurodegeneration
Behavioral phenotyping of mouse models of neurodegeneration Behavioral phenotyping of mouse models of neurodegeneration
Behavioral phenotyping of mouse models of neurodegeneration
 
TBI Presentation 02 Updated.pptx
TBI Presentation 02 Updated.pptxTBI Presentation 02 Updated.pptx
TBI Presentation 02 Updated.pptx
 
New microsoft office word document
New microsoft office word documentNew microsoft office word document
New microsoft office word document
 
are you afraid FINAL
are you afraid FINALare you afraid FINAL
are you afraid FINAL
 
our psych
our psychour psych
our psych
 
Phenotypic screening using MEAs
Phenotypic screening using MEAsPhenotypic screening using MEAs
Phenotypic screening using MEAs
 
Preclinical screening methods of Sedative and hypnotics by syed
Preclinical screening methods of Sedative and hypnotics by syedPreclinical screening methods of Sedative and hypnotics by syed
Preclinical screening methods of Sedative and hypnotics by syed
 
BDSRA 2015 CLN1 Hofmann
BDSRA 2015 CLN1 HofmannBDSRA 2015 CLN1 Hofmann
BDSRA 2015 CLN1 Hofmann
 
NicoleRowbothamPoster
NicoleRowbothamPosterNicoleRowbothamPoster
NicoleRowbothamPoster
 
Screening of anxiolytic agents
Screening of anxiolytic agents Screening of anxiolytic agents
Screening of anxiolytic agents
 
Poster Human Neurophysiology
Poster Human NeurophysiologyPoster Human Neurophysiology
Poster Human Neurophysiology
 

c-Fos Poster

  • 1. Open-Arm Plus Maze Results Image 1: Picture of an elevated plus maze used for stress-induction on the left. Sample pictures of the 3 brain regions identified from left to right: amygdala, hippocampus, hypothalamus. Differential Neuronal Activation of Stress-Induced c-Fos Transcription Factor in Mice Bred for High and Low Anxiety INTRODUCTION  Selective Breeding of Mice for High and Low anxiety (Figure 1)  Used normal CD-1 mice to start with as generation 1  Mice that appeared to have the highest or lowest anxiety levels mated with each other for subsequent generations  Mice were exposed to elevated plus maze for 5 min − Spent average of 100 sec on open arms Figure 1: Significant difference in time spent in open arms shown in second and subsequent generations of selective breeding; less anxious mice spent more time on open arm, more anxious mice spent less time on open arm. Eric Lai, Mary Anne Hutchison, Wei Lu. NINDS National Institutes of Health: Bethesda, MD 2015 METHODS  Stress Induction  4 Experimental Groups: − Normal CD-1 Mice Stressed (n=4) − Normal CD-1 Mice Control (n=4) − Low Anxiety Mice Stressed (n=4) − Low Anxiety Mice Control (n=3)  Elevated Plus Maze − Put up barrier so only exposed to open arm for 5 min − Open arm divided up in 3 zones: Proximal, Medial, Distal − Measurements taken on open arm using camera (Figure 2)  Perfusion & Cryostat Slicing  DAB Staining  Work in progress of optimizing ideal conditions − Concentrations of primary and secondary antibodies; blocking solution − Pre mounted (free floating) vs. mounted slides  Rinsed in PBS, TBST, .03% H2O2, Blocking Solution − Incubated overnight in rabbit anti-c-Fos primary antibody − Incubated in Vectastatin ABC  All sections incubated with DAB-solution for 3 min  Mounting  Imaging & Analysis Figure 2: Open-arm results of the stress-induction test. Significant differences found in head dip entries and time, in which the low anxiety mice spent a significant amount of time head dipping more than the normal anxiety mice. Both groups of mice spent about the same amount of time travelling on the open arm. RESULTS  Imaging (Figure 3):  Work in progress for next 2 weeks  Used bright field microscope to take images of 3 brain regions in all experimental groups  All images taken under 10x magnification, from left to right: amygdala, hippocampus, hypothalamus DISCUSSION REFERENCES Muigg P, Scheiber S, Salchner P, Bunck M, Landgraf R, et al. (2009) Differential Stress-Induced Neuronal Activation Patterns in Mouse Lines Selectively Bred for High, Normal or Low Anxiety. ACKNOWLEDGEMENTS  Members of Dr. Lu’s Laboratory  Animal Care taker professionals  OITE and the Summer Internship Program  Research support from Division of Intramural Research at NINDS ABSTRACT  Background:  c-Fos is a proto-oncogene, and more specifically a transcription factor  c-Fos cited as reliable marker of neuronal activation in key brain areas for anxiety (Muigg, 2009)  Research question:  Will mice bred for normal and low anxiety show different levels of c-Fos expression after stress induction?  Brain Region Overview  Specific regions of the brain identified to see if genetics play a role in anxiety  3 regions expressed significantly different levels of c-Fos − Amygdala − Hippocampus − Hypothalamus Future Directions  Take pictures of all slides  Analysis of number of c-Fos positive cells in different brain regions with ImageJ computer software  Results and conclusion  Include high anxiety mice in experiment  Electrophysiology to investigate cellular and synaptic mechanisms behind c-Fos levels and anxiety Normal CD-1 Mice Stressed Low Anxiety Mice Control Low Anxiety Mice Stressed Normal CD-1 Mice Control