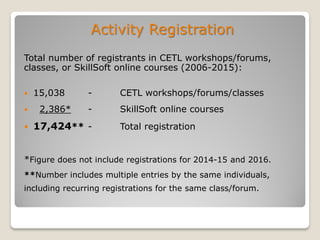
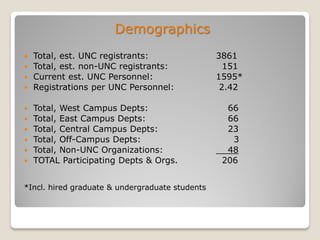
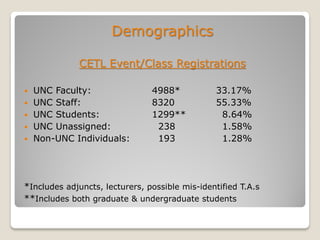
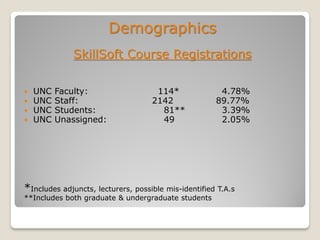
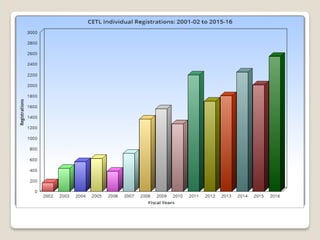
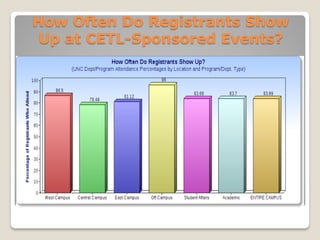
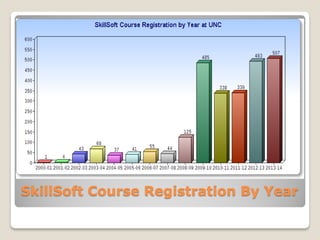
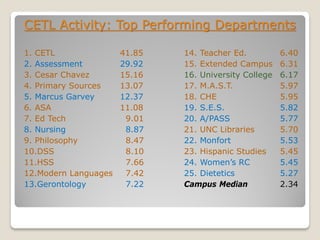
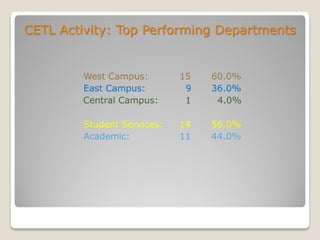
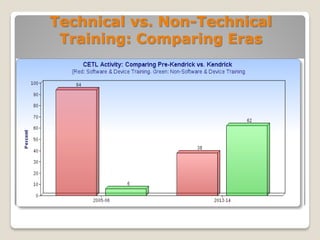
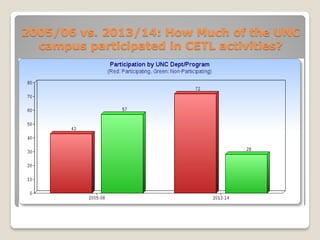
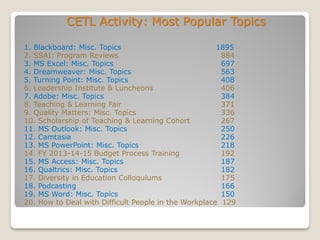
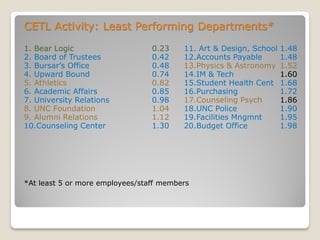
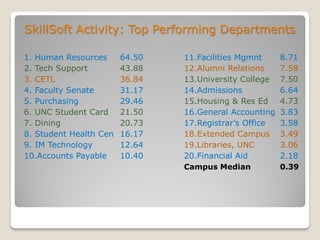
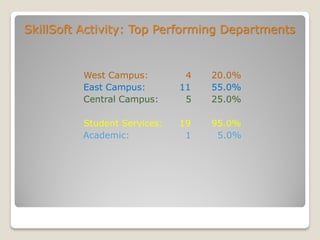
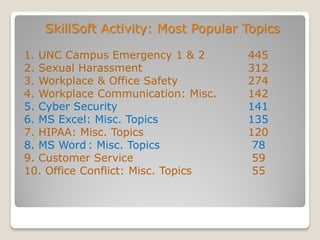
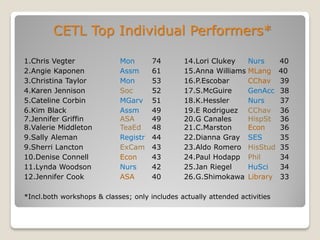
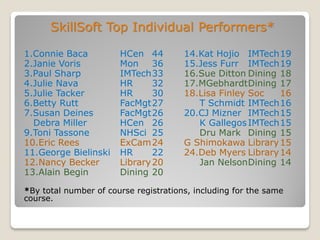
Facilitating
Professional
Development at UNC
Methodology
 Data retrieved from existing MS Access & Excel Databases and
paper files containing available hard copy data for the years 2001
through 12/31/2015.
 Data organized by fiscal year 7/1 – 6/30
 Data organized by UNC dept./program/college
 UNC dept./program categories above obtained from UNC online
office directory, or from the participants themselves
 Entries assigned to categories above based on how participants
were titled by either themselves or CETL personnel present.
 Unassigned entries researched against previous entries in
databases, or within UNC website, or via Google search
Research & Analysis Considerations
 Cross-reference not found for a small percentage of
unassigned participants
 Assignment accuracy imprecise to a small degree, due to
multiple roles held on campus by a few participants,
assignment ambiguity due to multiple departments/
programs within a given college/school (participants
sometimes titled with multiple designations within the
same college/school), and changes in employment location
Findings
Activity Registration
Total number of registrants in CETL workshops/forums,
classes, or SkillSoft online courses (2006-2015):
 15,038 - CETL workshops/forums/classes
 2,386* - SkillSoft online courses
 17,424** - Total registration
*Figure does not include registrations for 2014-15 and 2016.
**Number includes multiple entries by the same individuals,
including recurring registrations for the same class/forum.
Demographics
 Total, est. UNC registrants: 3861
 Total, est. non-UNC registrants: 151
 Current est. UNC Personnel: 1595*
 Registrations per UNC Personnel: 2.42
 Total, West Campus Depts: 66
 Total, East Campus Depts: 66
 Total, Central Campus Depts: 23
 Total, Off-Campus Depts: 3
 Total, Non-UNC Organizations: 48
 TOTAL Participating Depts & Orgs. 206
*Incl. hired graduate & undergraduate students
Demographics
CETL Event/Class Registrations
 UNC Faculty: 4988* 33.17%
 UNC Staff: 8320 55.33%
 UNC Students: 1299** 8.64%
 UNC Unassigned: 238 1.58%
 Non-UNC Individuals: 193 1.28%
*Includes adjuncts, lecturers, possible mis-identified T.A.s
**Includes both graduate & undergraduate students
Demographics
SkillSoft Course Registrations
 UNC Faculty: 114* 4.78%
 UNC Staff: 2142 89.77%
 UNC Students: 81** 3.39%
 UNC Unassigned: 49 2.05%
*Includes adjuncts, lecturers, possible mis-identified T.A.s
**Includes both graduate & undergraduate students
How Often Do Registrants Show
Up at CETL-Sponsored Events?
SkillSoft Course Registration By Year
CETL Activity Total Engagement Score
 Current dept. size divided by attendance
 Est. – historical dept. employment, divided by attendance
 Average the two totals above
 Multiply by dept. attendance percentage
 Multiply by annual consistency of dept. attendance
CETL Activity: Top Performing Departments
1. CETL 41.85 14. Teacher Ed. 6.40
2. Assessment 29.92 15. Extended Campus 6.31
3. Cesar Chavez 15.16 16. University College 6.17
4. Primary Sources 13.07 17. M.A.S.T. 5.97
5. Marcus Garvey 12.37 18. CHE 5.95
6. ASA 11.08 19. S.E.S. 5.82
7. Ed Tech 9.01 20. A/PASS 5.77
8. Nursing 8.87 21. UNC Libraries 5.70
9. Philosophy 8.47 22. Monfort 5.53
10.DSS 8.10 23. Hispanic Studies 5.45
11.HSS 7.66 24. Women’s RC 5.45
12.Modern Languages 7.42 25. Dietetics 5.27
13.Gerontology 7.22 Campus Median 2.34
CETL Activity: Top Performing Departments
West Campus: 15 60.0%
East Campus: 9 36.0%
Central Campus: 1 4.0%
Student Services: 14 56.0%
Academic: 11 44.0%
Technical vs. Non-Technical
Training: Comparing Eras
2005/06 vs. 2013/14: How Much of the UNC
campus participated in CETL activities?
CETL Activity: Most Popular Topics
1. Blackboard: Misc. Topics 1895
2. SSAI: Program Reviews 884
3. MS Excel: Misc. Topics 697
4. Dreamweaver: Misc. Topics 563
5. Turning Point: Misc. Topics 408
6. Leadership Institute & Luncheons 406
7. Adobe: Misc. Topics 384
8. Teaching & Learning Fair 371
9. Quality Matters: Misc. Topics 336
10. Scholarship of Teaching & Learning Cohort 267
11. MS Outlook: Misc. Topics 250
12. Camtasia 226
13. MS PowerPoint: Misc. Topics 218
14. FY 2013-14-15 Budget Process Training 192
15. MS Access: Misc. Topics 187
16. Qualtrics: Misc. Topics 182
17. Diversity in Education Colloquiums 175
18. Podcasting 166
19. MS Word: Misc. Topics 150
20. How to Deal with Difficult People in the Workplace 129
CETL Activity: Least Performing Departments*
1. Bear Logic 0.23 11. Art & Design, School 1.48
2. Board of Trustees 0.42 12.Accounts Payable 1.48
3. Bursar’s Office 0.48 13.Physics & Astronomy 1.52
4. Upward Bound 0.74 14.IM & Tech 1.60
5. Athletics 0.82 15.Student Health Cent 1.68
6. Academic Affairs 0.85 16.Purchasing 1.72
7. University Relations 0.98 17.Counseling Psych 1.86
8. UNC Foundation 1.04 18.UNC Police 1.90
9. Alumni Relations 1.12 19.Facilities Mngmnt 1.95
10.Counseling Center 1.30 20.Budget Office 1.98
*At least 5 or more employees/staff members
SkillSoft Activity: Top Performing Departments
1. Human Resources 64.50 11.Facilities Mgmnt 8.71
2. Tech Support 43.88 12.Alumni Relations 7.58
3. CETL 36.84 13.University College 7.50
4. Faculty Senate 31.17 14.Admissions 6.64
5. Purchasing 29.46 15.Housing & Res Ed 4.73
6. UNC Student Card 21.50 16.General Accounting 3.83
7. Dining 20.73 17.Registrar’s Office 3.58
8. Student Health Cen 16.17 18.Extended Campus 3.49
9. IM Technology 12.64 19.Libraries, UNC 3.06
10.Accounts Payable 10.40 20.Financial Aid 2.18
Campus Median 0.39
SkillSoft Activity: Top Performing Departments
West Campus: 4 20.0%
East Campus: 11 55.0%
Central Campus: 5 25.0%
Student Services: 19 95.0%
Academic: 1 5.0%
SkillSoft Activity: Most Popular Topics
1. UNC Campus Emergency 1 & 2 445
2. Sexual Harassment 312
3. Workplace & Office Safety 274
4. Workplace Communication: Misc. 142
5. Cyber Security 141
6. MS Excel: Misc. Topics 135
7. HIPAA: Misc. Topics 120
8. MS Word : Misc. Topics 78
9. Customer Service 59
10. Office Conflict: Misc. Topics 55
SkillSoft Activity: Least Performing Departments*
0 Score- Academic Affairs, Anthropology, Board of Trustees,
Chemistry, Dean of Students, Earth Sciences,
Economics, Educational Foundations, Journalism &
Mass Communications, Political Science, UNC Visa
Card, University College, Upward Bound. (13)
0.01 Score- CIE, Dietetics, Criminal Justice, Education
Technology, Hispanic Studies, Mathematical
Sciences, Performing & Visual Arts, Psychological
Sciences, Sports & Exercise Science (9)
*At least 5 or more employees/staff members
UNC Departmental Activity at a Glance
 158 total departments as reported during registrations
 All 11 but registered for at least one CETL activity from
7/1/2006 through 6/30/2014: 93.04%
(excepting the Bresnahan Halstead Center, the Hewitt Center, KSRI
Radio, Office of Undergraduate Research, Study Abroad Center,
Technical Support Center, UNC Army ROTC, University Advancement,
UNC Visa Card, UNC Wells Fargo, and the Writing Center, with some of
these departments overlapping with those that do participate)
 94 of 158 total departments registered for at least one
SkillSoft course from 7/1/2006 through 12/31/15:
59.49%
SkillSoft Notes
 Total, Female Participants 327 62.6%
 Total, Male Participants 195 37.4%
 Of the 3861 UNC individual registrants in either CETL or
SkillSoft activities from 7/1/2006 through 6/30/2014:
- An est. 6.0% took the UNC Emergency Course
- An est. 7.4% took the Workplace Safety Course
- An est. 8.1% took the Sexual Harassment Course
- An est. 3.7% took the Cyber Security Course
CETL Top Individual Performers*
1.Chris Vegter Mon 74 14.Lori Clukey Nurs 40
2.Angie Kaponen Assm 61 15.Anna Williams MLang 40
3.Christina Taylor Mon 53 16.P.Escobar CChav 39
4.Karen Jennison Soc 52 17.S.McGuire GenAcc 38
5.Cateline Corbin MGarv 51 18.K.Hessler Nurs 37
6.Kim Black Assm 49 19.E Rodriguez CChav 36
7.Jennifer Griffin ASA 49 20.G Canales HispSt 36
8.Valerie Middleton TeaEd 48 21.C.Marston Econ 36
9.Sally Aleman Registr 44 22.Dianna Gray SES 35
9.Sherri Lancton ExCam 43 23.Aldo Romero HisStud 35
10.Denise Connell Econ 43 24.Paul Hodapp Phil 34
11.Lynda Woodson Nurs 42 25.Jan Riegel HuSci 34
12.Jennifer Cook ASA 40 26.G.Shimokawa Library 33
*Incl.both workshops & classes; only includes actually attended activities
SkillSoft Top Individual Performers*
1.Connie Baca HCen 44 14.Kat Hojio IMTech19
2.Janie Voris Mon 36 15.Jess Furr IMTech19
3.Paul Sharp IMTech33 16.Sue Ditton Dining 18
4.Julie Nava HR 32 17.MGebhardtDining 17
5.Julie Tacker HR 30 18.Lisa Finley Soc 16
6.Betty Rutt FacMgt27 T Schmidt IMTech16
7.Susan Deines FacMgt26 20.CJ Mizner IMTech15
Debra Miller HCen 26 K GallegosIMTech15
9.Toni Tassone NHSci 25 Dru Mark Dining 15
10.Eric Rees ExCam24 G Shimokawa Library15
11.George Bielinski HR 22 24.Deb Myers Library14
12.Nancy Becker Library20 Jan NelsonDining 14
13.Alain Begin Dining 20
*By total number of course registrations, including for the same
course.
Discussion: Some Major Takeaways
 Location matters; West campus departments participate in face-to-
face CETL-facilitated activities substantially more often; however, East
and Central campus departments participate in online delivery
(SkillSoft) learning more than do West Campus departments.
 Proportionately, faculty engage in CETL sponsored workshops and
classes about as often as staff overall, but staff utilize SkillSoft far
more often.
 Since 2006, overall participation in both workshops & classes and
SkillSoft has been trending upwards overall, with 2013-14 proving to
be a record year for overall participation at UNC.
 The breadth of campus-wide participation in CETL-sponsored activity
including SkillSoft is impressive; depth? Not so much.
 Over half of campus SkillSoft activity focused on regulatory
coursework such as Emergency, Sexual Harassment & Safety training
 Non-software & device training has overtaken software & device
training by individual participation percentage since 2005-06.
 Females tend to dominate CETL-sponsored activities (by number).
Further Research
 Why has campus-wide participation in CETL-sponsored
professional development activities substantively and steadily
increased in a geometric fashion from 2001-02, from when the
earliest teaching & learning center records were kept? Particularly
when CETL staffing has either held steady or actually decreased
in number in recent years?
 Does participation in CETL-sponsored professional development
activities enhance individual job performance and career path
development? If so, what specific stories, measures, and
examples might support such a claim?

CETL Data Analysis Presentation- Facilitating Professional Development at UNC 2016

  • 1.
  • 2.
    Methodology  Data retrievedfrom existing MS Access & Excel Databases and paper files containing available hard copy data for the years 2001 through 12/31/2015.  Data organized by fiscal year 7/1 – 6/30  Data organized by UNC dept./program/college  UNC dept./program categories above obtained from UNC online office directory, or from the participants themselves  Entries assigned to categories above based on how participants were titled by either themselves or CETL personnel present.  Unassigned entries researched against previous entries in databases, or within UNC website, or via Google search
  • 3.
    Research & AnalysisConsiderations  Cross-reference not found for a small percentage of unassigned participants  Assignment accuracy imprecise to a small degree, due to multiple roles held on campus by a few participants, assignment ambiguity due to multiple departments/ programs within a given college/school (participants sometimes titled with multiple designations within the same college/school), and changes in employment location
  • 4.
  • 5.
    Activity Registration Total numberof registrants in CETL workshops/forums, classes, or SkillSoft online courses (2006-2015):  15,038 - CETL workshops/forums/classes  2,386* - SkillSoft online courses  17,424** - Total registration *Figure does not include registrations for 2014-15 and 2016. **Number includes multiple entries by the same individuals, including recurring registrations for the same class/forum.
  • 6.
    Demographics  Total, est.UNC registrants: 3861  Total, est. non-UNC registrants: 151  Current est. UNC Personnel: 1595*  Registrations per UNC Personnel: 2.42  Total, West Campus Depts: 66  Total, East Campus Depts: 66  Total, Central Campus Depts: 23  Total, Off-Campus Depts: 3  Total, Non-UNC Organizations: 48  TOTAL Participating Depts & Orgs. 206 *Incl. hired graduate & undergraduate students
  • 7.
    Demographics CETL Event/Class Registrations UNC Faculty: 4988* 33.17%  UNC Staff: 8320 55.33%  UNC Students: 1299** 8.64%  UNC Unassigned: 238 1.58%  Non-UNC Individuals: 193 1.28% *Includes adjuncts, lecturers, possible mis-identified T.A.s **Includes both graduate & undergraduate students
  • 8.
    Demographics SkillSoft Course Registrations UNC Faculty: 114* 4.78%  UNC Staff: 2142 89.77%  UNC Students: 81** 3.39%  UNC Unassigned: 49 2.05% *Includes adjuncts, lecturers, possible mis-identified T.A.s **Includes both graduate & undergraduate students
  • 10.
    How Often DoRegistrants Show Up at CETL-Sponsored Events?
  • 11.
  • 12.
    CETL Activity TotalEngagement Score  Current dept. size divided by attendance  Est. – historical dept. employment, divided by attendance  Average the two totals above  Multiply by dept. attendance percentage  Multiply by annual consistency of dept. attendance
  • 13.
    CETL Activity: TopPerforming Departments 1. CETL 41.85 14. Teacher Ed. 6.40 2. Assessment 29.92 15. Extended Campus 6.31 3. Cesar Chavez 15.16 16. University College 6.17 4. Primary Sources 13.07 17. M.A.S.T. 5.97 5. Marcus Garvey 12.37 18. CHE 5.95 6. ASA 11.08 19. S.E.S. 5.82 7. Ed Tech 9.01 20. A/PASS 5.77 8. Nursing 8.87 21. UNC Libraries 5.70 9. Philosophy 8.47 22. Monfort 5.53 10.DSS 8.10 23. Hispanic Studies 5.45 11.HSS 7.66 24. Women’s RC 5.45 12.Modern Languages 7.42 25. Dietetics 5.27 13.Gerontology 7.22 Campus Median 2.34
  • 14.
    CETL Activity: TopPerforming Departments West Campus: 15 60.0% East Campus: 9 36.0% Central Campus: 1 4.0% Student Services: 14 56.0% Academic: 11 44.0%
  • 15.
  • 16.
    2005/06 vs. 2013/14:How Much of the UNC campus participated in CETL activities?
  • 17.
    CETL Activity: MostPopular Topics 1. Blackboard: Misc. Topics 1895 2. SSAI: Program Reviews 884 3. MS Excel: Misc. Topics 697 4. Dreamweaver: Misc. Topics 563 5. Turning Point: Misc. Topics 408 6. Leadership Institute & Luncheons 406 7. Adobe: Misc. Topics 384 8. Teaching & Learning Fair 371 9. Quality Matters: Misc. Topics 336 10. Scholarship of Teaching & Learning Cohort 267 11. MS Outlook: Misc. Topics 250 12. Camtasia 226 13. MS PowerPoint: Misc. Topics 218 14. FY 2013-14-15 Budget Process Training 192 15. MS Access: Misc. Topics 187 16. Qualtrics: Misc. Topics 182 17. Diversity in Education Colloquiums 175 18. Podcasting 166 19. MS Word: Misc. Topics 150 20. How to Deal with Difficult People in the Workplace 129
  • 18.
    CETL Activity: LeastPerforming Departments* 1. Bear Logic 0.23 11. Art & Design, School 1.48 2. Board of Trustees 0.42 12.Accounts Payable 1.48 3. Bursar’s Office 0.48 13.Physics & Astronomy 1.52 4. Upward Bound 0.74 14.IM & Tech 1.60 5. Athletics 0.82 15.Student Health Cent 1.68 6. Academic Affairs 0.85 16.Purchasing 1.72 7. University Relations 0.98 17.Counseling Psych 1.86 8. UNC Foundation 1.04 18.UNC Police 1.90 9. Alumni Relations 1.12 19.Facilities Mngmnt 1.95 10.Counseling Center 1.30 20.Budget Office 1.98 *At least 5 or more employees/staff members
  • 19.
    SkillSoft Activity: TopPerforming Departments 1. Human Resources 64.50 11.Facilities Mgmnt 8.71 2. Tech Support 43.88 12.Alumni Relations 7.58 3. CETL 36.84 13.University College 7.50 4. Faculty Senate 31.17 14.Admissions 6.64 5. Purchasing 29.46 15.Housing & Res Ed 4.73 6. UNC Student Card 21.50 16.General Accounting 3.83 7. Dining 20.73 17.Registrar’s Office 3.58 8. Student Health Cen 16.17 18.Extended Campus 3.49 9. IM Technology 12.64 19.Libraries, UNC 3.06 10.Accounts Payable 10.40 20.Financial Aid 2.18 Campus Median 0.39
  • 20.
    SkillSoft Activity: TopPerforming Departments West Campus: 4 20.0% East Campus: 11 55.0% Central Campus: 5 25.0% Student Services: 19 95.0% Academic: 1 5.0%
  • 21.
    SkillSoft Activity: MostPopular Topics 1. UNC Campus Emergency 1 & 2 445 2. Sexual Harassment 312 3. Workplace & Office Safety 274 4. Workplace Communication: Misc. 142 5. Cyber Security 141 6. MS Excel: Misc. Topics 135 7. HIPAA: Misc. Topics 120 8. MS Word : Misc. Topics 78 9. Customer Service 59 10. Office Conflict: Misc. Topics 55
  • 22.
    SkillSoft Activity: LeastPerforming Departments* 0 Score- Academic Affairs, Anthropology, Board of Trustees, Chemistry, Dean of Students, Earth Sciences, Economics, Educational Foundations, Journalism & Mass Communications, Political Science, UNC Visa Card, University College, Upward Bound. (13) 0.01 Score- CIE, Dietetics, Criminal Justice, Education Technology, Hispanic Studies, Mathematical Sciences, Performing & Visual Arts, Psychological Sciences, Sports & Exercise Science (9) *At least 5 or more employees/staff members
  • 23.
    UNC Departmental Activityat a Glance  158 total departments as reported during registrations  All 11 but registered for at least one CETL activity from 7/1/2006 through 6/30/2014: 93.04% (excepting the Bresnahan Halstead Center, the Hewitt Center, KSRI Radio, Office of Undergraduate Research, Study Abroad Center, Technical Support Center, UNC Army ROTC, University Advancement, UNC Visa Card, UNC Wells Fargo, and the Writing Center, with some of these departments overlapping with those that do participate)  94 of 158 total departments registered for at least one SkillSoft course from 7/1/2006 through 12/31/15: 59.49%
  • 24.
    SkillSoft Notes  Total,Female Participants 327 62.6%  Total, Male Participants 195 37.4%  Of the 3861 UNC individual registrants in either CETL or SkillSoft activities from 7/1/2006 through 6/30/2014: - An est. 6.0% took the UNC Emergency Course - An est. 7.4% took the Workplace Safety Course - An est. 8.1% took the Sexual Harassment Course - An est. 3.7% took the Cyber Security Course
  • 25.
    CETL Top IndividualPerformers* 1.Chris Vegter Mon 74 14.Lori Clukey Nurs 40 2.Angie Kaponen Assm 61 15.Anna Williams MLang 40 3.Christina Taylor Mon 53 16.P.Escobar CChav 39 4.Karen Jennison Soc 52 17.S.McGuire GenAcc 38 5.Cateline Corbin MGarv 51 18.K.Hessler Nurs 37 6.Kim Black Assm 49 19.E Rodriguez CChav 36 7.Jennifer Griffin ASA 49 20.G Canales HispSt 36 8.Valerie Middleton TeaEd 48 21.C.Marston Econ 36 9.Sally Aleman Registr 44 22.Dianna Gray SES 35 9.Sherri Lancton ExCam 43 23.Aldo Romero HisStud 35 10.Denise Connell Econ 43 24.Paul Hodapp Phil 34 11.Lynda Woodson Nurs 42 25.Jan Riegel HuSci 34 12.Jennifer Cook ASA 40 26.G.Shimokawa Library 33 *Incl.both workshops & classes; only includes actually attended activities
  • 26.
    SkillSoft Top IndividualPerformers* 1.Connie Baca HCen 44 14.Kat Hojio IMTech19 2.Janie Voris Mon 36 15.Jess Furr IMTech19 3.Paul Sharp IMTech33 16.Sue Ditton Dining 18 4.Julie Nava HR 32 17.MGebhardtDining 17 5.Julie Tacker HR 30 18.Lisa Finley Soc 16 6.Betty Rutt FacMgt27 T Schmidt IMTech16 7.Susan Deines FacMgt26 20.CJ Mizner IMTech15 Debra Miller HCen 26 K GallegosIMTech15 9.Toni Tassone NHSci 25 Dru Mark Dining 15 10.Eric Rees ExCam24 G Shimokawa Library15 11.George Bielinski HR 22 24.Deb Myers Library14 12.Nancy Becker Library20 Jan NelsonDining 14 13.Alain Begin Dining 20 *By total number of course registrations, including for the same course.
  • 27.
    Discussion: Some MajorTakeaways  Location matters; West campus departments participate in face-to- face CETL-facilitated activities substantially more often; however, East and Central campus departments participate in online delivery (SkillSoft) learning more than do West Campus departments.  Proportionately, faculty engage in CETL sponsored workshops and classes about as often as staff overall, but staff utilize SkillSoft far more often.  Since 2006, overall participation in both workshops & classes and SkillSoft has been trending upwards overall, with 2013-14 proving to be a record year for overall participation at UNC.  The breadth of campus-wide participation in CETL-sponsored activity including SkillSoft is impressive; depth? Not so much.  Over half of campus SkillSoft activity focused on regulatory coursework such as Emergency, Sexual Harassment & Safety training  Non-software & device training has overtaken software & device training by individual participation percentage since 2005-06.  Females tend to dominate CETL-sponsored activities (by number).
  • 28.
    Further Research  Whyhas campus-wide participation in CETL-sponsored professional development activities substantively and steadily increased in a geometric fashion from 2001-02, from when the earliest teaching & learning center records were kept? Particularly when CETL staffing has either held steady or actually decreased in number in recent years?  Does participation in CETL-sponsored professional development activities enhance individual job performance and career path development? If so, what specific stories, measures, and examples might support such a claim?