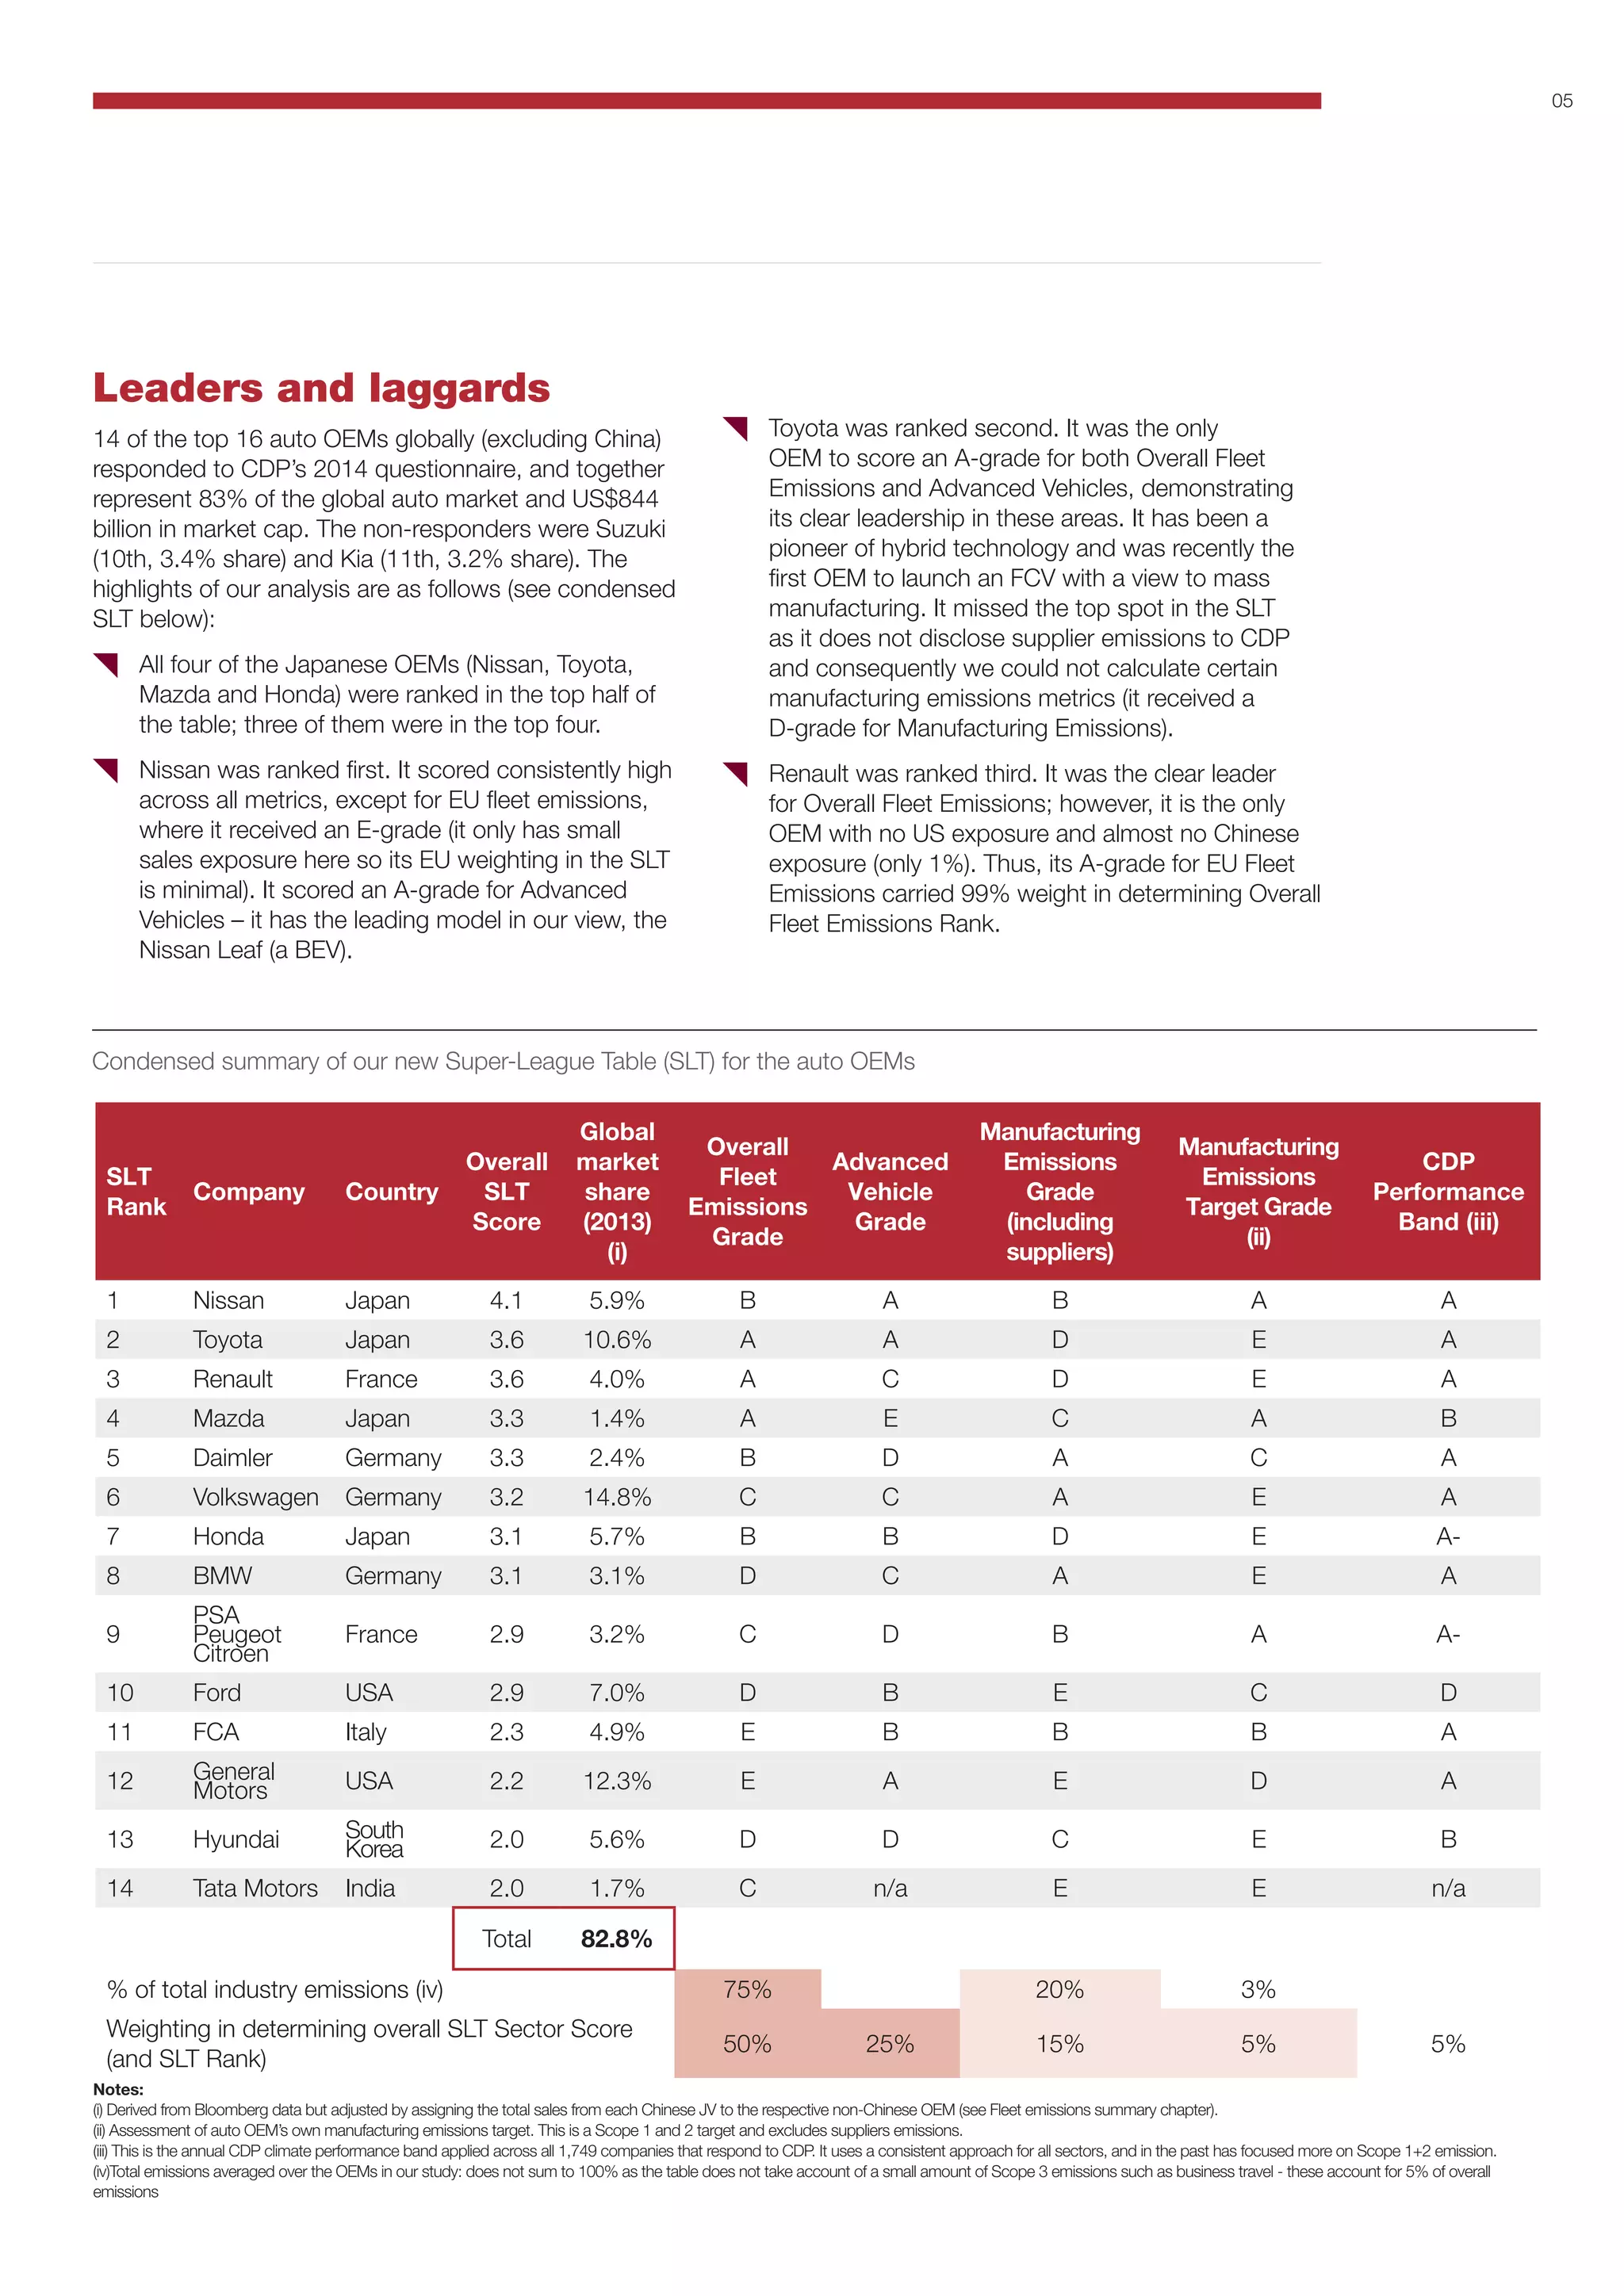
The document analyzes automotive companies' emissions performance and positions them in a "Super-League Table" ranking. It finds that Japanese automakers like Nissan, Toyota, and Mazda rank highly due to strong fleet emissions reductions and investments in advanced vehicles. German automakers also perform well overall. American automakers GM and Ford rank towards the bottom due to the high-emitting vehicles demanded in their home US market. The analysis suggests companies towards the top of the ranking are lower-risk investments as tightening emissions regulations could financially penalize laggards.
Experience Mazda Zoom Zoom Lifestyle and Culture by Visiting and joining the Official Mazda Community at http://www.MazdaCommunity.org for additional insight into the Zoom Zoom Lifestyle and special offers for Mazda Community Members. If you live in Arizona, check out CardinaleWay Mazda's eCommerce website at http://www.Cardinale-Way-Mazda.com
In 2005, General Motors (GM) – the world's largest automotive manufacturer is now stepping to the point, where strategic thinking, planning and breakthrough are necessary. Three consecutive years of global market share declines, high pressure from world-class competitors, health care and retirement burdens, and rapid changes in consumer profile are the reason of that. How GM should minimize such threats and in the same time capture potential opportunities with its strengths is very interesting issue in term of strategic management and policy.
This presentation was composed to fulfill the requirement of my masters degree subject. The analysis and solution in this presentation were originated from a business case blended with my knowledge, research and idea. Even though, they may not 100% correct, or not reflect the current situation and solutions of GM, I still hope that this presentation would help those who is interested the situations occurred in 2005
This presentation offers a high-level strategy to allow FIAT to successfully market small, efficient cars to North American consumers.
It is not complete as such, but intended to stimulate dialogue and additional ideas.
Global Medium and Heavy Duty Truck Transmission StudySilpa Paul
Better fuel economy, narrowing price difference with Manual Transmission (due to improving economies of scale) alongside exacerbating skilled driver shortage and increasing level of automated driving across developed economies are expediting the adoption of electronically controlled transmissions: Automated Manual Transmissions (AMTs) and Automatic Transmissions (ATs). This research service offers an outlook of the global medium- and heavy-duty commercial truck transmissions market for the period 2015–2025. The study also offers actionable information and forecasts of the key trends and metrics that are likely to influence the growth and development of the global medium- and heavy- duty commercial truck transmission systems market.
Timeline of events - The decline and fall of the Romanov Dynasty.Matt White
This is a slide presentation I put together for my Year 11 Modern History class. It traces the key issues and events that led to the fall of the Romanov Dynasty 1917. Sources are from websites and Wikipedia. Designed to give students and overview so they can investigate further.
The car industry is one of the fastest-growing sectors globally, a significant employer and R&D investor, and one of the EU's most powerful sectors. Even so, this industry has recently undergone several structural reforms and geographical transitions. For this cause, it appears critical to assess the automotive industry's competitiveness on a national basis, observe long-term developments around the EU, and place them in a global sense. This research examines the possible rewards of a contract, how they play out in various situations, and the potential pitfalls. The study also calculates trade diversion consequences and discusses the strategic ramifications of a free trade deal between the EU and India for Southeast Asia. This article also employs a traditional statistical study of discovered symmetrical comparative advantage indices to identify patterns that characterize the European automotive industry's shape and long-term growth. The authors point to significant shifts in manufacturing and exports from conventional Western European carmakers to new EU member states and the United States and Canada to modern, fast-growing developing countries in Southeast Asia and Latin America.
Individual-level data are used to analysis, including customer review and internal communication in this study. A sample of around 100 workers was used to gather information. To test the study's cross-level hypotheses, I used hierarchical linear modelling (HLM), a type of random coefficient model explicitly designed to accommodate nested data structures. The results indicated that industry and global or internal factors was affecting the trade and major affects the national’s economy and globally.
This in-depth research offers a perspective on where the automotive industry is headed. It is based on many discussions and interviews with the top management of leading automotive original equipment manufacturers (OEMs) and an analysis of data from the top 17 (by sales) global OEMs, which comprise 80 percent of global sales. This work was designed to answer the most crucial questions:
> How are the industry and the market evolving?
> What are the future challenges and opportunities?
> How can OEMs benefit from these new challenges and opportunities?
> What are the implications for different market segments?
Automotive Market – Volume Stagnation Executive Summary
> On the powertrain side, the development of e-mobility is gaining a lot of momentum – while technological hurdles prevail and a convincing business case for the end customer is nowhere close to accomplishment yet, tightened emission regulations by (supra-)national and local bodies will likely have a catalytic impact over the coming years > I expect the market for electrified vehicles to multiply by a factor of 7-10x over the next decade – leading to substantial growth potential for e-powertrain component suppliers while driving the traditional combustion engine segment more and more into a commodity corner > At the same time, autonomous driving is becoming a reality – with OEMs as well as new players combining it with vehicle connectivity (and potentially e-mobility), I expect that completely new business models for automobile usage and ownership will emerge within the next ten years > Suppliers will face a market for assisted/automated driving components that is expected to grow by a factor of five until 2025– at the same time, they will likely face fierce competition from new players formerly outside of the automotive supplier industry keen to capture that revenue and profit pool > M&A is expected to grow in relevance for automotive suppliers to permit them to gain a technological edge in a faster moving environment or to maintain a (scale-driven) competitive edge in those segments gradually losing ground given the industry changes – However, the complexity of acquisition-led growth will continue to be substantial due to intense competition for attractive targets, high price levels and the challenges of global post-merger integrations > Ultimately, this more volatile and rapidly changing environment requires suppliers to speed up their flexibility and agility in developing (and running) their business – thinking well ahead of the next vehicle generation, scenario planning and a more innovative approach to product development will be crucial success factors for companies in paint/bodyshop/powertrain business need to partner with material and technology innovators to be among the top performers of the future, even a higher vertical integration needs to be considered to survive disruptive trends.
𝘼𝙣𝙩𝙞𝙦𝙪𝙚 𝙋𝙡𝙖𝙨𝙩𝙞𝙘 𝙏𝙧𝙖𝙙𝙚𝙧𝙨 𝙞𝙨 𝙫𝙚𝙧𝙮 𝙛𝙖𝙢𝙤𝙪𝙨 𝙛𝙤𝙧 𝙢𝙖𝙣𝙪𝙛𝙖𝙘𝙩𝙪𝙧𝙞𝙣𝙜 𝙩𝙝𝙚𝙞𝙧 𝙥𝙧𝙤𝙙𝙪𝙘𝙩𝙨. 𝙒𝙚 𝙝𝙖𝙫𝙚 𝙖𝙡𝙡 𝙩𝙝𝙚 𝙥𝙡𝙖𝙨𝙩𝙞𝙘 𝙜𝙧𝙖𝙣𝙪𝙡𝙚𝙨 𝙪𝙨𝙚𝙙 𝙞𝙣 𝙖𝙪𝙩𝙤𝙢𝙤𝙩𝙞𝙫𝙚 𝙖𝙣𝙙 𝙖𝙪𝙩𝙤 𝙥𝙖𝙧𝙩𝙨 𝙖𝙣𝙙 𝙖𝙡𝙡 𝙩𝙝𝙚 𝙛𝙖𝙢𝙤𝙪𝙨 𝙘𝙤𝙢𝙥𝙖𝙣𝙞𝙚𝙨 𝙗𝙪𝙮 𝙩𝙝𝙚 𝙜𝙧𝙖𝙣𝙪𝙡𝙚𝙨 𝙛𝙧𝙤𝙢 𝙪𝙨.
Over the 10 years, we have gained a strong foothold in the market due to our range's high quality, competitive prices, and time-lined delivery schedules.
Fleet management these days is next to impossible without connected vehicle solutions. Why? Well, fleet trackers and accompanying connected vehicle management solutions tend to offer quite a few hard-to-ignore benefits to fleet managers and businesses alike. Let’s check them out!
What Does the PARKTRONIC Inoperative, See Owner's Manual Message Mean for You...Autohaus Service and Sales
Learn what "PARKTRONIC Inoperative, See Owner's Manual" means for your Mercedes-Benz. This message indicates a malfunction in the parking assistance system, potentially due to sensor issues or electrical faults. Prompt attention is crucial to ensure safety and functionality. Follow steps outlined for diagnosis and repair in the owner's manual.
Comprehensive program for Agricultural Finance, the Automotive Sector, and Empowerment . We will define the full scope and provide a detailed two-week plan for identifying strategic partners in each area within Limpopo, including target areas.:
1. Agricultural : Supporting Primary and Secondary Agriculture
• Scope: Provide support solutions to enhance agricultural productivity and sustainability.
• Target Areas: Polokwane, Tzaneen, Thohoyandou, Makhado, and Giyani.
2. Automotive Sector: Partnerships with Mechanics and Panel Beater Shops
• Scope: Develop collaborations with automotive service providers to improve service quality and business operations.
• Target Areas: Polokwane, Lephalale, Mokopane, Phalaborwa, and Bela-Bela.
3. Empowerment : Focusing on Women Empowerment
• Scope: Provide business support support and training to women-owned businesses, promoting economic inclusion.
• Target Areas: Polokwane, Thohoyandou, Musina, Burgersfort, and Louis Trichardt.
We will also prioritize Industrial Economic Zone areas and their priorities.
Sign up on https://profilesmes.online/welcome/
To be eligible:
1. You must have a registered business and operate in Limpopo
2. Generate revenue
3. Sectors : Agriculture ( primary and secondary) and Automative
Women and Youth are encouraged to apply even if you don't fall in those sectors.
Why Is Your BMW X3 Hood Not Responding To Release CommandsDart Auto
Experiencing difficulty opening your BMW X3's hood? This guide explores potential issues like mechanical obstruction, hood release mechanism failure, electrical problems, and emergency release malfunctions. Troubleshooting tips include basic checks, clearing obstructions, applying pressure, and using the emergency release.
5 Warning Signs Your BMW's Intelligent Battery Sensor Needs AttentionBertini's German Motors
IBS monitors and manages your BMW’s battery performance. If it malfunctions, you will have to deal with an array of electrical issues in your vehicle. Recognize warning signs like dimming headlights, frequent battery replacements, and electrical malfunctions to address potential IBS issues promptly.
In this presentation, we have discussed a very important feature of BMW X5 cars… the Comfort Access. Things that can significantly limit its functionality. And things that you can try to restore the functionality of such a convenient feature of your vehicle.
Symptoms like intermittent starting and key recognition errors signal potential problems with your Mercedes’ EIS. Use diagnostic steps like error code checks and spare key tests. Professional diagnosis and solutions like EIS replacement ensure safe driving. Consult a qualified technician for accurate diagnosis and repair.
Things to remember while upgrading the brakes of your carjennifermiller8137
Upgrading the brakes of your car? Keep these things in mind before doing so. Additionally, start using an OBD 2 GPS tracker so that you never miss a vehicle maintenance appointment. On top of this, a car GPS tracker will also let you master good driving habits that will let you increase the operational life of your car’s brakes.
What Could Cause The Headlights On Your Porsche 911 To Stop WorkingLancer Service
Discover why your Porsche 911 headlights might flicker out unexpectedly. From aging bulbs to electrical gremlins and moisture mishaps, we're delving into the reasons behind the blackout. Stay tuned to illuminate the road ahead and ensure your lights shine bright for safer journeys.
The Octavia range embodies the design trend of the Škoda brand: a fusion of
aesthetics, safety and practicality. Whether you see the car as a whole or step
closer and explore its unique features, the Octavia range radiates with the
harmony of functionality and emotion
"Trans Failsafe Prog" on your BMW X5 indicates potential transmission issues requiring immediate action. This safety feature activates in response to abnormalities like low fluid levels, leaks, faulty sensors, electrical or mechanical failures, and overheating.
4. 04
Linking emissions-related metrics to earnings
1 Derived from Bloomberg data but adjusted by assigning total sales made by Chinese joint ventures (JVs) to their respective non-Chinese OEM partner (see fleet emissions summary).
2 Averaged over the auto OEMs that responded to the CDP Climate Change Questionnaire
Overview
In this report, we launch our new Super-League Table
(SLT) for the global automobile original equipment
manufacturers (OEMs).
We rank those companies that responded to CDP’s
Climate Change questionnaire, which account for 83%1
of the global auto market by sales volume, based on
a number of different emissions-related metrics. When
taken in aggregate, we believe these metrics could have
a material impact on a company’s earnings in a global
auto market where emissions regulation is tightening and
there are significant penalties for non-compliance.
We highlight those companies that are best positioned
to benefit from this regulatory change and those that will
struggle without adapting their existing business models.
Scope of report: emissions
Our SLT focuses on three key areas:
Fleet emissions: these account for 75% of total
emissions for the auto industry2
.
Advanced Vehicles: Battery Electric Vehicles
(BEVs), Plug-in Hybrid Electric Vehicles (PHEVs)
and Fuel Cell Vehicles (FCVs) which will increasingly
contribute to lowering total emissions.
Manufacturing emissions: these account for 20%
of total emissions, split roughly as 17% supplier
emissions and 3% auto OEMs own manufacturing
emissions (mostly assembly).
Scope of report: geographies
Our study spans the three largest auto markets globally,
which together account for 75% of global auto demand.
The EU (22% share): a leader in emissions
regulations, it has by far the lowest fleet-wide
emissions (on a per unit basis). Vehicle sales in the
EU have been declining over the last decade or so.
The US (25% share): by far the highest fleet-wide
emissions (on a per unit basis). US consumers
demand more super-sized powerful cars. Fleet
emissions rules and penalties have been in place
since the 1980s, though there has been a culture of
non-compliance, with penalties seen as an ongoing
business cost that is passed on to consumers. This
is set to change under the new EPA regulations that
kick in from a penalty perspective in 2016.
China (28% share): is the largest auto market
globally, having tripled in size from 2008-2013. It
could be an explosive market for Advanced Vehicles
if it becomes more stringent in its megacity Low
Emission Zones (LEZs). The Chinese government
has very aggressive targets for total sales of BEVs
and PHEVs of 5 million units by 2020 – achieving
this would imply sales of approximately 2 million
per annum by 2020, we estimate, which roughly
equates to total annual car sales in the UK (or India).
We launch our new ‘Super-League Table’ which ranks companies based on a num-
ber of emissions-related metrics which in aggregate could have a material impact
on company performance
Leaders are: Nissan, Toyota, and Renault
Laggards are: Tata Motors (owner of Jaguar Land Rover), Hyundai,
and General Motors
5. 05
Leaders and laggards
14 of the top 16 auto OEMs globally (excluding China)
responded to CDP’s 2014 questionnaire, and together
represent 83% of the global auto market and US$844
billion in market cap. The non-responders were Suzuki
(10th, 3.4% share) and Kia (11th, 3.2% share). The
highlights of our analysis are as follows (see condensed
SLT below):
All four of the Japanese OEMs (Nissan, Toyota,
Mazda and Honda) were ranked in the top half of
the table; three of them were in the top four.
Nissan was ranked first. It scored consistently high
across all metrics, except for EU fleet emissions,
where it received an E-grade (it only has small
sales exposure here so its EU weighting in the SLT
is minimal). It scored an A-grade for Advanced
Vehicles – it has the leading model in our view, the
Nissan Leaf (a BEV).
Toyota was ranked second. It was the only
OEM to score an A-grade for both Overall Fleet
Emissions and Advanced Vehicles, demonstrating
its clear leadership in these areas. It has been a
pioneer of hybrid technology and was recently the
first OEM to launch an FCV with a view to mass
manufacturing. It missed the top spot in the SLT
as it does not disclose supplier emissions to CDP
and consequently we could not calculate certain
manufacturing emissions metrics (it received a
D-grade for Manufacturing Emissions).
Renault was ranked third. It was the clear leader
for Overall Fleet Emissions; however, it is the only
OEM with no US exposure and almost no Chinese
exposure (only 1%). Thus, its A-grade for EU Fleet
Emissions carried 99% weight in determining Overall
Fleet Emissions Rank.
SLT
Rank
Company Country
Overall
SLT
Score
Global
market
share
(2013)
(i)
Overall
Fleet
Emissions
Grade
Advanced
Vehicle
Grade
Manufacturing
Emissions
Grade
(including
suppliers)
Manufacturing
Emissions
Target Grade
(ii)
CDP
Performance
Band (iii)
1 Nissan Japan 4.1 5.9% B A B A A
2 Toyota Japan 3.6 10.6% A A D E A
3 Renault France 3.6 4.0% A C D E A
4 Mazda Japan 3.3 1.4% A E C A B
5 Daimler Germany 3.3 2.4% B D A C A
6 Volkswagen Germany 3.2 14.8% C C A E A
7 Honda Japan 3.1 5.7% B B D E A-
8 BMW Germany 3.1 3.1% D C A E A
9
PSA
Peugeot
Citroen
France 2.9 3.2% C D B A A-
10 Ford USA 2.9 7.0% D B E C D
11 FCA Italy 2.3 4.9% E B B B A
12 General
Motors USA 2.2 12.3% E A E D A
13 Hyundai South
Korea 2.0 5.6% D D C E B
14 Tata Motors India 2.0 1.7% C n/a E E n/a
Total 82.8%
% of total industry emissions (iv) 75% 20% 3%
Weighting in determining overall SLT Sector Score
(and SLT Rank)
50% 25% 15% 5% 5%
Notes:
(i) Derived from Bloomberg data but adjusted by assigning the total sales from each Chinese JV to the respective non-Chinese OEM (see Fleet emissions summary chapter).
(ii) Assessment of auto OEM’s own manufacturing emissions target. This is a Scope 1 and 2 target and excludes suppliers emissions.
(iii) This is the annual CDP climate performance band applied across all 1,749 companies that respond to CDP. It uses a consistent approach for all sectors, and in the past has focused more on Scope 1+2 emission.
(iv)Total emissions averaged over the OEMs in our study: does not sum to 100% as the table does not take account of a small amount of Scope 3 emissions such as business travel - these account for 5% of overall
emissions
Condensed summary of our new Super-League Table (SLT) for the auto OEMs
6. 06
The German OEMs were all placed in the top-mid
range table. Daimler was fifth, VW, the world’s
largest auto OEM, is ranked sixth and BMW eigth.
Daimler (owners of Mercedes and Smart cars)
scored a B-grade for Overall Fleet Emissions due
to an impressive track record of fleet emissions
reductions in Europe. We estimate that if this
progress is maintained its fleet will be one of the
most efficient in the EU by 2021. Smart cars will
increasingly contribute.
We note that the rankings in a large portion of the
table are very tight. There was a narrow range for
the Overall SLT Score between fourth and tenth
places. For instance, if French OEM, PSA Peugeot
Citroen which ranked ninth had received a B-grade
rather than a D-grade for Advanced Vehicles, it
would have been propelled up to fourth place.
This suggests that there is everything to fight for
amongst the OEMs. Technological advancements
could see a dramatic change in the rankings in
future iterations of our SLT.
The US OEMs were both ranked towards the
bottom of the SLT, which is not surprising given their
market-leading positions in (and sales exposure
to) the US market. US consumers tend to demand
more super-sized cars (which have notably higher
emissions). GM was third from bottom – it was
graded E for Overall Fleet Emissions but was
saved from bottom rank by its A-grade for
Advanced Vehicles. Ford was ranked tenth
(or fifth from bottom).
Tata Motors is the bottom-ranked OEM. This is
partly due to an incomplete response to CDP’s
questionnaire but also due to its high-emitting
Jaguar Land Rover brands coupled with the fact
that it is the only OEM in our analysis that is yet to
release an Advanced Vehicle.
FCA was the worst performer from a fleet emissions
perspective, which is perhaps not quite so
surprising given that its US-based Chrysler division
has a high-emitting vehicle range, coupled with
the fact that FCA has consistently made one of the
lowest investments in RD over a number of years.
That said, FCA shows some promise with a B-grade
achieved for Advanced Vehicles.
Hyundai was the most consistent poor performer,
with D-grades for its fleet emissions in each of
the EU, US and China, and also for its Advanced
Vehicle Grade. It was hardly surprising that Hyundai
ranked second from bottom.
The Japanese OEMs may have performed even
better had our analysis extended to the Japanese
market (which like the EU is a relatively low-emission
market); a lack of credible data prevented this. That
said, they each have more than 50% sales exposure
(before our normalization) to the geographies
covered in this report.
Penalties
General Motors and FCA are the only two OEMs
that are at notable risk of a penalty in both the EU
and US; these penalties could potentially equate
to a combined US$1.7 billion (33% of EBIT3
) and
US$574 million (15% of EBIT) respectively.
In addition, we estimate that Ford is at risk of a
penalty in the US of US$889 million (or 16% of EBIT).
BMW, Volkswagen, Daimler, Hyundai, and Nissan
are all also at risk of a penalty in either the EU or US.
The potential penalties facing OEMs at risk of
missing their targets are CDP estimates. They
do not take into account any credits available to
OEMs to assist the transition of their fleets to meet
regulatory targets. The penalties are for illustrative
purposes only.
We note that CAFE fleet emissions penalties have
been levied in the US since the 1980s and it is not
uncommon to see OEMs pay fines into the tens of
millions of US dollars. We note that recently in 2011,
Daimler paid a fine of US$16 million and Tata Motors
paid a fine of US$14 million. The highest fine paid so
far has been US$90 million by Daimler-Chrysler (as it
was then) in 2006.
See the Fleet emissions summary chapter for more
detail on the potential penalties.
3 EBIT – Earning Before Interest Tax
7. 07
Linking our findings to
investment choices
We recognize that investment decisions are based on a
multitude of different factors and that some of these
factors can be misaligned with emissions reductions.
Our SLT rankings are not intended as definitive winners
and losers for investment purposes, more as a proxy
for business-readiness in an industry where there is
significant regulatory tightening across all major vehicle
markets.
We would flag that companies towards the bottom of
our SLT are possibly higher risk investments than those
towards the top. However, we appreciate an investment
such as Tata Motors, a leader in the fast growing SUV
segment of the vehicle market, could well be able to
pass penalties on to consumers of its premium vehi-
cles without a major impact on earnings. On this basis,
investors might view Tata Motors as a high(er) risk but
potentially high reward investment.
Area in Super-
League table
Link to company earnings Metrics Weighting
Fleet emissions Significant financial penalties for non-compliance.
(i) EU fleet emissions (gCO2
/km)
(ii) US fleet emissions (mpg)
(iii) China fleet emissions (L/100km)
50%
Advanced Vehicles
Potentially explosive market growth opportunity,
in particular in China. Early movers will benefit.
Laggards may miss out.
(i) Technical grade
(ii) Sales momentum/first mover grade
(iii) other considerations i.e. technology
collaborations, domestic market strength
25%
Manufacturing
emissions
Efficient manufacturing can enhance financial
performance. Manufacturing emissions
(intensity) reduction is a proxy for increased
manufacturing efficiency
(i) Manufacturing emissions intensity
(ii) Reduction in intensity 2011-13
(iii) Supply chain engagement (by % spend)
(iv) Emissions reduction target analysis
20%
CDP climate
performance band
A good annual CDP score is a proxy for a generally
well run company. Well run companies are better
placed to succeed in a changing marketplace.
(i) CDP 2014 climate change
performance band
5%
Source: CDP
A summary of key areas, associated metrics and relative weighting in the Super-League Table
8. 08
Methodology
We score each OEM based on a number of different
metrics which are first ranked and then graded A to E,
with A being best and E the worst.
The metrics can be categorised into three key areas:
1) Fleet emissions: we analyze fleet emissions for each
OEM across three major auto markets: the EU, the US
and China. We use historic emissions data to assess
whether each OEM is on track or off track to meet the
regulatory emissions targets in each of these markets;
and if off track, the potential financial impact.
2) Advanced Vehicles (AVs): we perform a detailed
review of most available models of BEVs and
PHEVs globally. We also consider a number of other
factors including each OEM’s exposure to FCVs,
the commitment of their domestic markets towards
charging station build-out and consumer subsidies, and
sales momentum of BEVs, PHEVs and FCVs per OEM.
3) Manufacturing emissions: we assess each OEM
across four key metrics related to manufacturing
emissions. The first relates solely to each OEM’s own
manufacturing emissions (known as Scope 1 and Scope
2 emissions), the second relates solely to their suppliers’
emissions (known as Scope 3 – supplier emissions), and
the remaining two relate to manufacturing emissions as
a whole.
Each of the above focus areas has a separate chapter
within this report, and the precise methodology for
how we rank and grade each metric is described in the
relevant chapter.
In addition to the three key areas, we also include CDP’s
climate performance band for 2014 in the SLT. It scores
the 1,749 companies that respond to CDP’s main
questionnaire based on their climate change readiness.
A high score can infer a well-run business with a
forward-looking management team, not just focused on
the short term.
The table on the previous page summaries the key areas
of the SLT and the weightings we have assigned to each
area, according to our sense of their potential impact on
company performance.
In determining the Overall SLT Score and therefore
the SLT Rank, we assign a number (1 to 5) to each
of the grades for the key areas above (and the CDP
climate performance band), with A=5 down to E=1. We
then apply the weightings in the table above to each
numbered grade and aggregate them to arrive at the
Overall SLT Score and Overall SLT Rank.
Note that the Overall Fleet Emissions Grade is an
exception to the above procedure. Rather than applying
the weighting to the numbered grade, we instead apply
the weighting to the Overall Fleet Emissions Score. As
fleet emissions carry so much weight (50%) in the SLT,
we believe using the Overall Fleet Emissions Score
(rather than the grade) gives a more accurate result.
9. 09
For further study
Interesting areas for further investigation include:
Different profiles for forecasting
reductions in fleet emissions
rather than assuming a constant
percentage reduction across the
forecast periods for all OEMs.
Such profiles might include
a period of steady emissions
reductions followed by a period
of faster reductions as new
technologies are implemented.
One could also look to vary the
emissions reduction profile for
each OEM and link it to forecast/
targeted RD spend and the
release of new technologies,
model renewal cycles or changes
to average fleet mass.
An extension of the fleet emissions
study to other regions including
Japan, India, and Latin America,
and the level of potential penalties
for non-compliance, if applicable.
Expand the study to include other
pollutants arising from vehicles,
such as nitrogen oxides, fine
particulate matter, volatile organic
compounds, carbon monoxide,
and sulphur dioxide, amongst
others.
Incorporate a ‘lobbying’ grade
into the SLT to assess which
companies are most involved in
shaping the future.
An extension of our study to
include light commercial vehicles,
as well as trucks (and heavier
vehicles) where relevant.
Further work on the component
suppliers and each OEM’s
exposure to other components
used to optimize existing
combustion engine technology,
for example, super-chargers, fly-
wheels etc.
Adding a consumer review score
for the main BEVs and PHEVs on
the market as another component
in determining the Advanced
Vehicle Grade.
The cost per OEM of complying
with the fleet emissions targets
in each region and whether they
would need to increase their RD
spend to meet these targets.
11. 11
CDP contacts
Frances Way
Co-Chief Operating Officer
James Hulse
Head of Investor Initiatives
James Magness
Head of Research,
Investor Initiatives
+44 (0) 20 3818 3935
james.magness@cdp.net
Emanuele Fanelli
Senior Vice President,
Investor Initiatives
+ 44 (0) 203 818 3961
Emanuele.Fanelli@cdp.net
Chris Fowle
Vice President, Investor
Initiatives North America
+1 646 517 1459
Chris.Fowle@cdp.net
Cynthia Simon
Senior Manager, Investor
Initiatives
North America
+1 646 517 1469
cynthia.simon@cdp.net
Henry Repard
Project Officer,
Investor Initiatives
+44 (0) 203 818 3928
henry.repard@cdp.net
CDP Board of Trustees
Chairman: Alan Brown
James Cameron
Climate Change Capital ODI
Ben Goldsmith
WHEB
Chris Page
Rockefeller Philanthropy
Advisors
Jeremy Smith
Takejiro Sueyoshi
Tessa Tennant
Martin Wise
Relationship Capital Partners
CDP UK
3rd Floor, Quadrant House,
4 Thomas More Square,
Thomas More Street
London, E1W 1YW
United Kingdom
Tel: +44 (0) 203 818 3900
@cdp
www.cdp.net
info@cdp.net
Important Notice:
CDP is not an investment advisor, and makes no representation regarding the advisability of investing in any particular company or investment fund or other vehicle. A decision to invest in any such invest-
ment fund or other entity should not be made in reliance on any of the statements set forth in this publication. While CDP has obtained information believed to be reliable, it makes no representation or
warranty (express or implied) as to the accuracy or completeness of the information and opinions contained in this report, and it shall not be liable for any claims or losses of any nature in connection with
information contained in this document, including but not limited to, lost profits or punitive or consequential damages.
The contents of this report may be used by anyone providing acknowledgement is given to CDP. This does not represent a license to repackage or resell any of the data reported to CDP and presented in
this report. If you intend to repackage or resell any of the contents of this report, you need to obtain express permission from CDP before doing so.