SlideShare a Scribd company logo
0
5
10
Construction Vital Statistics February 2015
at a Glance
Unemployment Rate
(Bureau of Labor Statistics)
12.8%5.5%
Overall
Current Month Year-over-Year
Construction
6.7% 10.6%
Housing Permits & Starts
(U.S. Census Bureau & Dept. of Housing and Urban Dev.)
TOTAL PERMITS
Current Month:
3.0% vs.
1 yr. Earlier: 7.7%
TOTAL STARTS
Current Month:
-17.0% vs.
1 yr. Earlier: -3.3%
Nonresidential Construction Material Prices (Producer Price Index)
By the
Numbers: Current Month: 0.4%
Nonresidential Construction Spending (U.S. Census Bureau)
Construction Backlog
Indicator
(Associated Builders & Contractors/4th Quarter 2014)
8.7 vs. 1 yr. Earlier: 8.3
Construction Owner
Confidence Index
(Associated Builders & Contractors/1st Half of 2014)
Readings above 50 indicate growth
SALES EXPECTATIONS
rose from 63.2 to 68.2
PROFIT MARGIN
EXPECTATIONS
expanded from 57.5 to 60.0
STAFFING LEVEL
INTENTIONS
moved higher from 62.2 to 65.0
Year-over-year change: -4.9%
January 2015: -2.0% Year-over-year change: 4.8%
vs.
vs.
February 2015 at a Glance
Readings above 50 indicate growth, while readings below 50 are unfavorable.
Any Architecture Billing Index Score above 50 signifies growth - it is a leading economic indicator that provides an approximately nine to 12 month glimpse into the future of nonresidential
construction spending activity.
It is a monthly measure of the first (or initial) report for nonresidential building projects in planning, which have been shown to lead construction spending for nonresidential buildings by
a full year. Since reaching bottom in July 2011 at a level of 77.1 (2000=100), the index has been trending up.
Rates as of mid month.
1
2
3
4
1
2
3
4
3rd Qtr. 4th Qtr.
1st 1/2 ‘14
Construction Backlog Indicator (Months)
Current Backlog
Backlog from a year ago
Construction Owner Confidence Index
Sales Expectations
Profit Margin Expectations
Staffing Level Intentions
National Unemployment Rate
Overall current month
Overall year-over-year
Construction current month
Construction year-over-year
Arizona Unemployment Rate
Overall current month
California Unemployment Rate
Overall current month
Nevada Unemployment Rate
Overall current month
National Housing Permits and Starts
Permits - Total
Permits - Total from twelve months earlier
1 - Family - change from previous month
1 - Family - change year-over-year
5 + Units - change from previous month
5 + Units - change year-over-year
Starts - Total
Starts - Total from twelve months earlier
1 - Family - change from previous month
1 - Family - change year-over-year
5 + Units - change from previous month
5 + Units - change year-over-year
West Housing Permits and Starts
Permits - Total
Permits - Total from twelve months earlier
1 - Family - change from previous month
1 - Family - change year-over-year
Starts - Total
Starts - Total from twelve months earlier
1 - Family - change from previous month
1 - Family - change year-over-year
Nonresidential Construction Material Prices
Current Month
Change year-over-year
Nonresidential Construction Spending
Previous Month
Change year-over-year
AIA - Architecture Billing Index
Dodge Momentum Index - Commercial Building
Interest Rates
I-Month LIBOR
WSJ Prime Rate
5 Year US Treasury Rate
10 Year US Treasury Rate
Oct. ‘14
8.8
8.2
68.2
60.0
65.0
5.8%
7.2%
6.4%
9.0%
6.6%
7.2%
7.2%
4.8%
1.2%
1.4%
2.4%
8.0%
-1.5%
-2.8%
7.8%
4.2%
15.4%
-15.5%
-6.8%
-21.6%
-17.6%
2.3%
-3.6%
-10.9%
-0.5%
2.7%
-16.9%
-1.1%
0.5%
-1.0%
4.2%
53.7
130.2
0.1535%
3.25%
1.66%
2.63%
Nov. ‘14
5.8%
7.0%
7.5%
8.6%
6.6%
7.2%
7.1%
-5.2%
-0.2%
-1.2%
-0.9%
-11.1%
0.5%
-1.6%
-7.0%
-5.4%
-4.6%
7.6%
-11.9%
-5.6%
6.3%
6.8%
4.4%
28.1%
24.1%
-5.2%
-7.6%
-1.1%
-0.6%
1.0%
4.3%
50.9
132.6
0.1548%
3.25%
1.55%
2.12%
Dec. ‘14
5.6%
6.7%
8.3%
11.4%
6.6%
7.1%
7.0%
-1.9%
1.0%
4.5%
8.1%
-12.4%
-9.9%
4.4%
5.3%
7.2%
7.9%
-4.2%
0.3%
-20.5%
-17.9%
7.0%
4.1%
5.8%
3.5%
15.8%
21.6%
-1.7%
-1.9%
-1.0%
4.0%
52.2
138.0
0.1635%
3.25%
1.28%
1.76%
Jan. ‘15
8.7
8.3
5.7%
6.6%
9.8%
12.3%
6.6%
7.0%
7.1%
-0.7%
8.1%
-3.1%
5.8%
3.3%
13.8%
-2.0%
18.7%
-6.7%
16.3%
12.1%
24.5%
16.8%
26.4%
-6.7%
-2.8%
-3.4%
21.7%
-3.0%
5.3%
-2.1%
-4.6%
0.4%
5.9%
49.9
134.3
0.1682%
3.25%
1.48%
2.00%
The information within this table has been compiled from multiple data sources, including the Associated Builders & Contractors, the U.S. Census Bureau, the Department
of Housing and Urban Development (HUD), and the Producer Price Index. This information does not purport to be complete or all inclusive. For more information, please
visit each source site.
Feb. ‘15
5.5%
6.7%
10.6%
12.8%
6.5%
6.7%
7.1%
3.0%
7.7%
-6.2%
2.8%
19.9%
15.0%
-17.0%
-3.3%
-14.9%
0.7%
-21.6%
-9.50%
2.2%
16.3%
5.6%
13.6%
-18.2%
10.1%
-9.1%
10.4%
0.4%
-4.9%
-2.0%
4.8%
50.4
138.0
0.1721%
3.25%
1.41%
1.93%

More Related Content

What's hot

What's hot (20)

CBIZ MHM Construction Vital Statistics - July 2015
CBIZ MHM Construction Vital Statistics - July 2015CBIZ MHM Construction Vital Statistics - July 2015
CBIZ MHM Construction Vital Statistics - July 2015
 
Construction Vital Statistics - September 2015
Construction Vital Statistics - September 2015Construction Vital Statistics - September 2015
Construction Vital Statistics - September 2015
 
Phoenix Construction Vital Stats - June
Phoenix Construction Vital Stats - JunePhoenix Construction Vital Stats - June
Phoenix Construction Vital Stats - June
 
Construction Vital Statistics - May 2015
Construction Vital Statistics - May 2015Construction Vital Statistics - May 2015
Construction Vital Statistics - May 2015
 
Construction Vital Statistics - October 2015
Construction Vital Statistics - October 2015Construction Vital Statistics - October 2015
Construction Vital Statistics - October 2015
 
Construction Vital Statistics - April 2015
Construction Vital Statistics - April 2015Construction Vital Statistics - April 2015
Construction Vital Statistics - April 2015
 
Construction Vital Statistics - August 2015
Construction Vital Statistics - August 2015Construction Vital Statistics - August 2015
Construction Vital Statistics - August 2015
 
CBIZ MHM Construction Vital Statistics - April 2016
CBIZ MHM Construction Vital Statistics - April 2016CBIZ MHM Construction Vital Statistics - April 2016
CBIZ MHM Construction Vital Statistics - April 2016
 
Phoenix Construction Vital Stats - February
Phoenix Construction Vital Stats - FebruaryPhoenix Construction Vital Stats - February
Phoenix Construction Vital Stats - February
 
Construction Vital Statistics - March 2016
Construction Vital Statistics - March 2016Construction Vital Statistics - March 2016
Construction Vital Statistics - March 2016
 
Construction Vital Statistics - December 2015
Construction Vital Statistics - December 2015Construction Vital Statistics - December 2015
Construction Vital Statistics - December 2015
 
test
testtest
test
 
Phoenix Construction Vital Stats - December
Phoenix Construction Vital Stats - DecemberPhoenix Construction Vital Stats - December
Phoenix Construction Vital Stats - December
 
Construction Vital Statistics - June 2015
Construction Vital Statistics - June 2015Construction Vital Statistics - June 2015
Construction Vital Statistics - June 2015
 
Phoenix Construction Vital Stats - March
Phoenix Construction Vital Stats - MarchPhoenix Construction Vital Stats - March
Phoenix Construction Vital Stats - March
 
Construction Vital Statistics - January 2016
Construction Vital Statistics - January 2016Construction Vital Statistics - January 2016
Construction Vital Statistics - January 2016
 
Phoenix Construction Vital Stats - January
Phoenix Construction Vital Stats - JanuaryPhoenix Construction Vital Stats - January
Phoenix Construction Vital Stats - January
 
Construction Vital Statistics February 2018
Construction Vital Statistics February 2018Construction Vital Statistics February 2018
Construction Vital Statistics February 2018
 
Construction Vital Statistics - June 2016
Construction Vital Statistics - June 2016Construction Vital Statistics - June 2016
Construction Vital Statistics - June 2016
 
Construction Vital Statistics - May 2016
Construction Vital Statistics - May 2016Construction Vital Statistics - May 2016
Construction Vital Statistics - May 2016
 

Similar to Phoenix Construction Vital Stats - February 2015

Similar to Phoenix Construction Vital Stats - February 2015 (15)

Phoenix Construction Vital Stats - November
Phoenix Construction Vital Stats - NovemberPhoenix Construction Vital Stats - November
Phoenix Construction Vital Stats - November
 
Construction Vital Statistics - March 2015
Construction Vital Statistics - March 2015Construction Vital Statistics - March 2015
Construction Vital Statistics - March 2015
 
Construction Vital Statistics - August 2016
Construction Vital Statistics - August 2016Construction Vital Statistics - August 2016
Construction Vital Statistics - August 2016
 
Construction Vital Statistics March 2018
Construction Vital Statistics March 2018Construction Vital Statistics March 2018
Construction Vital Statistics March 2018
 
Construction Vital Statistics May 2017
Construction Vital Statistics May 2017Construction Vital Statistics May 2017
Construction Vital Statistics May 2017
 
Construction Vital Statistics July 2017
Construction Vital Statistics July 2017Construction Vital Statistics July 2017
Construction Vital Statistics July 2017
 
Construction Vital Statistics April 2018
Construction Vital Statistics April 2018Construction Vital Statistics April 2018
Construction Vital Statistics April 2018
 
Construction Vital Statistics December 2017
Construction Vital Statistics December 2017Construction Vital Statistics December 2017
Construction Vital Statistics December 2017
 
Construction Vital Statistics January 2018
Construction Vital Statistics January 2018Construction Vital Statistics January 2018
Construction Vital Statistics January 2018
 
Construction Vital Statistics June 2017
Construction Vital Statistics June 2017Construction Vital Statistics June 2017
Construction Vital Statistics June 2017
 
Construction Vital Statistics June 2018
Construction Vital Statistics June 2018Construction Vital Statistics June 2018
Construction Vital Statistics June 2018
 
Construction Vital Statistics June 2018 Previous
Construction Vital Statistics June 2018 PreviousConstruction Vital Statistics June 2018 Previous
Construction Vital Statistics June 2018 Previous
 
Construction Vital Statistics - November 2015
Construction Vital Statistics - November 2015Construction Vital Statistics - November 2015
Construction Vital Statistics - November 2015
 
Construction Vital Statistics July 2018
Construction Vital Statistics July 2018Construction Vital Statistics July 2018
Construction Vital Statistics July 2018
 
Construction Vital Statistics April 2017
Construction Vital Statistics April 2017Construction Vital Statistics April 2017
Construction Vital Statistics April 2017
 

More from CBIZ & MHM Phoenix

More from CBIZ & MHM Phoenix (11)

Is Your Data Secure?
Is Your Data Secure?Is Your Data Secure?
Is Your Data Secure?
 
HRB 111 Supreme Court Decision - King v Burwell
HRB 111 Supreme Court Decision - King v BurwellHRB 111 Supreme Court Decision - King v Burwell
HRB 111 Supreme Court Decision - King v Burwell
 
Proposed Accounting Standards Update for Not-for-Profits and Healthcare Entities
Proposed Accounting Standards Update for Not-for-Profits and Healthcare EntitiesProposed Accounting Standards Update for Not-for-Profits and Healthcare Entities
Proposed Accounting Standards Update for Not-for-Profits and Healthcare Entities
 
Save the Date: CBIZ Sr. VP, Oscar Diaz, to Present at Marana Chamber of Comme...
Save the Date: CBIZ Sr. VP, Oscar Diaz, to Present at Marana Chamber of Comme...Save the Date: CBIZ Sr. VP, Oscar Diaz, to Present at Marana Chamber of Comme...
Save the Date: CBIZ Sr. VP, Oscar Diaz, to Present at Marana Chamber of Comme...
 
2014 Construction Vital Statistics - December
2014 Construction Vital Statistics - December2014 Construction Vital Statistics - December
2014 Construction Vital Statistics - December
 
CBIZ Women's Advantage Newsletter - Winter 2015
CBIZ Women's Advantage Newsletter - Winter 2015CBIZ Women's Advantage Newsletter - Winter 2015
CBIZ Women's Advantage Newsletter - Winter 2015
 
2014 Construction Vital Statistics - November
2014 Construction Vital Statistics - November2014 Construction Vital Statistics - November
2014 Construction Vital Statistics - November
 
2014 construction vital statistics2
2014 construction vital statistics22014 construction vital statistics2
2014 construction vital statistics2
 
Arizona Charitable Contribution Credits
Arizona Charitable Contribution CreditsArizona Charitable Contribution Credits
Arizona Charitable Contribution Credits
 
National Construction Vital Statistics
National Construction Vital StatisticsNational Construction Vital Statistics
National Construction Vital Statistics
 
Thinking of Buying Space for your Practice?
Thinking of Buying Space for your Practice?Thinking of Buying Space for your Practice?
Thinking of Buying Space for your Practice?
 

Recently uploaded

Latino Buying Power - May 2024 Presentation for Latino Caucus
Latino Buying Power - May 2024 Presentation for Latino CaucusLatino Buying Power - May 2024 Presentation for Latino Caucus
Latino Buying Power - May 2024 Presentation for Latino Caucus
Danay Escanaverino
 
一比一原版BCU毕业证伯明翰城市大学毕业证成绩单如何办理
一比一原版BCU毕业证伯明翰城市大学毕业证成绩单如何办理一比一原版BCU毕业证伯明翰城市大学毕业证成绩单如何办理
一比一原版BCU毕业证伯明翰城市大学毕业证成绩单如何办理
ydubwyt
 
655264371-checkpoint-science-past-papers-april-2023.pdf
655264371-checkpoint-science-past-papers-april-2023.pdf655264371-checkpoint-science-past-papers-april-2023.pdf
655264371-checkpoint-science-past-papers-april-2023.pdf
morearsh02
 
一比一原版UO毕业证渥太华大学毕业证成绩单如何办理
一比一原版UO毕业证渥太华大学毕业证成绩单如何办理一比一原版UO毕业证渥太华大学毕业证成绩单如何办理
一比一原版UO毕业证渥太华大学毕业证成绩单如何办理
yonemuk
 
Introduction to Economics II Chapter 28 Unemployment (1).pdf
Introduction to Economics II Chapter 28 Unemployment (1).pdfIntroduction to Economics II Chapter 28 Unemployment (1).pdf
Introduction to Economics II Chapter 28 Unemployment (1).pdf
Safa444074
 

Recently uploaded (20)

Juspay Case study(Doubling Revenue Juspay's Success).pptx
Juspay Case study(Doubling Revenue Juspay's Success).pptxJuspay Case study(Doubling Revenue Juspay's Success).pptx
Juspay Case study(Doubling Revenue Juspay's Success).pptx
 
what is the best method to sell pi coins in 2024
what is the best method to sell pi coins in 2024what is the best method to sell pi coins in 2024
what is the best method to sell pi coins in 2024
 
Latino Buying Power - May 2024 Presentation for Latino Caucus
Latino Buying Power - May 2024 Presentation for Latino CaucusLatino Buying Power - May 2024 Presentation for Latino Caucus
Latino Buying Power - May 2024 Presentation for Latino Caucus
 
How can I sell my Pi coins in Vietnam easily?
How can I sell my Pi coins in Vietnam easily?How can I sell my Pi coins in Vietnam easily?
How can I sell my Pi coins in Vietnam easily?
 
how can I sell my locked pi coins safety.
how can I sell my locked pi coins safety.how can I sell my locked pi coins safety.
how can I sell my locked pi coins safety.
 
Isios-2024-Professional-Independent-Trustee-Survey.pdf
Isios-2024-Professional-Independent-Trustee-Survey.pdfIsios-2024-Professional-Independent-Trustee-Survey.pdf
Isios-2024-Professional-Independent-Trustee-Survey.pdf
 
The European Unemployment Puzzle: implications from population aging
The European Unemployment Puzzle: implications from population agingThe European Unemployment Puzzle: implications from population aging
The European Unemployment Puzzle: implications from population aging
 
is it possible to sell pi network coin in 2024.
is it possible to sell pi network coin in 2024.is it possible to sell pi network coin in 2024.
is it possible to sell pi network coin in 2024.
 
Summary of financial results for 1Q2024
Summary of financial  results for 1Q2024Summary of financial  results for 1Q2024
Summary of financial results for 1Q2024
 
how to sell pi coins at high rate quickly.
how to sell pi coins at high rate quickly.how to sell pi coins at high rate quickly.
how to sell pi coins at high rate quickly.
 
how can I sell my mined pi coins profitabily.
how can I sell my mined pi coins profitabily.how can I sell my mined pi coins profitabily.
how can I sell my mined pi coins profitabily.
 
Industry Insights - Financial Performance & Valuation Trends
Industry Insights - Financial Performance & Valuation TrendsIndustry Insights - Financial Performance & Valuation Trends
Industry Insights - Financial Performance & Valuation Trends
 
一比一原版BCU毕业证伯明翰城市大学毕业证成绩单如何办理
一比一原版BCU毕业证伯明翰城市大学毕业证成绩单如何办理一比一原版BCU毕业证伯明翰城市大学毕业证成绩单如何办理
一比一原版BCU毕业证伯明翰城市大学毕业证成绩单如何办理
 
655264371-checkpoint-science-past-papers-april-2023.pdf
655264371-checkpoint-science-past-papers-april-2023.pdf655264371-checkpoint-science-past-papers-april-2023.pdf
655264371-checkpoint-science-past-papers-april-2023.pdf
 
Introduction to Economics II Chapter 25 Production and Growth.pdf
Introduction to Economics II Chapter 25 Production and Growth.pdfIntroduction to Economics II Chapter 25 Production and Growth.pdf
Introduction to Economics II Chapter 25 Production and Growth.pdf
 
How can I sell my pi coins in Indonesia?
How can I  sell my pi coins in Indonesia?How can I  sell my pi coins in Indonesia?
How can I sell my pi coins in Indonesia?
 
一比一原版UO毕业证渥太华大学毕业证成绩单如何办理
一比一原版UO毕业证渥太华大学毕业证成绩单如何办理一比一原版UO毕业证渥太华大学毕业证成绩单如何办理
一比一原版UO毕业证渥太华大学毕业证成绩单如何办理
 
Economics and Economic reasoning Chap. 1
Economics and Economic reasoning Chap. 1Economics and Economic reasoning Chap. 1
Economics and Economic reasoning Chap. 1
 
9th issue of our inhouse magazine Ingenious May 2024.pdf
9th issue of our inhouse magazine Ingenious May 2024.pdf9th issue of our inhouse magazine Ingenious May 2024.pdf
9th issue of our inhouse magazine Ingenious May 2024.pdf
 
Introduction to Economics II Chapter 28 Unemployment (1).pdf
Introduction to Economics II Chapter 28 Unemployment (1).pdfIntroduction to Economics II Chapter 28 Unemployment (1).pdf
Introduction to Economics II Chapter 28 Unemployment (1).pdf
 

Phoenix Construction Vital Stats - February 2015

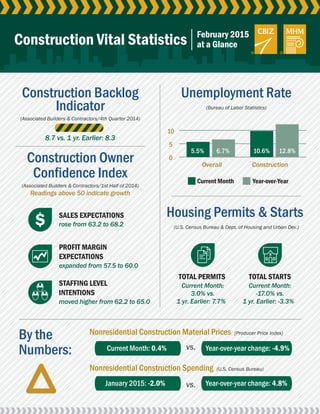
  • 1. 0 5 10 Construction Vital Statistics February 2015 at a Glance Unemployment Rate (Bureau of Labor Statistics) 12.8%5.5% Overall Current Month Year-over-Year Construction 6.7% 10.6% Housing Permits & Starts (U.S. Census Bureau & Dept. of Housing and Urban Dev.) TOTAL PERMITS Current Month: 3.0% vs. 1 yr. Earlier: 7.7% TOTAL STARTS Current Month: -17.0% vs. 1 yr. Earlier: -3.3% Nonresidential Construction Material Prices (Producer Price Index) By the Numbers: Current Month: 0.4% Nonresidential Construction Spending (U.S. Census Bureau) Construction Backlog Indicator (Associated Builders & Contractors/4th Quarter 2014) 8.7 vs. 1 yr. Earlier: 8.3 Construction Owner Confidence Index (Associated Builders & Contractors/1st Half of 2014) Readings above 50 indicate growth SALES EXPECTATIONS rose from 63.2 to 68.2 PROFIT MARGIN EXPECTATIONS expanded from 57.5 to 60.0 STAFFING LEVEL INTENTIONS moved higher from 62.2 to 65.0 Year-over-year change: -4.9% January 2015: -2.0% Year-over-year change: 4.8% vs. vs.
  • 2. February 2015 at a Glance Readings above 50 indicate growth, while readings below 50 are unfavorable. Any Architecture Billing Index Score above 50 signifies growth - it is a leading economic indicator that provides an approximately nine to 12 month glimpse into the future of nonresidential construction spending activity. It is a monthly measure of the first (or initial) report for nonresidential building projects in planning, which have been shown to lead construction spending for nonresidential buildings by a full year. Since reaching bottom in July 2011 at a level of 77.1 (2000=100), the index has been trending up. Rates as of mid month. 1 2 3 4 1 2 3 4 3rd Qtr. 4th Qtr. 1st 1/2 ‘14 Construction Backlog Indicator (Months) Current Backlog Backlog from a year ago Construction Owner Confidence Index Sales Expectations Profit Margin Expectations Staffing Level Intentions National Unemployment Rate Overall current month Overall year-over-year Construction current month Construction year-over-year Arizona Unemployment Rate Overall current month California Unemployment Rate Overall current month Nevada Unemployment Rate Overall current month National Housing Permits and Starts Permits - Total Permits - Total from twelve months earlier 1 - Family - change from previous month 1 - Family - change year-over-year 5 + Units - change from previous month 5 + Units - change year-over-year Starts - Total Starts - Total from twelve months earlier 1 - Family - change from previous month 1 - Family - change year-over-year 5 + Units - change from previous month 5 + Units - change year-over-year West Housing Permits and Starts Permits - Total Permits - Total from twelve months earlier 1 - Family - change from previous month 1 - Family - change year-over-year Starts - Total Starts - Total from twelve months earlier 1 - Family - change from previous month 1 - Family - change year-over-year Nonresidential Construction Material Prices Current Month Change year-over-year Nonresidential Construction Spending Previous Month Change year-over-year AIA - Architecture Billing Index Dodge Momentum Index - Commercial Building Interest Rates I-Month LIBOR WSJ Prime Rate 5 Year US Treasury Rate 10 Year US Treasury Rate Oct. ‘14 8.8 8.2 68.2 60.0 65.0 5.8% 7.2% 6.4% 9.0% 6.6% 7.2% 7.2% 4.8% 1.2% 1.4% 2.4% 8.0% -1.5% -2.8% 7.8% 4.2% 15.4% -15.5% -6.8% -21.6% -17.6% 2.3% -3.6% -10.9% -0.5% 2.7% -16.9% -1.1% 0.5% -1.0% 4.2% 53.7 130.2 0.1535% 3.25% 1.66% 2.63% Nov. ‘14 5.8% 7.0% 7.5% 8.6% 6.6% 7.2% 7.1% -5.2% -0.2% -1.2% -0.9% -11.1% 0.5% -1.6% -7.0% -5.4% -4.6% 7.6% -11.9% -5.6% 6.3% 6.8% 4.4% 28.1% 24.1% -5.2% -7.6% -1.1% -0.6% 1.0% 4.3% 50.9 132.6 0.1548% 3.25% 1.55% 2.12% Dec. ‘14 5.6% 6.7% 8.3% 11.4% 6.6% 7.1% 7.0% -1.9% 1.0% 4.5% 8.1% -12.4% -9.9% 4.4% 5.3% 7.2% 7.9% -4.2% 0.3% -20.5% -17.9% 7.0% 4.1% 5.8% 3.5% 15.8% 21.6% -1.7% -1.9% -1.0% 4.0% 52.2 138.0 0.1635% 3.25% 1.28% 1.76% Jan. ‘15 8.7 8.3 5.7% 6.6% 9.8% 12.3% 6.6% 7.0% 7.1% -0.7% 8.1% -3.1% 5.8% 3.3% 13.8% -2.0% 18.7% -6.7% 16.3% 12.1% 24.5% 16.8% 26.4% -6.7% -2.8% -3.4% 21.7% -3.0% 5.3% -2.1% -4.6% 0.4% 5.9% 49.9 134.3 0.1682% 3.25% 1.48% 2.00% The information within this table has been compiled from multiple data sources, including the Associated Builders & Contractors, the U.S. Census Bureau, the Department of Housing and Urban Development (HUD), and the Producer Price Index. This information does not purport to be complete or all inclusive. For more information, please visit each source site. Feb. ‘15 5.5% 6.7% 10.6% 12.8% 6.5% 6.7% 7.1% 3.0% 7.7% -6.2% 2.8% 19.9% 15.0% -17.0% -3.3% -14.9% 0.7% -21.6% -9.50% 2.2% 16.3% 5.6% 13.6% -18.2% 10.1% -9.1% 10.4% 0.4% -4.9% -2.0% 4.8% 50.4 138.0 0.1721% 3.25% 1.41% 1.93%