Cb legislative session january 2013 crosstabs
•
0 likes•341 views

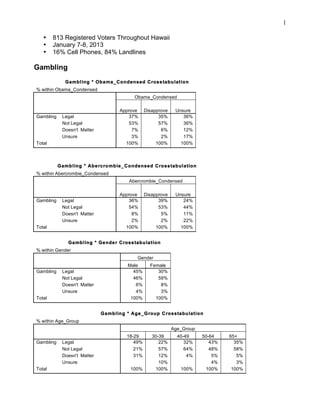
This document contains cross-tabulations of survey responses from 813 registered voters in Hawaii. It analyzes views on gambling, casinos, and state lotteries based on demographics like age, gender, ethnicity, income and voting history. Key findings include that younger respondents aged 18-29 were more supportive of gambling and casinos than older age groups, and over half of all respondents supported the state lottery regardless of their views on Obama or Governor Abercrombie.

Recommended
More Related Content
Similar to Cb legislative session january 2013 crosstabs
Similar to Cb legislative session january 2013 crosstabs (20)
More from Honolulu Civil Beat
More from Honolulu Civil Beat (20)
Cb legislative session january 2013 crosstabs
- 1. 1 • 813 Registered Voters Throughout Hawaii • January 7-8, 2013 • 16% Cell Phones, 84% Landlines Gambling Gambl ing * Oba ma_Condensed Cross tabu lation % within Obama_Condensed Obama_Condensed Approve Disapprove Unsure Gambling Legal 37% 35% 36% Not Legal 53% 57% 36% Doesn't Matter 7% 6% 12% Unsure 3% 2% 17% Total 100% 100% 100% Gambl ing * Abe rcro mbie_ Condensed Cross tabul ation % within Abercrombie_Condensed Abercrombie_Condensed Approve Disapprove Unsure Gambling Legal 36% 39% 24% Not Legal 54% 53% 44% Doesn't Matter 8% 5% 11% Unsure 2% 2% 22% Total 100% 100% 100% Gambl ing * Gende r Cross tabu lation % within Gender Gender Male Female Gambling Legal 45% 30% Not Legal 46% 59% Doesn't Matter 6% 8% Unsure 4% 3% Total 100% 100% Gambl ing * Age_G roup C rosstabu lation % within Age_Group Age_Group 18-29 30-39 40-49 50-64 65+ Gambling Legal 49% 22% 32% 43% 35% Not Legal 21% 57% 64% 48% 58% Doesn't Matter 31% 12% 4% 5% 5% Unsure 10% 4% 3% Total 100% 100% 100% 100% 100%
- 2. 2 Gambling * Race_E thncity Cross tabu lation % within Race_Ethncity Race_Ethncity Caucasian Japanese Filipino Hawaiian Chinese Hispanic/Latino Other/Mixed Gambling Legal 38% 33% 35% 41% 34% 71% 35% Not Legal 53% 58% 49% 54% 56% 14% 51% Doesn't Matter 6% 6% 13% 2% 5% 14% 11% Unsure 2% 4% 3% 4% 5% 3% Total 100% 100% 100% 100% 100% 100% 100% Gambl ing * PhoneType Crosstabu lation % within PhoneType PhoneType Both Cell Landline Gambling Legal 36% 46% 33% Not Legal 56% 33% 49% Doesn't Matter 5% 18% 11% Unsure 3% 3% 7% Total 100% 100% 100% Gambl ing * Pol i tics C rosstabu lation % within Politics Politics Liberal/Progressive Moderate Conservative Unsure Gambling Legal 34% 42% 33% 38% Not Legal 59% 51% 59% 40% Doesn't 4% 7% 7% 13% Matter Unsure 3% 1% 2% 9% Total 100% 100% 100% 100% Gambl ing * Pa rty_ ID Cross tabu lation % within Party_ID Party_ID Democrat Republican Independent Unsure Gambling Legal 35% 33% 40% 45% Not Legal 55% 57% 53% 17% Doesn't Matter 7% 9% 4% 21% Unsure 3% 2% 2% 17% Total 100% 100% 100% 100%
- 3. 3 Gambl ing * Educa tion C rosstabu lation % within Education Education High No School College Graduate degree Degree Degree Degree Gambling Legal 44% 40% 39% 29% Not Legal 19% 51% 54% 60% Doesn't Matter 19% 7% 6% 6% Unsure 19% 3% 1% 6% Total 100% 100% 100% 100% Gambl ing * Rela tionship C rosstabu la tion % within Relationship Relationship Married Partner Single Div/Sep Widowed Gambling Legal 37% 62% 32% 37% 32% Not Legal 56% 27% 49% 52% 59% Doesn't Matter 4% 12% 14% 7% 8% Unsure 3% 5% 5% 1% Total 100% 100% 100% 100% 100% Gambl ing * M il ita ry_Fa mi ly C ross tabula tio n % within Military_Family Military_Family Yes No Gambling Legal 33% 38% Not Legal 56% 52% Doesn't Matter 8% 7% Unsure 3% 3% Total 100% 100% Gambl ing * Un ion_Household C ross tabula tion % within Union_Household Union_Household Yes No Gambling Legal 38% 36% Not Legal 53% 53% Doesn't Matter 5% 7% Unsure 4% 3% Total 100% 100%
- 4. 4 Gambl ing * Inco me Cross tabu lation % within Income Income $50,000 $50,000- $100,000 or Less $100,000 or More Gambling Legal 34% 38% 35% Not Legal 54% 51% 60% Doesn't Matter 9% 7% 3% Unsure 3% 3% 2% Total 100% 100% 100% Gambl ing * Vo ted2008 C ross tabula tion % within Voted2008 Voted2008 No Yes Gambling Legal 43% 35% Not Legal 42% 56% Doesn't Matter 11% 6% Unsure 5% 4% Total 100% 100% Gambl ing * Vo ted2010 C ross tabula tion % within Voted2010 Voted2010 No Yes Gambling Legal 44% 35% Not Legal 46% 55% Doesn't Matter 5% 7% Unsure 6% 3% Total 100% 100%
- 5. 5 Casino * Obama_ Condensed C ross tabula tion % within Obama_Condensed Obama_Condensed Approve Disapprove Unsure Casino Support 32% 27% 16% Oppose 59% 66% 42% Doesn't Matter 6% 4% 28% Unsure 3% 2% 14% Total 100% 100% 100% Casino * Abe rcro mbie_ Condensed C ross tabula ti on % within Abercrombie_Condensed Abercrombie_Condensed Approve Disapprove Unsure Casino Support 34% 26% 20% Oppose 59% 63% 45% Doesn't Matter 4% 8% 15% Unsure 2% 3% 20% Total 100% 100% 100% Casino * Gende r C ross tabula ti on % within Gender Gender Male Female Casino Support 35% 25% Oppose 55% 64% Doesn't Matter 6% 7% Unsure 4% 3% Total 100% 100% Casino * Age_G roup Cross tabu lation % within Age_Group Age_Group 18-29 30-39 40-49 50-64 65+ Casino Support 51% 28% 31% 31% 26% Oppose 23% 53% 67% 60% 65% Doesn't Matter 26% 3% 2% 5% 6% Unsure 15% 4% 2% Total 100% 100% 100% 100% 100%
- 6. 6 Casino * Race_E thnci ty C ross tabula tion % within Race_Ethncity Race_Ethncity Caucasian Japanese Filipino Hawaiian Chinese Hispanic/Latino Other/Mixed Casino Support 36% 15% 40% 28% 31% 38% 27% Oppose 58% 74% 50% 62% 56% 38% 60% Doesn't Matter 4% 7% 5% 8% 10% 13% 9% Unsure 2% 4% 6% 2% 3% 13% 5% Total 100% 100% 100% 100% 100% 100% 100% Casino * PhoneType Cross tabu lation % within PhoneType PhoneType Both Cell Landline Casino Support 26% 51% 39% Oppose 63% 43% 50% Doesn't Matter 7% 3% 9% Unsure 4% 3% 2% Total 100% 100% 100% Casino * Pol itics Crosstabu lation % within Politics Politics Liberal/Progressive Moderate Conservative Unsure Casino Support 31% 33% 25% 29% Oppose 62% 59% 66% 50% Doesn't Matter 3% 6% 4% 17% Unsure 4% 2% 5% 4% Total 100% 100% 100% 100% Casino * Party_ ID Cross tabula tion % within Party_ID Party_ID Democrat Republican Independent Unsure Casino Support 30% 28% 30% 39% Oppose 60% 68% 62% 14% Doesn't Matter 7% 2% 7% 25% Unsure 4% 2% 2% 21% Total 100% 100% 100% 100%
- 7. 7 Casino * Education Crosstabu lation % within Education Education High No School College Graduate degree Degree Degree Degree Casino Support 38% 29% 31% 26% Oppose 44% 60% 59% 64% Doesn't Matter 8% 7% 6% Unsure 19% 3% 3% 4% Total 100% 100% 100% 100% Casino * Rela tionship C rosstabu lation % within Relationship Relationship Married Partner Single Div/Sep Widowed Casino Support 29% 54% 26% 36% 21% Oppose 62% 38% 56% 59% 64% Doesn't Matter 4% 14% 5% 10% Unsure 4% 8% 4% 5% Total 100% 100% 100% 100% 100% Casino * M il ita ry_Fam ily C ross tabula tion % within Military_Family Military_Family Yes No Casino Support 26% 30% Oppose 66% 59% Doesn't Matter 4% 8% Unsure 4% 4% Total 100% 100% Casino * Union_ Household C rosstabu la tion % within Union_Household Union_Household Yes No Casino Support 31% 29% Oppose 61% 60% Doesn't Matter 6% 7% Unsure 3% 4% Total 100% 100%
- 8. 8 Casino * Inco me C ross tabula ti on % within Income Income $50,000 $50,000- $100,000 or Less $100,000 or More Casino Support 34% 27% 22% Oppose 58% 58% 71% Doesn't Matter 3% 10% 6% Unsure 4% 4% 1% Total 100% 100% 100% Casino * Voted2008 C rosstabu la tion % within Voted2008 Voted2008 No Yes Casino Support 38% 27% Oppose 45% 64% Doesn't Matter 11% 6% Unsure 6% 3% Total 100% 100% Casino * Voted2010 C rosstabu la tion % within Voted2010 Voted2010 No Yes Casino Support 38% 26% Oppose 47% 64% Doesn't Matter 6% 7% Unsure 9% 3% Total 100% 100%
- 9. 9 Lotte ry * Oba ma_Condensed Cross tabu lation % within Obama_Condensed Obama_Condensed Approve Disapprove Unsure Lottery Support 55% 60% 60% Oppose 35% 32% 19% Doesn't Matter 6% 3% 10% Unsure 4% 5% 12% Total 100% 100% 100% Lotte ry * Abe rcro mb ie_Condensed Cross tabu lati on % within Abercrombie_Condensed Abercrombie_Condensed Approve Disapprove Unsure Lottery Support 60% 57% 42% Oppose 32% 34% 33% Doesn't Matter 6% 3% 7% Unsure 2% 6% 18% Total 100% 100% 100% Lotte ry * Gende r Cross tabu lation % within Gender Gender Male Female Lottery Support 65% 52% Oppose 29% 36% Doesn't Matter 4% 6% Unsure 3% 6% Total 100% 100% Lotte ry * Age_G roup C rosstabu lation % within Age_Group Age_Group 18-29 30-39 40-49 50-64 65+ Lottery Support 64% 55% 58% 66% 51% Oppose 21% 33% 32% 27% 38% Doesn't Matter 8% 4% 3% 8% Unsure 8% 12% 5% 4% 3% Total 100% 100% 100% 100% 100%
- 10. 10 Lotte ry * Race_E thncity Cross tabu lation % within Race_Ethncity Race_Ethncity Caucasian Japanese Filipino Hawaiian Chinese Hispanic/Latino Other/Mixed Lottery Support 59% 58% 59% 63% 51% 75% 53% Oppose 32% 27% 33% 31% 38% 13% 39% Doesn't Matter 4% 8% 2% 2% 5% 13% 6% Unsure 5% 6% 6% 4% 7% 1% Total 100% 100% 100% 100% 100% 100% 100% Lotte ry * PhoneType C rosstabu lation % within PhoneType PhoneType Both Cell Landline Lottery Support 59% 63% 50% Oppose 33% 27% 34% Doesn't Matter 4% 4% 11% Unsure 5% 6% 5% Total 100% 100% 100% Lotte ry * Po li tics C rosstabu lation % within Politics Politics Liberal/Progressive Moderate Conservative Unsure Lottery Support 50% 60% 61% 63% Oppose 39% 32% 34% 19% Doesn't Matter 5% 5% 2% 9% Unsure 6% 4% 3% 9% Total 100% 100% 100% 100% Lotte ry * Pa rty_ ID Cross tabu lation % within Party_ID Party_ID Democrat Republican Independent Unsure Lottery Support 54% 64% 61% 71% Oppose 35% 32% 31% 7% Doesn't Matter 6% 1% 5% 4% Unsure 5% 4% 4% 18% Total 100% 100% 100% 100%
- 11. 11 Lotte ry * Educa tion C rosstabu lation % within Education Education High No School College Graduate degree Degree Degree Degree Lottery Support 53% 63% 59% 53% Oppose 20% 32% 29% 38% Doesn't Matter 20% 3% 6% 3% Unsure 7% 2% 6% 6% Total 100% 100% 100% 100% Lotte ry * Re lationship C rosstabu la tion % within Relationship Relationship Married Partner Single Div/Sep Widowed Lottery Support 58% 72% 63% 63% 51% Oppose 34% 8% 26% 33% 35% Doesn't Matter 3% 12% 5% 3% 9% Unsure 5% 8% 7% 5% Total 100% 100% 100% 100% 100% Lotte ry * M il ita ry_Fa mi ly C ross tabula tion % within Military_Family Military_Family Yes No Lottery Support 56% 59% Oppose 32% 32% Doesn't Matter 7% 4% Unsure 5% 5% Total 100% 100% Lotte ry * Un ion_Househol d C ross tabula tion % within Union_Household Union_Household Yes No Lottery Support 62% 58% Oppose 30% 33% Doesn't Matter 3% 5% Unsure 5% 5% Total 100% 100%
- 12. 12 Lotte ry * Inco me Cross tabu lation % within Income Income $50,000 $50,000- $100,000 or Less $100,000 or More Lottery Support 55% 65% 51% Oppose 34% 24% 43% Doesn't Matter 7% 2% 3% Unsure 3% 8% 3% Total 100% 100% 100% Lotte ry * Vo ted2008 C ross tabula tion % within Voted2008 Voted2008 No Yes Lottery Support 62% 55% Oppose 31% 35% Doesn't Matter 2% 5% Unsure 6% 5% Total 100% 100% Lotte ry * Vo ted2010 C ross tabula tion % within Voted2010 Voted2010 No Yes Lottery Support 55% 56% Oppose 34% 35% Doesn't Matter 1% 5% Unsure 10% 4% Total 100% 100%
- 13. 13 Gambl ing * Casino C ross tabula tion % within Casino Casino Doesn't Support Oppose Matter Unsure Gambling Legal 73% 19% 48% 19% Not Legal 15% 77% 17% 33% Doesn't Matter 10% 3% 25% 15% Unsure 2% 2% 10% 33% Total 100% 100% 100% 100% Gambl ing * Lotte ry Cross tabula tion % within Lottery Lottery Doesn't Support Oppose Matter Unsure Gambling Legal 57% 9% 16% Not Legal 31% 87% 54% 68% Doesn't Matter 8% 3% 22% 6% Unsure 3% 1% 8% 26% Total 100% 100% 100% 100% % within Gambling Gambling Not Doesn't Legal Legal Matter Unsure Casino Support 59% 8% 41% 19% Oppose 30% 87% 27% 27% Doesn't Matter 9% 2% 24% 19% Unsure 2% 2% 8% 35% Total 100% 100% 100% 100% Casino * Lotte ry C ross tabula tion % within Lottery Lottery Doesn't Support Oppose Matter Unsure Casino Support 45% 8% 24% 3% Oppose 42% 90% 54% 62% Doesn't Matter 10% 1% 16% Unsure 2% 1% 5% 35% Total 100% 100% 100% 100%
- 14. 14 Lotte ry * Ga mbling Cross tabula tion % within Gambling Gambling Not Doesn't Legal Legal Matter Unsure Lottery Support 89% 34% 66% 48% Oppose 8% 55% 14% 7% Doesn't Matter 2% 5% 16% 11% Unsure 6% 4% 33% Total 100% 100% 100% 100% Lotte ry * Cas ino C ross tabula tion % within Casino Casino Doesn't Support Oppose Matter Unsure Lottery Support 87% 40% 84% 37% Oppose 9% 50% 4% 11% Doesn't Matter 4% 5% 12% 7% Unsure 0% 5% 44% Total 100% 100% 100% 100%
- 15. 15 Civil Unions/Marriage Equality Civi lUn ion * Obama_Co ndensed C ross tabula tion % within Obama_Condensed Obama_Condensed Approve Disapprove Unsure CivilUnion Support 60% 24% 31% Oppose 30% 65% 50% Doesn't Matter 7% 7% 10% Unsure 3% 3% 10% Total 100% 100% 100% CivilUn ion * Aberc ro mbie_Con densed C ross tabu lation % within Abercrombie_Condensed Abercrombie_Condensed Approve Disapprove Unsure CivilUnion Support 59% 37% 41% Oppose 32% 54% 32% Doesn't Matter 7% 6% 11% Unsure 3% 3% 16% Total 100% 100% 100% Civi lUn ion * Gende r C ross tabula tion % within Gender Gender Male Female CivilUnion Support 43% 53% Oppose 46% 38% Doesn't Matter 7% 6% Unsure 4% 3% Total 100% 100% Civi lUn ion * Age_G roup Cross tabu lation % within Age_Group Age_Group 18-29 30-39 40-49 50-64 65+ CivilUnion Support 67% 54% 62% 43% 44% Oppose 21% 36% 37% 45% 45% Doesn't Matter 13% 3% 1% 7% 8% Unsure 7% 5% 3% Total 100% 100% 100% 100% 100%
- 16. 16 Civi lUn ion * Race_Ethnc i ty C ross tabula tio n % within Race_Ethncity Race_Ethncity Caucasian Japanese Filipino Hawaiian Chinese Hispanic/Latino Other/Mixed CivilUnion Support 63% 46% 37% 38% 34% 29% 48% Oppose 30% 45% 55% 51% 49% 57% 37% Doesn't Matter 6% 4% 3% 9% 10% 14% 10% Unsure 1% 5% 5% 2% 7% 5% Total 100% 100% 100% 100% 100% 100% 100% Civi lUn ion * PhoneType Cross tabula tion % within PhoneType PhoneType Both Cell Landline CivilUnion Support 50% 48% 41% Oppose 41% 42% 41% Doesn't Matter 6% 9% 11% Unsure 3% 1% 7% Total 100% 100% 100% Civi lUn ion * Pol itics Cross tabu lation % within Politics Politics Liberal/Progressive Moderate Conservative Unsure CivilUnion Support 80% 55% 18% 35% Oppose 13% 39% 71% 46% Doesn't 3% 6% 7% 12% Matter Unsure 4% 1% 4% 7% Total 100% 100% 100% 100% Civi lUn ion * Party_ID C ross tabula tion % within Party_ID Party_ID Democrat Republican Independent Unsure CivilUnion Support 67% 24% 36% 48% Oppose 23% 69% 54% 31% Doesn't Matter 6% 5% 8% 3% Unsure 3% 2% 3% 17% Total 100% 100% 100% 100%
- 17. 17 Civi lUn ion * Education Cross tabu lation % within Education Education High No School College Graduate degree Degree Degree Degree CivilUnion Support 38% 39% 47% 63% Oppose 25% 51% 47% 24% Doesn't Matter 25% 8% 3% 9% Unsure 13% 2% 4% 4% Total 100% 100% 100% 100% Civi lUn ion * Rela tionsh ip C rosstabu lation % within Relationship Relationship Married Partner Single Div/Sep Widowed CivilUnion Support 48% 56% 54% 42% 49% Oppose 43% 24% 36% 52% 42% Doesn't Matter 5% 16% 6% 3% 8% Unsure 4% 4% 4% 3% 1% Total 100% 100% 100% 100% 100% CivilUn ion * Mi l ita ry_Fam ily C rosstab ula tion % within Military_Family Military_Family Yes No CivilUnion Support 45% 50% Oppose 44% 41% Doesn't Matter 6% 6% Unsure 5% 3% Total 100% 100% CivilUn ion * Union_ Household C rosstabu la tion % within Union_Household Union_Household Yes No CivilUnion Support 51% 48% Oppose 41% 42% Doesn't Matter 6% 6% Unsure 3% 4% Total 100% 100%
- 18. 18 Civi lUn ion * Inco me C ross tabula tion % within Income Income $50,000 $50,000- $100,000 or Less $100,000 or More CivilUnion Support 41% 51% 63% Oppose 48% 38% 31% Doesn't Matter 7% 7% 2% Unsure 3% 4% 4% Total 100% 100% 100% Civi lUn ion * Voted2008 C rosstabu la tion % within Voted2008 Voted2008 No Yes CivilUnion Support 31% 49% Oppose 54% 41% Doesn't Matter 9% 7% Unsure 6% 3% Total 100% 100% Civi lUn ion * Voted2010 C rosstabu la tion % within Voted2010 Voted2010 No Yes CivilUnion Support 35% 50% Oppose 45% 41% Doesn't Matter 14% 6% Unsure 6% 3% Total 100% 100%
- 19. 19 Marriage * Oba ma_Condensed C rosstabu la tion % within Obama_Condensed Obama_Condensed Approve Disapprove Unsure Marriage Yes 54% 18% 33% No 38% 77% 52% Doesn't Matter 7% 4% 5% Unsure 2% 1% 10% Total 100% 100% 100% Marriage * Abe rc romb ie_Condensed C rosstabu la tion % within Abercrombie_Condensed Abercrombie_Condensed Approve Disapprove Unsure Marriage Yes 53% 32% 38% No 41% 60% 43% Doesn't Matter 6% 5% 7% Unsure 1% 3% 13% Total 100% 100% 100% Marriage * Gende r C rosstabu lation % within Gender Gender Male Female Marriage Yes 38% 47% No 56% 43% Doesn't Matter 4% 7% Unsure 2% 3% Total 100% 100% Marriage * Age_ Group C ross tabula tion % within Age_Group Age_Group 18-29 30-39 40-49 50-64 65+ Marriage Yes 67% 58% 59% 37% 35% No 21% 37% 36% 55% 56% Doesn't Matter 13% 4% 4% 8% Unsure 5% 4% 1% Total 100% 100% 100% 100% 100%
- 20. 20 Marriage * Race_E thnc ity C rosstabu la tion % within Race_Ethncity Race_Ethncity Caucasian Japanese Filipino Hawaiian Chinese Hispanic/Latino Other/Mixed Marriage Yes 53% 42% 34% 34% 31% 38% 44% No 43% 49% 59% 57% 55% 63% 44% Doesn't Matter 2% 5% 6% 9% 11% 11% Unsure 2% 4% 1% 3% 1% Total 100% 100% 100% 100% 100% 100% 100% Marriage * PhoneType C ross tabula tion % within PhoneType PhoneType Both Cell Landline Marriage Yes 44% 42% 38% No 48% 51% 54% Doesn't Matter 5% 7% 7% Unsure 3% 2% Total 100% 100% 100% Marriage * Po li tics C ross tabula tion % within Politics Politics Liberal/Progressive Moderate Conservative Unsure Marriage Yes 73% 47% 13% 34% No 22% 45% 83% 48% Doesn't Matter 3% 6% 3% 13% Unsure 3% 2% 1% 5% Total 100% 100% 100% 100% Marriage * Pa rty_ID C rosstabu la tion % within Party_ID Party_ID Democrat Republican Independent Unsure Marriage Yes 61% 18% 31% 48% No 31% 82% 57% 41% Doesn't Matter 6% 1% 9% Unsure 2% 3% 10% Total 100% 100% 100% 100%
- 21. 21 Marriage * Educa ti on C ross tabula tion % within Education Education High No School College Graduate degree Degree Degree Degree Marriage Yes 19% 35% 44% 53% No 50% 56% 52% 38% Doesn't Matter 31% 7% 4% 4% Unsure 2% 1% 5% Total 100% 100% 100% 100% Marriage * Re lationsh ip C ross tabula tion % within Relationship Relationship Married Partner Single Div/Sep Widowed Marriage Yes 42% 52% 49% 35% 44% No 51% 32% 45% 57% 48% Doesn't Matter 4% 16% 5% 5% 6% Unsure 3% 2% 3% 1% Total 100% 100% 100% 100% 100% Marriage * Mi li tary_Fa mi ly Crosstabu lation % within Military_Family Military_Family Yes No Marriage Yes 39% 44% No 54% 48% Doesn't Matter 5% 5% Unsure 2% 2% Total 100% 100% Marriage * Un ion_Househo ld Cross tabu lation % within Union_Household Union_Household Yes No Marriage Yes 45% 43% No 47% 50% Doesn't Matter 5% 5% Unsure 3% 2% Total 100% 100%
- 22. 22 Marriage * Income C rosstabu lation % within Income Income $50,000 $50,000- $100,000 or Less $100,000 or More Marriage Yes 34% 48% 55% No 58% 45% 38% Doesn't Matter 7% 4% 4% Unsure 0% 4% 3% Total 100% 100% 100% Marriage * Vo ted2008 Cross tabu lation % within Voted2008 Voted2008 No Yes Marriage Yes 25% 43% No 70% 48% Doesn't Matter 3% 6% Unsure 2% 3% Total 100% 100% Marriage * Vo ted2010 Cross tabu lation % within Voted2010 Voted2010 No Yes Marriage Yes 33% 44% No 58% 48% Doesn't Matter 5% 6% Unsure 5% 2% Total 100% 100%
- 23. 23 Marriage Decide * Oba ma_Condensed Cross tabu l ation % within Obama_Condensed Obama_Condensed Approve Disapprove Unsure MarriageDecide Voters 53% 76% 48% Legislature/Governor 15% 7% Courts 9% 4% 2% Federal 15% 11% 19% Other/Unsure 8% 3% 31% Total 100% 100% 100% Marriage Decide * Abe rc romb ie_Condensed Cros stabula tion % within Abercrombie_Condensed Abercrombie_Condensed Approve Disapprove Unsure MarriageDecide Voters 53% 70% 40% Legislature/Governor 16% 9% 2% Courts 10% 4% 11% Federal 16% 11% 13% Other/Unsure 6% 6% 35% Total 100% 100% 100% Marriage Decide * Gende r Cross tabu lation % within Gender Gender Male Female MarriageDecide Voters 62% 58% Legislature/Governor 12% 11% Courts 6% 8% Federal 14% 14% Other/Unsure 7% 9% Total 100% 100% Marriage Decide * Age_G roup C rosstabu la tion % within Age_Group Age_Group 18-29 30-39 40-49 50-64 65+ MarriageDecide Voters 58% 43% 53% 66% 61% Legislature/Governor 8% 18% 19% 9% 10% Courts 5% 10% 11% 5% 6% Federal 8% 15% 16% 14% 14% Other/Unsure 21% 13% 1% 5% 9% Total 100% 100% 100% 100% 100%
- 24. 24 Marriage Decide * Race_E thnci ty Cross tabu lation % within Race_Ethncity Race_Ethncity Caucasian Japanese Filipino Hawaiian Chinese Hispanic/Latino Other/Mixed MarriageDecide Voters 60% 59% 59% 60% 64% 71% 62% Legislature/Governor 11% 16% 14% 11% 7% 14% 9% Courts 8% 3% 7% 4% 10% 0% 8% Federal 18% 13% 10% 13% 13% 14% 9% Other/Unsure 2% 9% 9% 11% 7% 13% Total 100% 100% 100% 100% 100% 100% 100% Marriage Decide * PhoneType C rosstabu lation % within PhoneType PhoneType Both Cell Landline MarriageDecide Voters 62% 56% 49% Legislature/Governor 13% 7% 7% Courts 6% 7% 12% Federal 13% 18% 16% Other/Unsure 6% 12% 16% Total 100% 100% 100% Marriage Decide * Po li tics C rosstabu la tion % within Politics Politics Liberal/Progressive Moderate Conservative Unsure MarriageDecide Voters 41% 64% 79% 55% Legislature/Governor 22% 12% 6% 5% Courts 12% 5% 3% 8% Federal 15% 13% 9% 18% Other/Unsure 11% 5% 3% 14% Total 100% 100% 100% 100% Marriage Decide * Pa rty_ ID C rosstabu lation % within Party_ID Party_ID Democrat Republican Independent Unsure MarriageDecide Voters 50% 74% 69% 48% Legislature/Governor 17% 5% 9% Courts 11% 3% 3% 3% Federal 12% 13% 15% 14% Other/Unsure 9% 4% 3% 34% Total 100% 100% 100% 100%
- 25. 25 Marriage Decide * Educa tion C rosstabu la tion % within Education Education High No School College Graduate degree Degree Degree Degree MarriageDecide Voters 41% 63% 65% 51% Legislature/Governor 18% 7% 8% 24% Courts 5% 8% 8% Federal 18% 15% 14% 11% Other/Unsure 24% 10% 6% 7% Total 100% 100% 100% 100% Marriage Decide * Re lationship C ross tabula tion % within Relationship Relationship Married Partner Single Div/Sep Widowed MarriageDecide Voters 62% 50% 54% 69% 60% Legislature/Governor 11% 15% 15% 10% 12% Courts 8% 4% 3% 3% 6% Federal 12% 19% 16% 14% 13% Other/Unsure 7% 12% 12% 3% 9% Total 100% 100% 100% 100% 100% Marriage Decide * M il itary_Fa mi ly Cross tabula tio n % within Military_Family Military_Family Yes No MarriageDecide Voters 63% 59% Legislature/Governor 11% 12% Courts 6% 7% Federal 14% 14% Other/Unsure 7% 8% Total 100% 100% Marriage Decide * Un ion_Househo ld C ross tabula tion % within Union_Household Union_Household Yes No MarriageDecide Voters 56% 62% Legislature/Governor 14% 11% Courts 9% 6% Federal 13% 14% Other/Unsure 7% 8% Total 100% 100%
- 26. 26 Marriage Decide * Inco me Cross tabu lation % within Income Income $50,000 $50,000- $100,000 or Less $100,000 or More MarriageDecide Voters 55% 65% 57% Legislature/Governor 14% 11% 14% Courts 5% 8% 9% Federal 19% 11% 11% Other/Unsure 7% 5% 9% Total 100% 100% 100% Marriage Decide * Vo ted2008 C ross tabula ti on % within Voted2008 Voted2008 No Yes MarriageDecide Voters 72% 58% Legislature/Governor 5% 13% Courts 2% 8% Federal 11% 14% Other/Unsure 11% 7% Total 100% 100% Marriage Decide * Vo ted2010 C ross tabula ti on % within Voted2010 Voted2010 No Yes MarriageDecide Voters 61% 58% Legislature/Governor 10% 12% Courts 5% 7% Federal 13% 14% Other/Unsure 11% 7% Total 100% 100%
- 27. 27 Civi lUn ion * Ma rriage Cross tabu lation % within Marriage Marriage Doesn't Yes No Matter Unsure CivilUnion Support 95% 11% 29% 25% Oppose 4% 78% 14% 6% Doesn't Matter 1% 7% 52% 13% Unsure 0% 4% 5% 56% Total 100% 100% 100% 100% Civi lUn ion * Ma rriageDec ide C ross tabula tion % within MarriageDecide MarriageDecide Voters Legislature/Governor Courts Federal Other/Unsure CivilUnion Support 38% 71% 62% 63% 43% Oppose 53% 18% 24% 31% 28% Doesn't Matter 6% 10% 10% 4% 10% Unsure 2% 1% 4% 2% 19% Total 100% 100% 100% 100% 100% Marriage * C ivi lUn ion Cross tabu lation % within CivilUnion CivilUnion Doesn't Support Oppose Matter Unsure Marriage Yes 84% 4% 4% 4% No 11% 94% 49% 54% Doesn't Matter 4% 2% 43% 8% Unsure 1% 0% 4% 35% Total 100% 100% 100% 100% Marriage * Marria geDecide C rosstabu la tion % within MarriageDecide MarriageDecide Voters Legislature/Governor Courts Federal Other/Unsure Marriage Yes 32% 73% 61% 53% 36% No 61% 24% 31% 39% 39% Doesn't Matter 5% 1% 8% 6% 14% Unsure 2% 1% 2% 12% Total 100% 100% 100% 100% 100%
- 28. 28 Marriage Decide * C ivilUn ion C ross tabula tion % within CivilUnion CivilUnion Doesn't Support Oppose Matter Unsure MarriageDecide Voters 48% 75% 54% 38% Legislature/Governor 17% 5% 16% 4% Courts 9% 4% 10% 8% Federal 18% 10% 8% 8% Other/Unsure 7% 5% 12% 42% Total 100% 100% 100% 100% Marriage Decide * Ma rriage C rosstabu la tion % within Marriage Marriage Doesn't Yes No Matter Unsure MarriageDecide Voters 45% 73% 55% 41% Legislature/Governor 20% 6% 2% 6% Courts 10% 5% 10% Federal 17% 11% 14% 12% Other/Unsure 7% 6% 19% 41% Total 100% 100% 100% 100%
- 29. 29 Elections by Mail VoteByMa il * Obama_Condensed C rosstabu la tion % within Obama_Condensed Obama_Condensed Approve Disapprove Unsure VoteByMail Yes 52% 40% 26% No 33% 42% 26% Doesn't Matter 8% 12% 29% Unsure 6% 6% 19% Total 100% 100% 100% VoteByMa il * Abe rc romb ie_Condensed C rosstab ulation % within Abercrombie_Condensed Abercrombie_Condensed Approve Disapprove Unsure VoteByMail Yes 54% 42% 35% No 34% 39% 18% Doesn't Matter 7% 11% 24% Unsure 5% 7% 24% Total 100% 100% 100% VoteByMa il * Gender C rosstabu la tion % within Gender Gender Male Female VoteByMail Yes 53% 44% No 33% 36% Doesn't Matter 7% 13% Unsure 6% 8% Total 100% 100% % within Age_Group Age_Group 18-29 30-39 40-49 50-64 65+ VoteByMail Yes 33% 46% 51% 45% 52% No 41% 32% 37% 38% 32% Doesn't Matter 18% 8% 8% 10% 10% Unsure 8% 14% 4% 7% 6% Total 100% 100% 100% 100% 100%
- 30. 30 % within Race_Ethncity Race_Ethncity Caucasian Japanese Filipino Hawaiian Chinese Hispanic/Latino Other/Mixed VoteByMail Yes 56% 54% 28% 40% 48% 57% 44% No 32% 29% 45% 38% 35% 29% 40% Doesn't Matter 7% 7% 19% 15% 8% 14% 12% Unsure 5% 10% 8% 8% 8% 4% Total 100% 100% 100% 100% 100% 100% 100% VoteByMa il * PhoneType C ross tabula tion % within PhoneType PhoneType Both Cell Landline VoteByMail Yes 47% 51% 49% No 34% 42% 32% Doesn't Matter 11% 6% 7% Unsure 7% 1% 12% Total 100% 100% 100% VoteByMa il * Po litics C ross tabula tio n % within Politics Politics Liberal/Progressive Moderate Conservative Unsure VoteByMail Yes 54% 47% 47% 40% No 33% 35% 41% 30% Doesn't 6% 13% 7% 17% Matter Unsure 7% 5% 5% 13% Total 100% 100% 100% 100% VoteByMa il * Pa rty_ID C rossta bula tion % within Party_ID Party_ID Democrat Republican Independent Unsure VoteByMail Yes 53% 44% 48% 17% No 31% 40% 40% 27% Doesn't Matter 9% 11% 9% 30% Unsure 8% 5% 3% 27% Total 100% 100% 100% 100%
- 31. 31 VoteByMa il * Educa tion C ross tabula tio n % within Education Education High No School College Graduate degree Degree Degree Degree VoteByMail Yes 50% 47% 46% 50% No 25% 34% 37% 34% Doesn't Matter 6% 13% 12% 6% Unsure 19% 6% 5% 9% Total 100% 100% 100% 100% VoteByMa il * Re la tionsh ip Cross tabula tion % within Relationship Relationship Married Partner Single Div/Sep Widowed VoteByMail Yes 46% 54% 47% 58% 46% No 37% 31% 32% 29% 37% Doesn't Matter 11% 12% 10% 10% 8% Unsure 6% 4% 10% 3% 9% Total 100% 100% 100% 100% 100% VoteByMa il * Mi li ta ry_Fam ily C rosstabu lation % within Military_Family Military_Family Yes No VoteByMail Yes 38% 49% No 43% 33% Doesn't Matter 11% 11% Unsure 8% 7% Total 100% 100% VoteByMa il * Un ion_Househo ld Cross tabu lation % within Union_Household Union_Household Yes No VoteByMail Yes 51% 47% No 34% 36% Doesn't Matter 10% 11% Unsure 5% 7% Total 100% 100%
- 32. 32 VoteByMa il * Income C rosstabu la tion % within Income Income $50,000 $50,000- $100,000 or Less $100,000 or More VoteByMail Yes 41% 48% 56% No 41% 33% 31% Doesn't Matter 11% 12% 9% Unsure 7% 7% 4% Total 100% 100% 100% VoteByMa il * Vo ted2008 Cross tabu lation % within Voted2008 Voted2008 No Yes VoteByMail Yes 44% 47% No 36% 35% Doesn't Matter 15% 10% Unsure 5% 8% Total 100% 100% VoteByMa il * Vo ted2010 Cross tabu lation % within Voted2010 Voted2010 No Yes VoteByMail Yes 44% 47% No 33% 35% Doesn't Matter 11% 11% Unsure 11% 6% Total 100% 100%
- 33. 33 Budget Deficit BudgetDe fic it * Obama_Condensed C rosstabu la ti on % within Obama_Condensed Obama_Condensed Approve Disapprove Unsure BudgetDeficit Excise tax 21% 12% 10% Retirees 8% 11% 7% Current employees 23% 35% 14% Combination 33% 30% 14% Unsure 15% 12% 55% Total 100% 100% 100% BudgetDe fic it * Abe rc romb ie_Condensed C rosstabulation % within Abercrombie_Condensed Abercrombie_Condensed Approve Disapprove Unsure BudgetDeficit Excise tax 18% 18% 11% Retirees 10% 8% 4% Current employees 24% 31% 20% Combination 35% 29% 20% Unsure 13% 15% 45% Total 100% 100% 100% BudgetDe fic it * Gender C rosstabu la tion % within Gender Gender Male Female BudgetDeficit Excise tax 15% 20% Retirees 9% 7% Current employees 28% 25% Combination 33% 32% Unsure 16% 17% Total 100% 100% BudgetDe fic it * Age_ Gro up C ross tabula tion % within Age_Group Age_Group 18-29 30-39 40-49 50-64 65+ BudgetDeficit Excise tax 8% 20% 24% 16% 18% Retirees 8% 7% 8% 11% Current employees 18% 25% 30% 25% 26% Combination 21% 42% 30% 34% 30% Unsure 46% 13% 10% 16% 15% Total 100% 100% 100% 100% 100%
- 34. 34 BudgetDe fic it * Race_ Ethnc ity C rosstabu la tion % within Race_Ethncity Race_Ethncity Caucasian Japanese Filipino Hawaiian Chinese Hispanic/Latino Other/Mixed BudgetDeficit Excise tax 17% 19% 10% 11% 21% 13% 27% Retirees 8% 9% 10% 8% 8% 25% 5% Current 31% 24% 25% 26% 26% 13% 19% employees Combination 36% 31% 24% 28% 38% 38% 29% Unsure 8% 16% 30% 26% 7% 13% 20% Total 100% 100% 100% 100% 100% 100% 100% BudgetDe fic it * PhoneType C ross tabula tion % within PhoneType PhoneType Both Cell Landline BudgetDeficit Excise tax 18% 16% 16% Retirees 7% 12% 14% Current employees 27% 22% 25% Combination 33% 31% 21% Unsure 14% 18% 23% Total 100% 100% 100% BudgetDe fic it * Po litics C ross tabula tio n % within Politics Politics Liberal/Progressive Moderate Conservative Unsure BudgetDeficit Excise tax 24% 17% 12% 16% Retirees 2% 9% 12% 11% Current 28% 29% 32% 10% employees Combination 35% 32% 32% 30% Unsure 10% 13% 12% 33% Total 100% 100% 100% 100% BudgetDe fic it * Pa rty_ID C ross tabula tion % within Party_ID Party_ID Democrat Republican Independent Unsure BudgetDeficit Excise tax 22% 12% 15% 7% Retirees 6% 11% 10% 7% Current 23% 32% 30% 14% employees Combination 34% 31% 35% 11% Unsure 15% 15% 10% 61% Total 100% 100% 100% 100%
- 35. 35 BudgetDe fic it * Educa tion C ross tabula ti on % within Education Education High No School College Graduate degree Degree Degree Degree BudgetDeficit Excise tax 18% 18% 15% 21% Retirees 12% 6% 9% 10% Current employees 6% 24% 29% 26% Combination 6% 30% 35% 32% Unsure 59% 22% 12% 11% Total 100% 100% 100% 100% BudgetDe fic it * Re la tionsh ip Cross tabula tion % within Relationship Relationship Married Partner Single Div/Sep Widowed BudgetDeficit Excise tax 19% 4% 13% 22% 18% Retirees 6% 12% 9% 7% 18% Current employees 28% 40% 22% 32% 19% Combination 34% 20% 35% 30% 27% Unsure 14% 24% 21% 10% 18% Total 100% 100% 100% 100% 100% BudgetDe fic it * Mi li ta ry_Fam ily C rosstabu lation % within Military_Family Military_Family Yes No BudgetDeficit Excise tax 20% 17% Retirees 7% 9% Current employees 26% 26% Combination 31% 32% Unsure 16% 15% Total 100% 100% BudgetDe fic it * Un ion_Househo ld Cross tabu latio n % within Union_Household Union_Household Yes No BudgetDeficit Excise tax 28% 13% Retirees 7% 9% Current employees 18% 30% Combination 30% 33% Unsure 16% 15% Total 100% 100%
- 36. 36 BudgetDe fic it * Income C rosstabu la tion % within Income Income $50,000 $50,000- $100,000 or Less $100,000 or More BudgetDeficit Excise tax 18% 17% 20% Retirees 10% 6% 9% Current employees 26% 23% 26% Combination 27% 39% 35% Unsure 18% 14% 9% Total 100% 100% 100% BudgetDe fic it * Vo ted2008 Cross tabu lation % within Voted2008 Voted2008 No Yes BudgetDeficit Excise tax 9% 18% Retirees 9% 9% Current employees 22% 28% Combination 28% 31% Unsure 31% 14% Total 100% 100% BudgetDe fic it * Vo ted2010 Cross tabu lation % within Voted2010 Voted2010 No Yes BudgetDeficit Excise tax 10% 18% Retirees 6% 10% Current employees 20% 28% Combination 35% 30% Unsure 28% 15% Total 100% 100%
- 37. 37 PLDC PLDC * Obama_Condensed C ross tabula tion % within Obama_Condensed Obama_Condensed Approve Disapprove Unsure PLDC Abolish 27% 34% 10% Control 38% 30% 17% Leave alone 11% 14% 7% Doesn't matter 7% 11% 10% Unsure 17% 11% 57% Total 100% 100% 100% PLDC * Aberc ro mbie_Condensed C ross tabula tio n % within Abercrombie_Condensed Abercrombie_Condensed Approve Disapprove Unsure PLDC Abolish 22% 38% 13% Control 41% 30% 19% Leave alone 14% 10% 6% Doesn't matter 8% 7% 15% Unsure 14% 15% 48% Total 100% 100% 100% PLDC * Gender C ross tabula tion % within Gender Gender Male Female PLDC Abolish 36% 22% Control 31% 39% Leave alone 13% 10% Doesn't matter 8% 8% Unsure 12% 21% Total 100% 100% PLDC * Age_G roup C ross tabula tion % within Age_Group Age_Group 18-29 30-39 40-49 50-64 65+ PLDC Abolish 41% 25% 23% 28% 28% Control 8% 20% 39% 38% 40% Leave alone 15% 10% 17% 10% 11% Doesn't matter 10% 13% 4% 7% 8% Unsure 26% 32% 17% 17% 13% Total 100% 100% 100% 100% 100%
- 38. 38 PLDC * Race_Ethnc i ty C ross tabula tion % within Race_Ethncity Race_Ethncity Caucasian Japanese Filipino Hawaiian Chinese Hispanic/Latino Other/Mixed PLDC Abolish 24% 37% 23% 35% 34% 25% 23% Control 47% 31% 28% 26% 30% 50% 32% Leave alone 9% 10% 13% 13% 13% 13% 16% Doesn't matter 7% 6% 14% 7% 7% 7% Unsure 12% 17% 23% 19% 16% 13% 21% Total 100% 100% 100% 100% 100% 100% 100% PLDC * PhoneType C ross tabula ti on % within PhoneType PhoneType Both Cell Landline PLDC Abolish 28% 32% 28% Control 38% 28% 28% Leave alone 10% 19% 18% Doesn't matter 7% 12% 7% Unsure 18% 9% 19% Total 100% 100% 100% PLDC * Pol itics Cross tabula tion % within Politics Politics Liberal/Progressive Moderate Conservative Unsure PLDC Abolish 35% 29% 28% 16% Control 35% 40% 37% 28% Leave alone 11% 14% 13% 7% Doesn't matter 5% 5% 7% 14% Unsure 13% 12% 15% 34% Total 100% 100% 100% 100% PLDC * Party_I D C ross tabula tion % within Party_ID Party_ID Democrat Republican Independent Unsure PLDC Abolish 27% 27% 34% 7% Control 40% 36% 33% 14% Leave alone 11% 15% 11% 4% Doesn't matter 6% 9% 7% 18% Unsure 16% 13% 14% 57% Total 100% 100% 100% 100%
- 39. 39 PLDC * Education Cross tabula tion % within Education Education High No School College Graduate degree Degree Degree Degree PLDC Abolish 6% 25% 31% 30% Control 24% 36% 37% 38% Leave alone 24% 12% 11% 11% Doesn't matter 12% 7% 8% 4% Unsure 35% 20% 14% 17% Total 100% 100% 100% 100% PLDC * Rela tionsh ip Cross tabu lation % within Relationship Relationship Married Partner Single Div/Sep Widowed PLDC Abolish 28% 35% 33% 18% 27% Control 37% 12% 27% 52% 41% Leave alone 12% 38% 11% 7% 6% Doesn't matter 6% 8% 9% 8% 10% Unsure 17% 8% 21% 15% 15% Total 100% 100% 100% 100% 100% PLDC * Mi li ta ry_Fam ily C rosstabu la tion % within Military_Family Military_Family Yes No PLDC Abolish 26% 28% Control 37% 36% Leave alone 8% 12% Doesn't matter 12% 6% Unsure 18% 17% Total 100% 100% PLDC * Union_Ho usehold C rosstabu lation % within Union_Household Union_Household Yes No PLDC Abolish 27% 29% Control 37% 36% Leave alone 10% 12% Doesn't matter 9% 7% Unsure 18% 16% Total 100% 100%