Case study - Adult - Fluid Overload - Leukemia
•
2 likes•1,587 views

77 year old man, with myelomonocytic leukemia treated with periodic blood transfusions

Recommended
Recommended
More Related Content
What's hot
What's hot (20)
Similar to Case study - Adult - Fluid Overload - Leukemia
Similar to Case study - Adult - Fluid Overload - Leukemia (20)
More from Uscom - Case Studies
More from Uscom - Case Studies (7)
Recently uploaded
Recently uploaded (20)
Case study - Adult - Fluid Overload - Leukemia
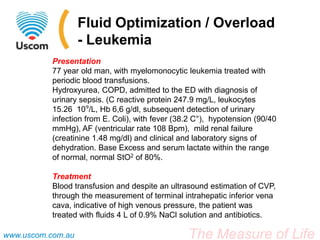
- 1. Fluid Optimization / Overload - Leukemia Presentation 77 year old man, with myelomonocytic leukemia treated with periodic blood transfusions. Hydroxyurea, COPD, admitted to the ED with diagnosis of urinary sepsis. (C reactive protein 247.9 mg/L, leukocytes 15.26 10⁹/L, Hb 6,6 g/dl, subsequent detection of urinary infection from E. Coli), with fever (38.2 C°), hypotension (90/40 mmHg), AF (ventricular rate 108 Bpm), mild renal failure (creatinine 1.48 mg/dl) and clinical and laboratory signs of dehydration. Base Excess and serum lactate within the range of normal, normal StO2 of 80%. Treatment Blood transfusion and despite an ultrasound estimation of CVP, through the measurement of terminal intrahepatic inferior vena cava, indicative of high venous pressure, the patient was treated with fluids 4 L of 0.9% NaCl solution and antibiotics. www.uscom.com.au The Measure of Life
- 2. Fluid Optimization / Overload - Leukemia Day 2 Result BP improved to 100/50 mmHg and creatinine to 1.21 mg/dl, Na 140 mEq/L. USCOM: Normal CO (6.4 L/min), SV (66 ml) and SVR at the lower limit of the normal range (888 ds/cm⁻⁵). A passive leg raising (PLR) test was negative for fluid responsiveness. Ultrasound: CVP still high (terminal intrahepatic inferior vena cava 2.55 cm maximum diameter with inspiratory reduction of 20%) Despite these results the treating physician decided to go ahead with fluid replacement 3L 0.9% saline solution because of unsatisfactory BP and diuresis (700 ml the day before but improving on second day). www.uscom.com.au The Measure of Life
- 3. Fluid Optimization / Overload - Leukemia Result: negative for fluid responsiveness. Pre Passive Leg Raise Post Passive Leg Raise www.uscom.com.au The Measure of Life
- 4. Fluid Optimization / Overload - Leukemia Day 3 Result BP improved: 140/70 mmHg, No fever. Creatinine 1.03 mg/dl, CRP 127 mg/L, leukocytes 6.35 10⁹/L. USCOM: CO 4.4 L/min, SV 47 ml, SVR 1609 ds/cm⁻⁵. An increase in SVR, reduced CO and SV, revealing a latent cardiac failure, masked in the previous days by the decrease in SVR due to sepsis. www.uscom.com.au The Measure of Life
- 5. Fluid Optimization / Overload - Leukemia Result: A reduced CO and SV and an increase in SVR revealing a latent cardiac failure. www.uscom.com.au The Measure of Life
- 6. Fluid Optimization / Overload - Leukemia Day 3 Treatment: Despite these readings the treating physician decided to go on with fluid administration of about 2 L 0.9% saline for two more days in order to maintain a high diuresis, with further improvement in renal function (creatinine 0.86 mg/ dl). Result: A few days later the patient developed exertional dyspnea, edema and evidence of bilateral pleural effusions, which improved quickly with diuretic therapy. www.uscom.com.au The Measure of Life
- 7. Fluid Optimization / Overload - Leukemia Summary: This clinical case shows how cardiac pre-load measurements could be misleading. Initially the patient needed fluids, as correctly indicated by the global clinical picture, despite ultrasound signs of high CVP. On the second and third days the USCOM readings told us clearly that the patient did not need more fluid and he was at risk of decompensation because of poor cardiac function revealed after the normalization of SVR. Conclusion: Monitoring with USCOM would have prevented excessive fluid administration and the resultant heart failure if the results were not ignored. www.uscom.com.au The Measure of Life
Editor's Notes
- When PLR test with USCOM is positive it has a 91% Positive predictive value.Although when negative, there is a high False negative rate.A cause of a False negative is Conditions of high intra-abdominal pressure …should be noted that intra-abdominal hypertension (intra-abdominal pressure > 16 mm Hg) impairs venous return and reduces the ability of PLR to detect fluid responsiveness [54]...Marik et al. Annals of Intensive Care 2011, 1:1Therefore when PLR is negative, confirm with other input such as SVI, SVV if ventilated.
- Low normal SVI - 34 (Typical 30-55)HR 98Low SVR – 896 (Typical 1000-1800)High CO – 6.3 (Typical 2.5-6.0)High normal CI – 3.3 (Typical 2.4-3.6)
- Low SVI - 25 (Typical 30-55)Normal SVR – 1609 (Typical 1000-1800)NormalCO – 4.4 (Typical 2.5-6.0)Low CI – 2.3 (Typical 2.4-3.6)