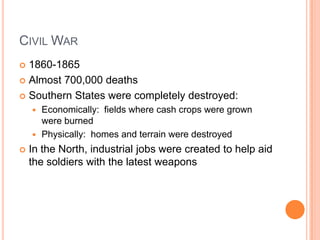
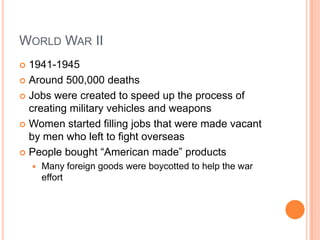
World Events and Business Events in the EconomyJohn Garvin, Monica Rains, Daniel Hankins
Civil War1860-1865Almost 700,000 deathsSouthern States were completely destroyed:Economically:  fields where cash crops were grown were burnedPhysically:  homes and terrain were destroyedIn the North, industrial jobs were created to help aid the soldiers with the latest weapons
World War II1941-1945Around 500,000 deathsJobs were created to speed up the process of creating military vehicles and weaponsWomen started filling jobs that were made vacant by men who left to fight overseasPeople bought “American made” productsMany foreign goods were boycotted to help the war effort
Mortality Rate vs. Incomewww.bit.ly/cVMWJ4The link above is an interactive graph that was created by Gapminder that shows the progress of of individual average income and mortality rateMake sure to focus the years around 1860-1865 (Civil War) and 1941-1945 (World War II)Notice the unchanging of the mortality rate in the U.S. bubble and the vast change in the income of the U.S. bubble
Why Does The Chart and Wars Relate to Business Cycles?Less people, means less stimulus for the economyWars cost moneyHowever wars create jobs (look at the chart)Throughout the war, as the mortality rate stays stagnant due to many deaths in the war: the average income per person rises dramaticallyThus, putting money in the hands of consumers who can stimulate the economy

Case artifact

  • 1.
    World Events andBusiness Events in the EconomyJohn Garvin, Monica Rains, Daniel Hankins
  • 2.
    Civil War1860-1865Almost 700,000deathsSouthern States were completely destroyed:Economically: fields where cash crops were grown were burnedPhysically: homes and terrain were destroyedIn the North, industrial jobs were created to help aid the soldiers with the latest weapons
  • 3.
    World War II1941-1945Around500,000 deathsJobs were created to speed up the process of creating military vehicles and weaponsWomen started filling jobs that were made vacant by men who left to fight overseasPeople bought “American made” productsMany foreign goods were boycotted to help the war effort
  • 4.
    Mortality Rate vs.Incomewww.bit.ly/cVMWJ4The link above is an interactive graph that was created by Gapminder that shows the progress of of individual average income and mortality rateMake sure to focus the years around 1860-1865 (Civil War) and 1941-1945 (World War II)Notice the unchanging of the mortality rate in the U.S. bubble and the vast change in the income of the U.S. bubble
  • 5.
    Why Does TheChart and Wars Relate to Business Cycles?Less people, means less stimulus for the economyWars cost moneyHowever wars create jobs (look at the chart)Throughout the war, as the mortality rate stays stagnant due to many deaths in the war: the average income per person rises dramaticallyThus, putting money in the hands of consumers who can stimulate the economy