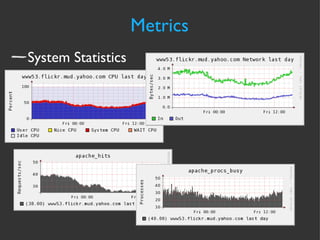
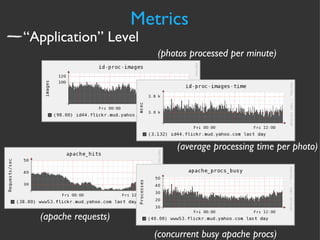
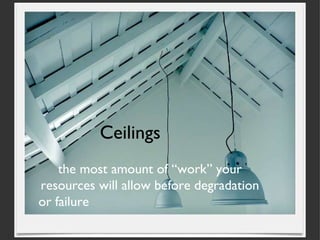
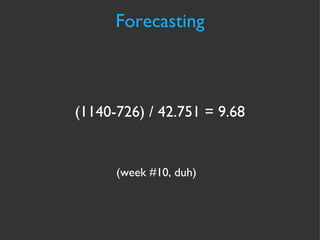
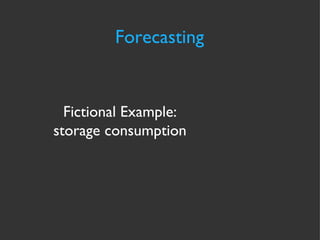
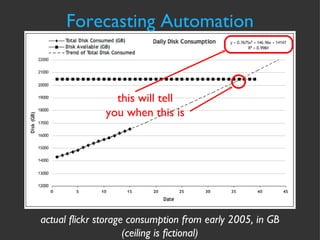
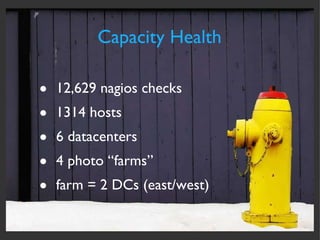
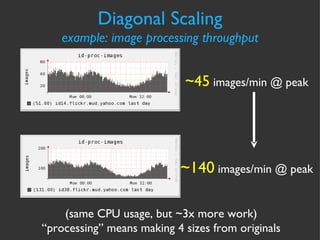
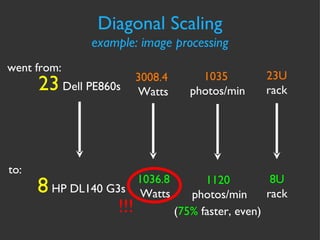
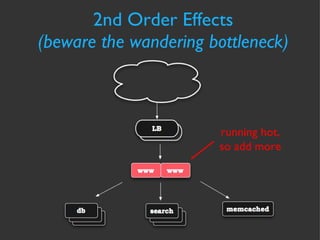
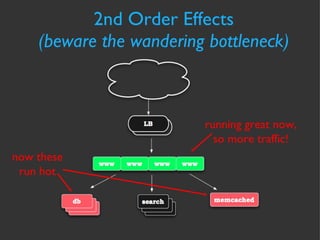
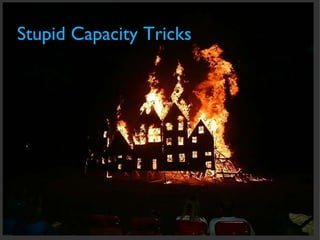
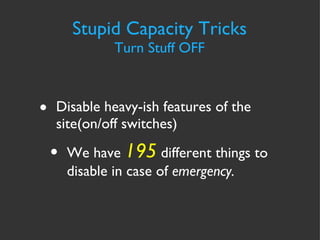
The document discusses various strategies and techniques for capacity management of web operations, including forecasting future capacity needs, identifying ceilings for system resources, implementing safety factors, and performing diagonal scaling. It also provides examples of metrics used at Flickr for monitoring capacity and some "stupid capacity tricks" that can be employed in emergencies.


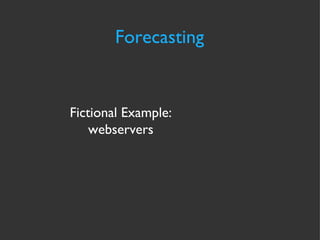


![Forecasting Automation cmd line script output jallspaw:~]$cfityk ./fit-storage.fit 1> # Fityk script. Fityk version: 0.8.2 2> @0 < '/home/jallspaw/storage-consumption.xy' 15 points. No explicit std. dev. Set as sqrt(y) 3> guess Quadratic New function %_1 was created. 4> fit Initial values: lambda=0.001 WSSR=464.564 #1: WSSR=0.90162 lambda=0.0001 d(WSSR)=-463.663 (99.8059%) #2: WSSR=0.736787 lambda=1e-05 d(WSSR)=-0.164833 (18.2818%) #3: WSSR=0.736763 lambda=1e-06 d(WSSR)=-2.45151e-05 (0.00332729%) #4: WSSR=0.736763 lambda=1e-07 d(WSSR)=-3.84524e-11 (5.21909e-09%) Fit converged. Better fit found (WSSR = 0.736763, was 464.564, -99.8414%). 5> info formula in @0 # storage-consumption 14147.4+146.657*x+0.786854*x^2 6> quit bye...](https://image.slidesharecdn.com/cfakepathcapacitymanagementpresentation-090922010104-phpapp01/85/Capacity-Management-from-Flickr-36-320.jpg)

![Stupid Capacity Tricks quick and dirty management DSH http://freshmeat.net/projects/dsh [root@netmon101 ~]# cat group.of.servers www100 www118 dbcontacts3 admin1 admin2](https://image.slidesharecdn.com/cfakepathcapacitymanagementpresentation-090922010104-phpapp01/85/Capacity-Management-from-Flickr-49-320.jpg)
![Stupid Capacity Tricks quick and dirty management [root@netmon101 ~]# dsh -N group.of.servers dsh> date executing 'date' www100: Mon Jun 23 14:14:53 UTC 2008 www118: Mon Jun 23 14:14:53 UTC 2008 dbcontacts3: Mon Jun 23 07:14:53 PDT 2008 admin1: Mon Jun 23 14:14:53 UTC 2008 admin2: Mon Jun 23 14:14:53 UTC 2008 dsh>](https://image.slidesharecdn.com/cfakepathcapacitymanagementpresentation-090922010104-phpapp01/85/Capacity-Management-from-Flickr-50-320.jpg)


![[245] presto 내부구조 파헤치기](https://cdn.slidesharecdn.com/ss_thumbnails/245presto-150915054242-lva1-app6891-thumbnail.jpg?width=640&height=640&fit=bounds)