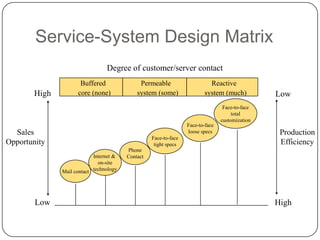
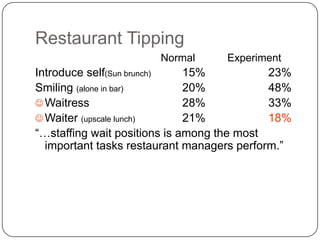
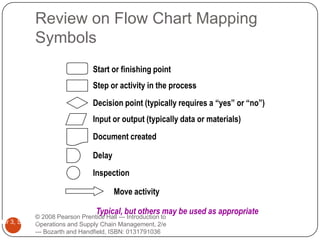
Ch. 4 Product & Service Design
SCM 352 Operations Mgt
Dr. Ron Lembke
How are Services Different?
 Everyone is an expert on services
 What works well for one service provider doesn’t







necessarily carry over to another
Quality of work is not quality of service
“Service package” consists of tangible and intangible
components
Services are experienced, goods are consumed
Mgmt of service involves mktg, personnel
Service encounters mail, phone, F2F
Degree of Customer Contact
 More customer contact, harder to standardize

and control
 Customer influences:
 Time of demand
 Exact nature of service
 Quality (or perceived quality) of service
3 Approaches
 Which is Best?
 Production Line
 Self-Service
 Personal attention
What do People Want?
 Amount of friendliness and helpfulness
 Speed and convenience of delivery
 Price of the service
 Variety of services
 Quality of tangible goods involved

 Unique skills required to provide service
 Level of customization
Service-System Design Matrix
Degree of customer/server contact
High

Buffered
core (none)

Permeable
system (some)

Reactive
system (much)

Low

Face-to-face
total
customization
Face-to-face
loose specs

Sales
Opportunity

Face-to-face
tight specs
Internet &
on-site
Mail contact technology

Low

Production
Efficiency

Phone
Contact

High
Impact of Life Cycle
iTunes

CDs

DVD
Audio

Cassettes
Records
MiniDisc
DAT
8-Tracks

Introduction

Growth

Maturity

Decline
Impact of Life Cycle

Records
DAT
Introduction

Growth

Maturity

Decline
Applying Behavioral Science
 The end is more important to the lasting






impression (Colonoscopy)
Segment pleasure, but combine pain
Let the customer control the process
Follow norms & rituals
Compensation for failures: fix bad product,
apologize for bad service
Restaurant Tipping
Normal

Experiment

Introduce self(Sun brunch)
15%
23%
Smiling (alone in bar)
20%
48%
 Waitress
28%
33%
 Waiter (upscale lunch)
21%
18%
“…staffing wait positions is among the most
important tasks restaurant managers perform.”
Modular Components
 Take advantage of modules: parts or products

previously prepared
 Restaurants: prepared ingredients, assembled to
order
 Suppliers can develop new, interesting products
to use more quickly, cheaply
 Variety is gained by different combinations of
same components
Mass Customization
 Highly customized
 Integrate design, processes, supply network

 Supply components cheaply to production points
 Fast, responsive production, quick delivery
 Higher weight, lower value
Fail-Safing
 “poka-yokes” – Japanese for “avoid mistakes”
 Not possible to do things the wrong way






Indented trays for surgeons
ATMs beep so you don’t forget your card
Pagers at restaurants for when table ready
Airplane bathroom locks turn on lights
Height bars at amusement parks
Blueprinting
Fancy word for making a flow chart
“line of visibility” separates what customers can see
from what they can’t
Flow chart “back office” and “front office” activities
separately.
Review on Flow Chart Mapping
Symbols
Start or finishing point
Step or activity in the process
Decision point (typically requires a “yes” or “no”)
Input or output (typically data or materials)
Document created
Delay
Inspection
Move activity
Typical, but others may be used as appropriate

© 2008 Pearson Prentice Hall --- Introduction to
pter 3, Slide 20
Operations and Supply Chain Management, 2/e
--- Bozarth and Handfield, ISBN: 0131791036
Our Flow Chart Example
Dealer
Faxes
Order

Paper
Order
Created
4% of
orders lost

Order Sits
In Fax
In Box
0 to 4 hours
2 hours on average

Order Sits
In Clerk’s
In Box

Internal Mail
Delivers Fax

0.5 to 1.5 hours
1 hour on average
1% of orders lost

0 to 2 hours
1 hour on average

Clerk
Processes
Order
5 minutes

10 to 45 minutes
20 minutes on average

Dealer
Receives
Order

Transport Firm
Delivers Order

1 to 3 hours
2 hours on average
No history of lost,
damaged, or incorrect
deliveries

Inspector
Checks
Order

Worker
Picks
Order

2 minutes
0.5% of orders incorrect

© 2008 Pearson Prentice Hall --- Introduction to
pter 3, Slide 21
Operations and Supply Chain Management, 2/e
--- Bozarth and Handfield, ISBN: 0131791036

YES

Is Item
In Stock?
NO
Clerk Notifies
Dealer and
Passes Order
On to Plant
Group
 Group yourselves into three (3)
 Design a service and create a flow chart

describing the flow of the service you will
introduce. (Use proper flowchart symbols)
 Submit this on Jan. 16, 2013 (short bondpaper)

Buspro infosheet4

  • 1.
    Ch. 4 Product& Service Design SCM 352 Operations Mgt Dr. Ron Lembke
  • 2.
    How are ServicesDifferent?  Everyone is an expert on services  What works well for one service provider doesn’t      necessarily carry over to another Quality of work is not quality of service “Service package” consists of tangible and intangible components Services are experienced, goods are consumed Mgmt of service involves mktg, personnel Service encounters mail, phone, F2F
  • 3.
    Degree of CustomerContact  More customer contact, harder to standardize and control  Customer influences:  Time of demand  Exact nature of service  Quality (or perceived quality) of service
  • 4.
    3 Approaches  Whichis Best?  Production Line  Self-Service  Personal attention
  • 5.
    What do PeopleWant?  Amount of friendliness and helpfulness  Speed and convenience of delivery  Price of the service  Variety of services  Quality of tangible goods involved  Unique skills required to provide service  Level of customization
  • 6.
    Service-System Design Matrix Degreeof customer/server contact High Buffered core (none) Permeable system (some) Reactive system (much) Low Face-to-face total customization Face-to-face loose specs Sales Opportunity Face-to-face tight specs Internet & on-site Mail contact technology Low Production Efficiency Phone Contact High
  • 7.
    Impact of LifeCycle iTunes CDs DVD Audio Cassettes Records MiniDisc DAT 8-Tracks Introduction Growth Maturity Decline
  • 8.
    Impact of LifeCycle Records DAT Introduction Growth Maturity Decline
  • 9.
    Applying Behavioral Science The end is more important to the lasting     impression (Colonoscopy) Segment pleasure, but combine pain Let the customer control the process Follow norms & rituals Compensation for failures: fix bad product, apologize for bad service
  • 10.
    Restaurant Tipping Normal Experiment Introduce self(Sunbrunch) 15% 23% Smiling (alone in bar) 20% 48%  Waitress 28% 33%  Waiter (upscale lunch) 21% 18% “…staffing wait positions is among the most important tasks restaurant managers perform.”
  • 11.
    Modular Components  Takeadvantage of modules: parts or products previously prepared  Restaurants: prepared ingredients, assembled to order  Suppliers can develop new, interesting products to use more quickly, cheaply  Variety is gained by different combinations of same components
  • 12.
    Mass Customization  Highlycustomized  Integrate design, processes, supply network  Supply components cheaply to production points  Fast, responsive production, quick delivery  Higher weight, lower value
  • 13.
    Fail-Safing  “poka-yokes” –Japanese for “avoid mistakes”  Not possible to do things the wrong way      Indented trays for surgeons ATMs beep so you don’t forget your card Pagers at restaurants for when table ready Airplane bathroom locks turn on lights Height bars at amusement parks
  • 19.
    Blueprinting Fancy word formaking a flow chart “line of visibility” separates what customers can see from what they can’t Flow chart “back office” and “front office” activities separately.
  • 20.
    Review on FlowChart Mapping Symbols Start or finishing point Step or activity in the process Decision point (typically requires a “yes” or “no”) Input or output (typically data or materials) Document created Delay Inspection Move activity Typical, but others may be used as appropriate © 2008 Pearson Prentice Hall --- Introduction to pter 3, Slide 20 Operations and Supply Chain Management, 2/e --- Bozarth and Handfield, ISBN: 0131791036
  • 21.
    Our Flow ChartExample Dealer Faxes Order Paper Order Created 4% of orders lost Order Sits In Fax In Box 0 to 4 hours 2 hours on average Order Sits In Clerk’s In Box Internal Mail Delivers Fax 0.5 to 1.5 hours 1 hour on average 1% of orders lost 0 to 2 hours 1 hour on average Clerk Processes Order 5 minutes 10 to 45 minutes 20 minutes on average Dealer Receives Order Transport Firm Delivers Order 1 to 3 hours 2 hours on average No history of lost, damaged, or incorrect deliveries Inspector Checks Order Worker Picks Order 2 minutes 0.5% of orders incorrect © 2008 Pearson Prentice Hall --- Introduction to pter 3, Slide 21 Operations and Supply Chain Management, 2/e --- Bozarth and Handfield, ISBN: 0131791036 YES Is Item In Stock? NO Clerk Notifies Dealer and Passes Order On to Plant
  • 22.
    Group  Group yourselvesinto three (3)  Design a service and create a flow chart describing the flow of the service you will introduce. (Use proper flowchart symbols)  Submit this on Jan. 16, 2013 (short bondpaper)