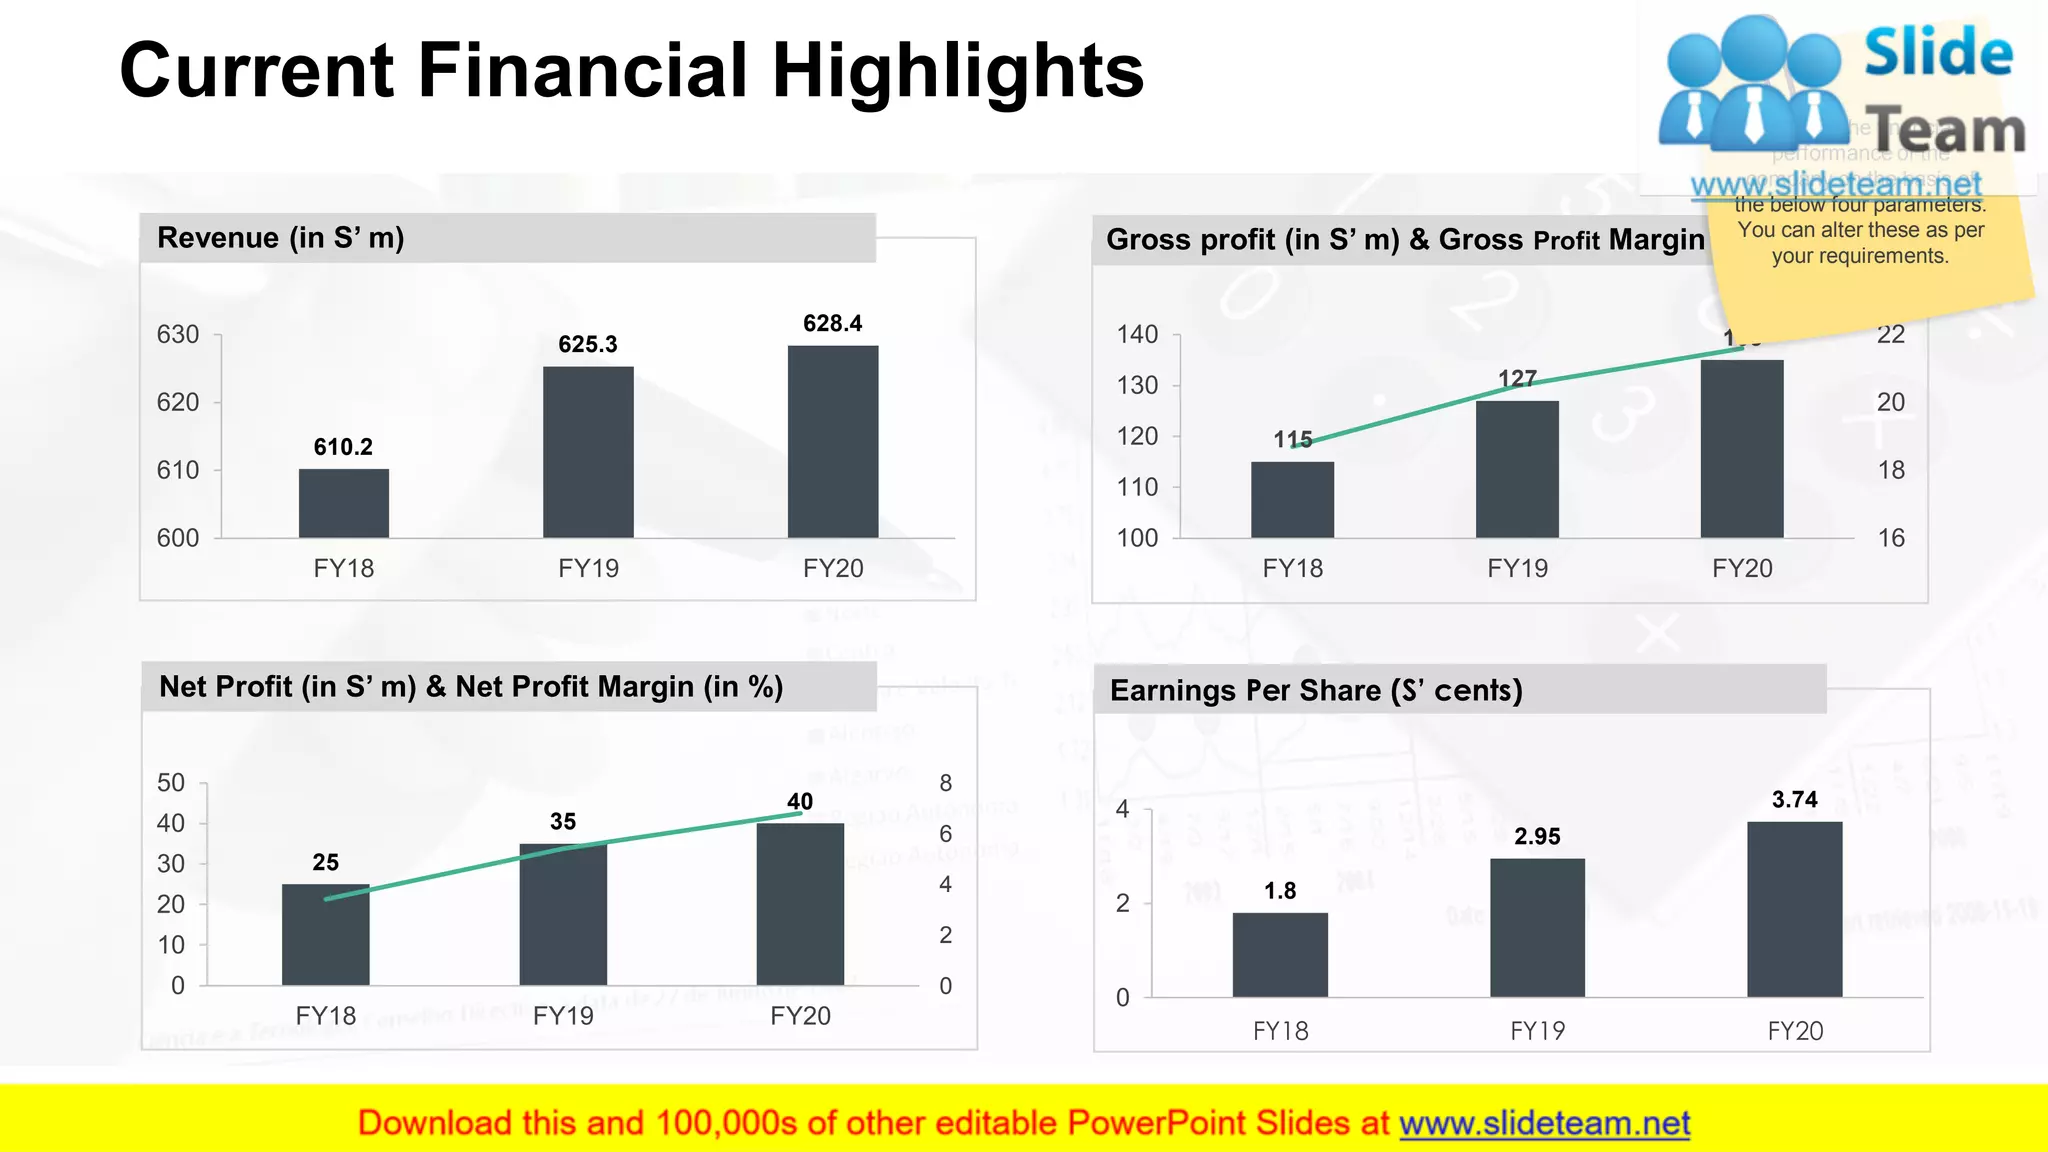
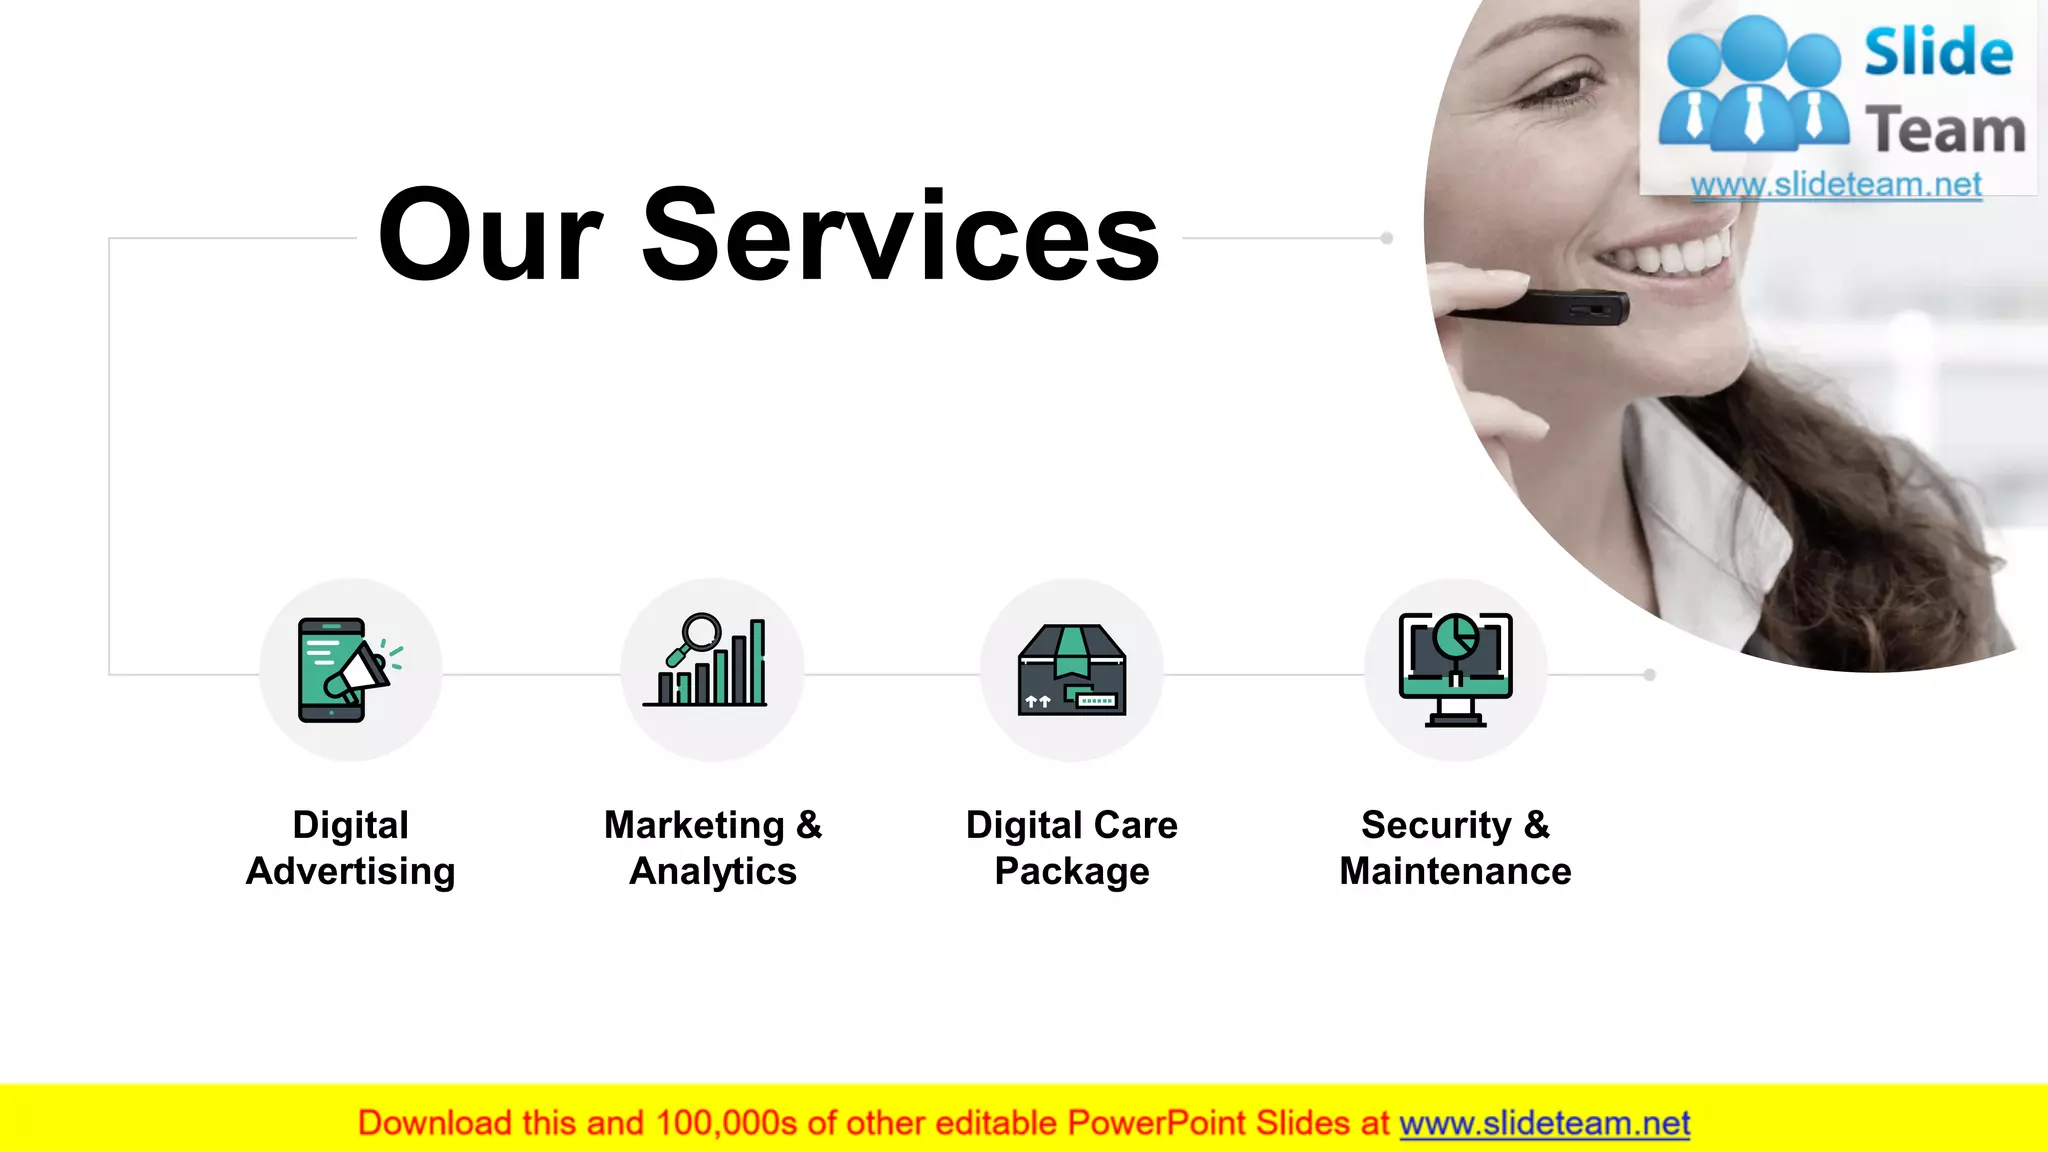
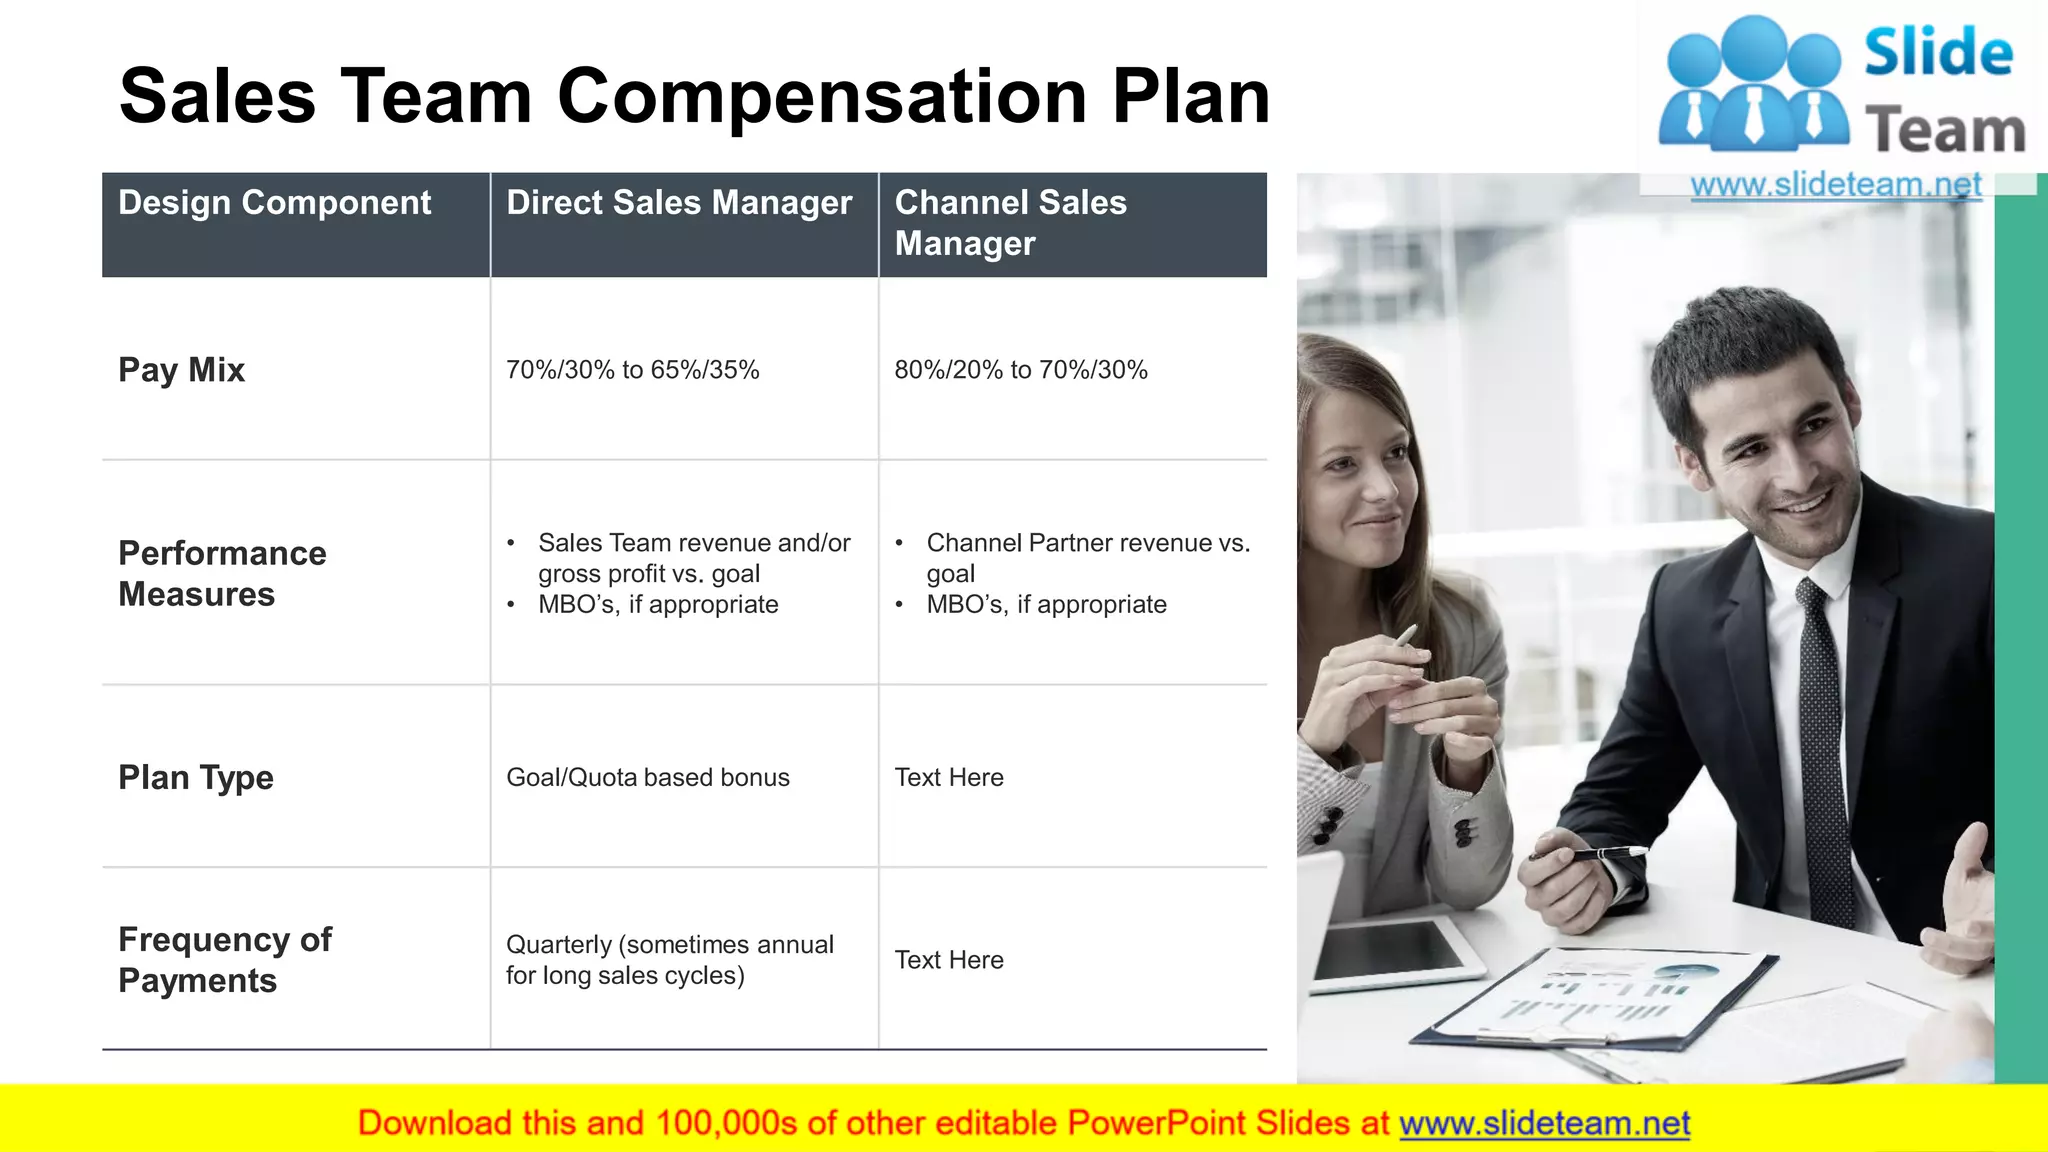
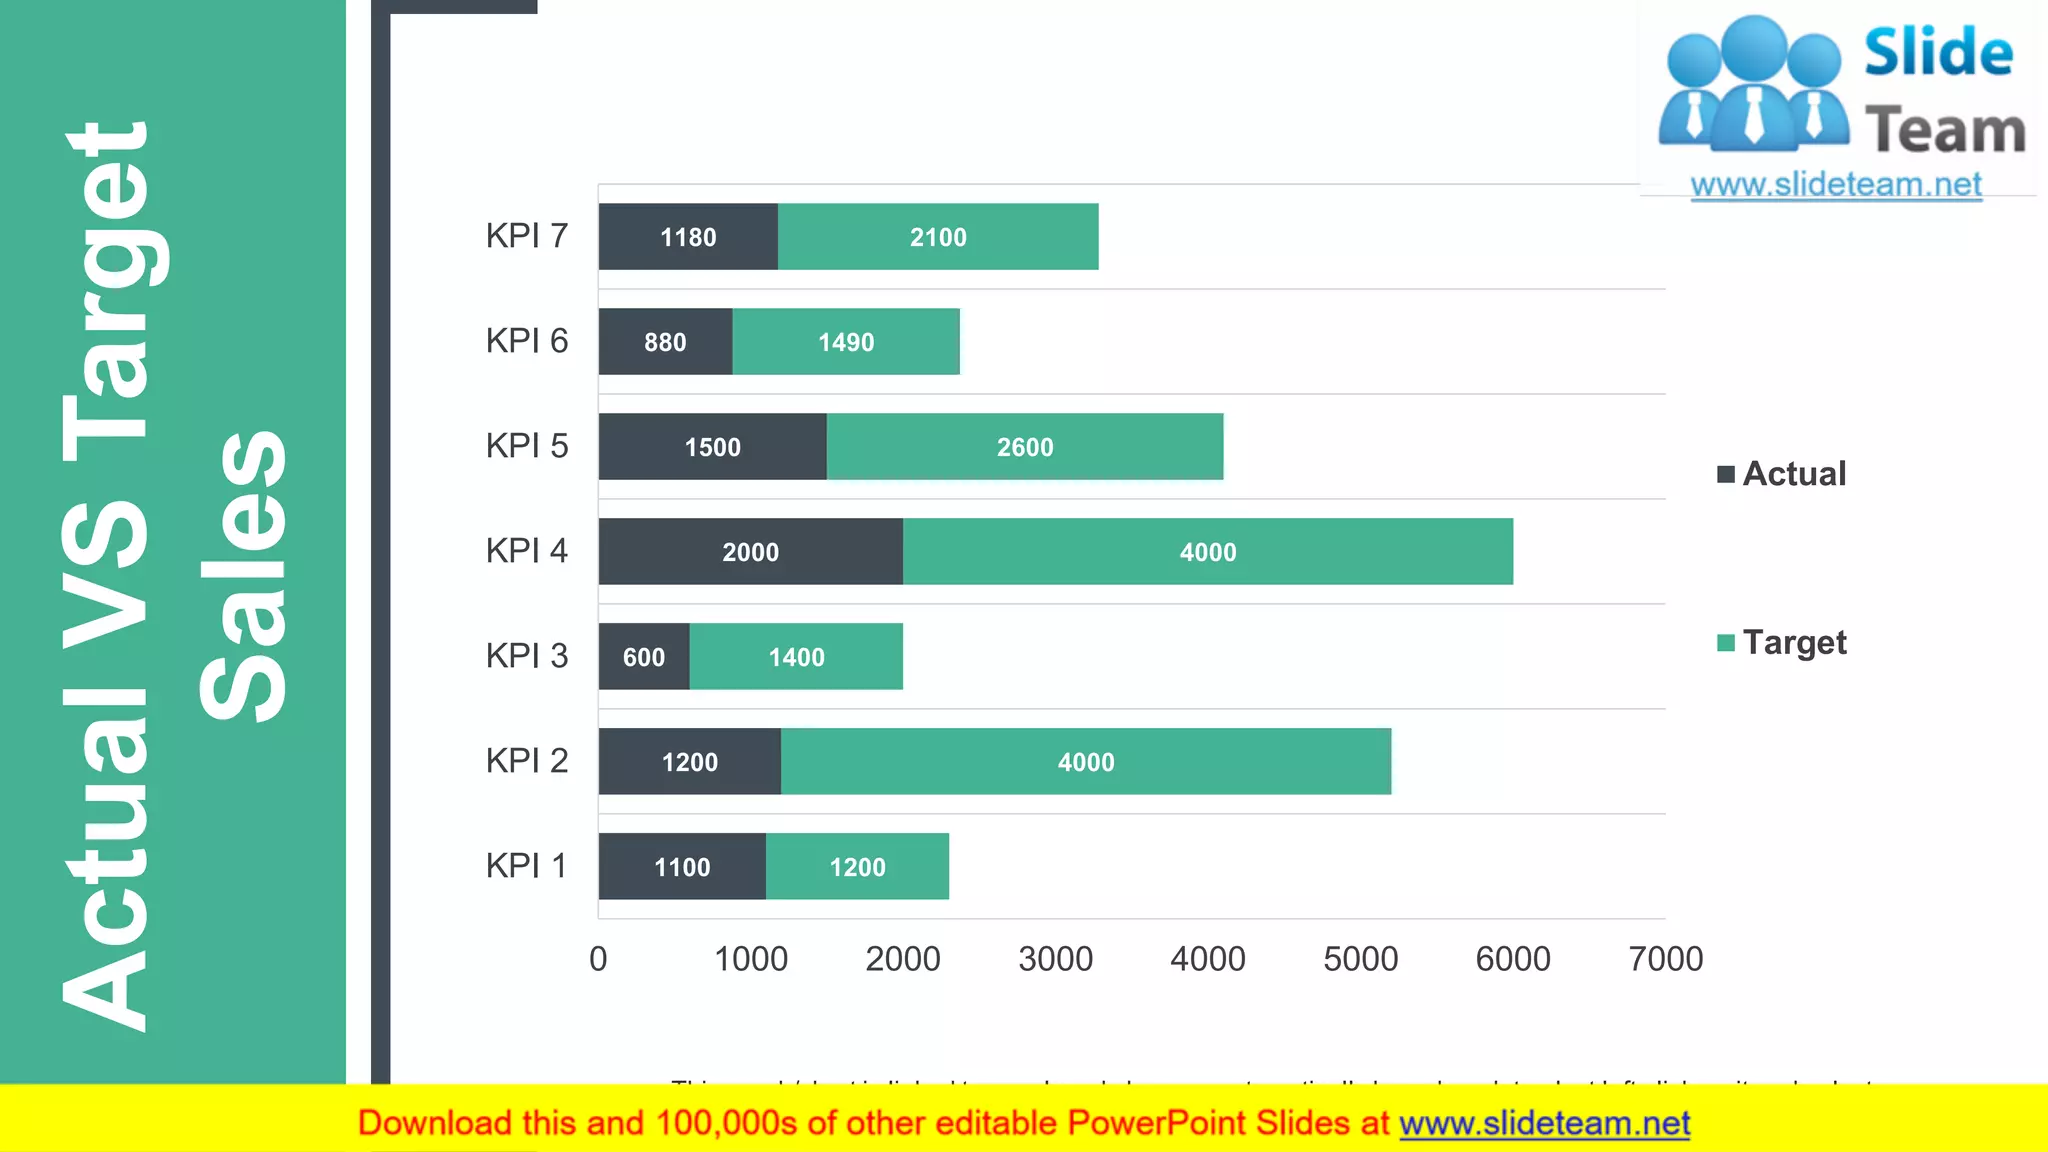
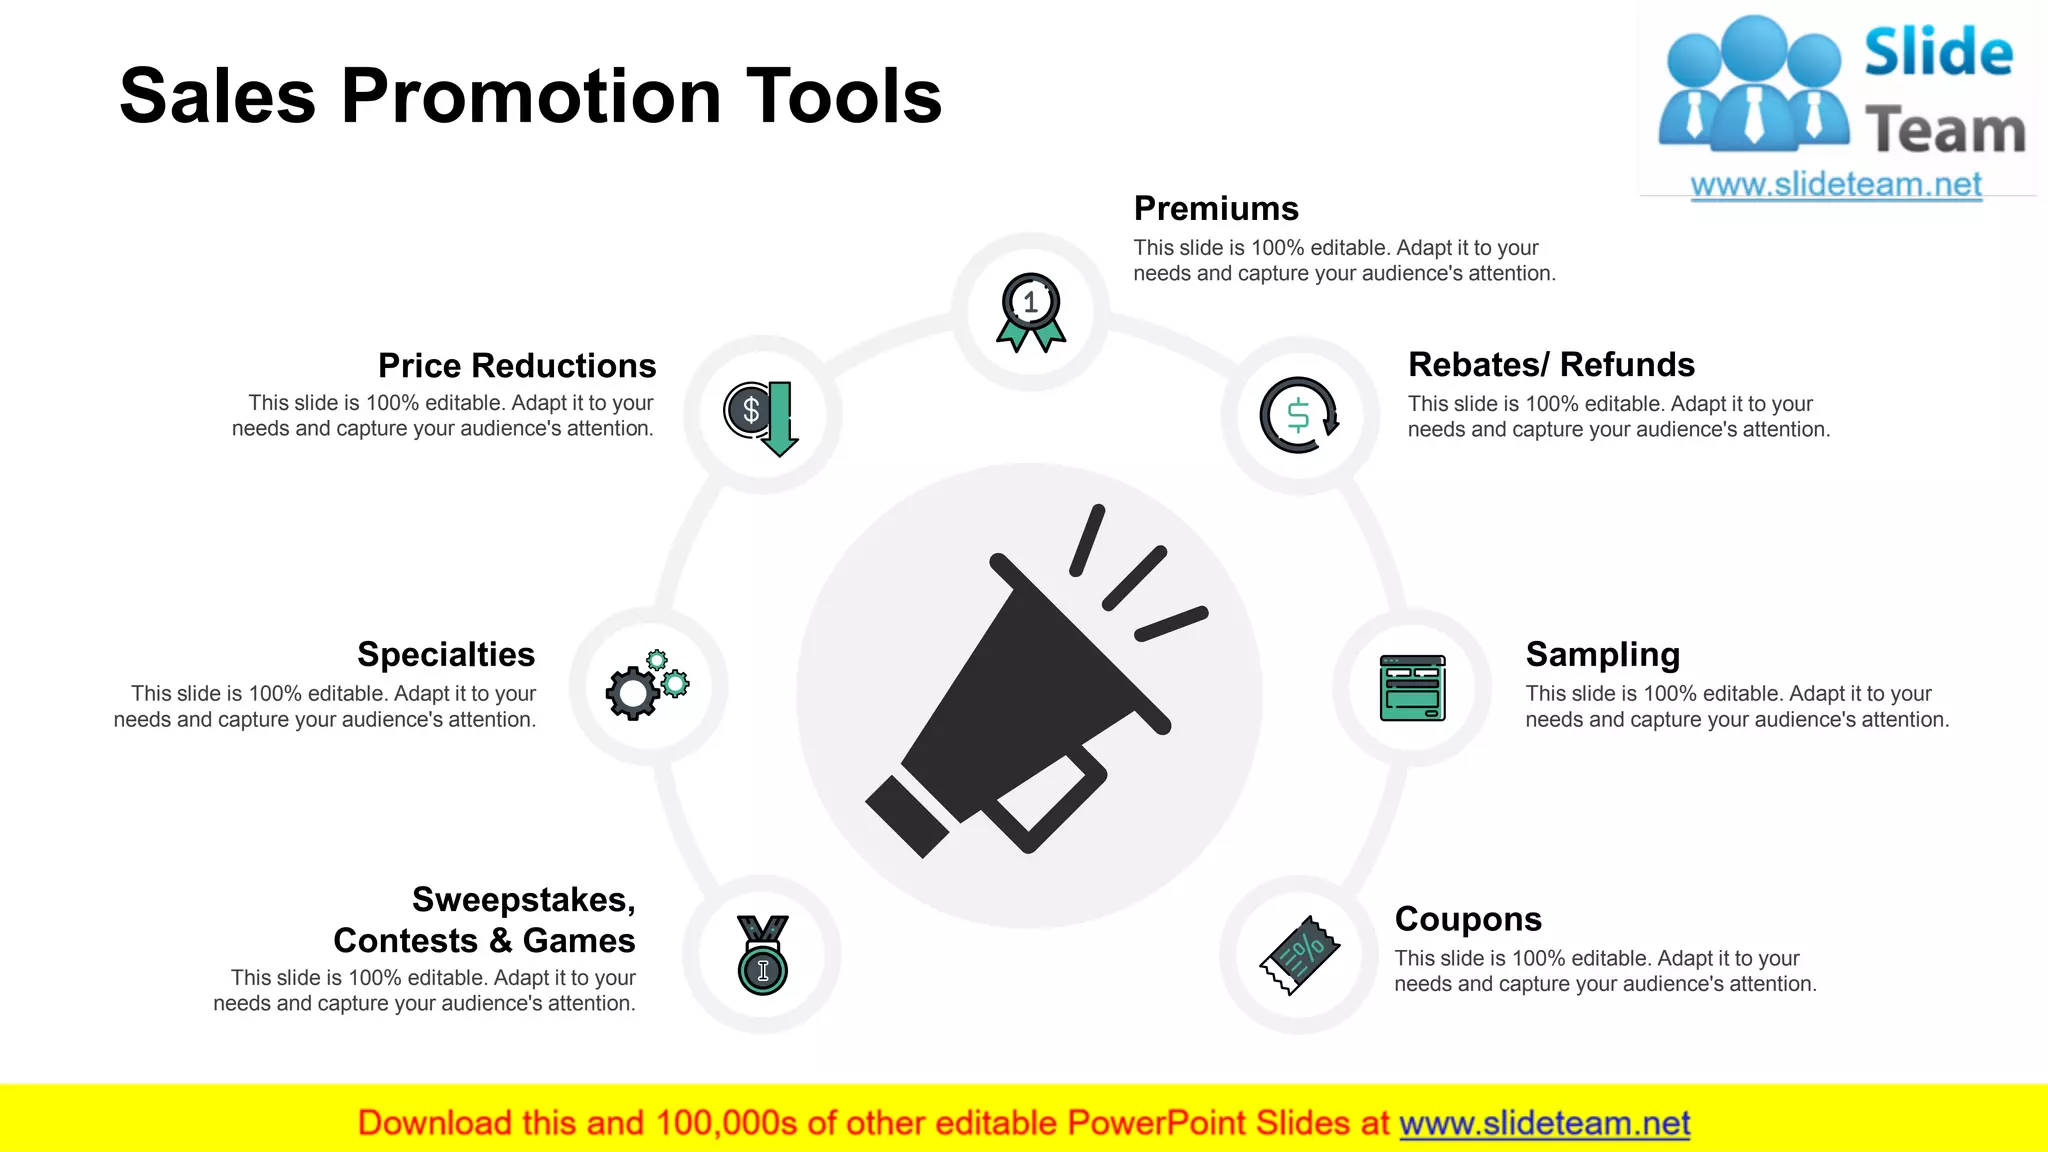
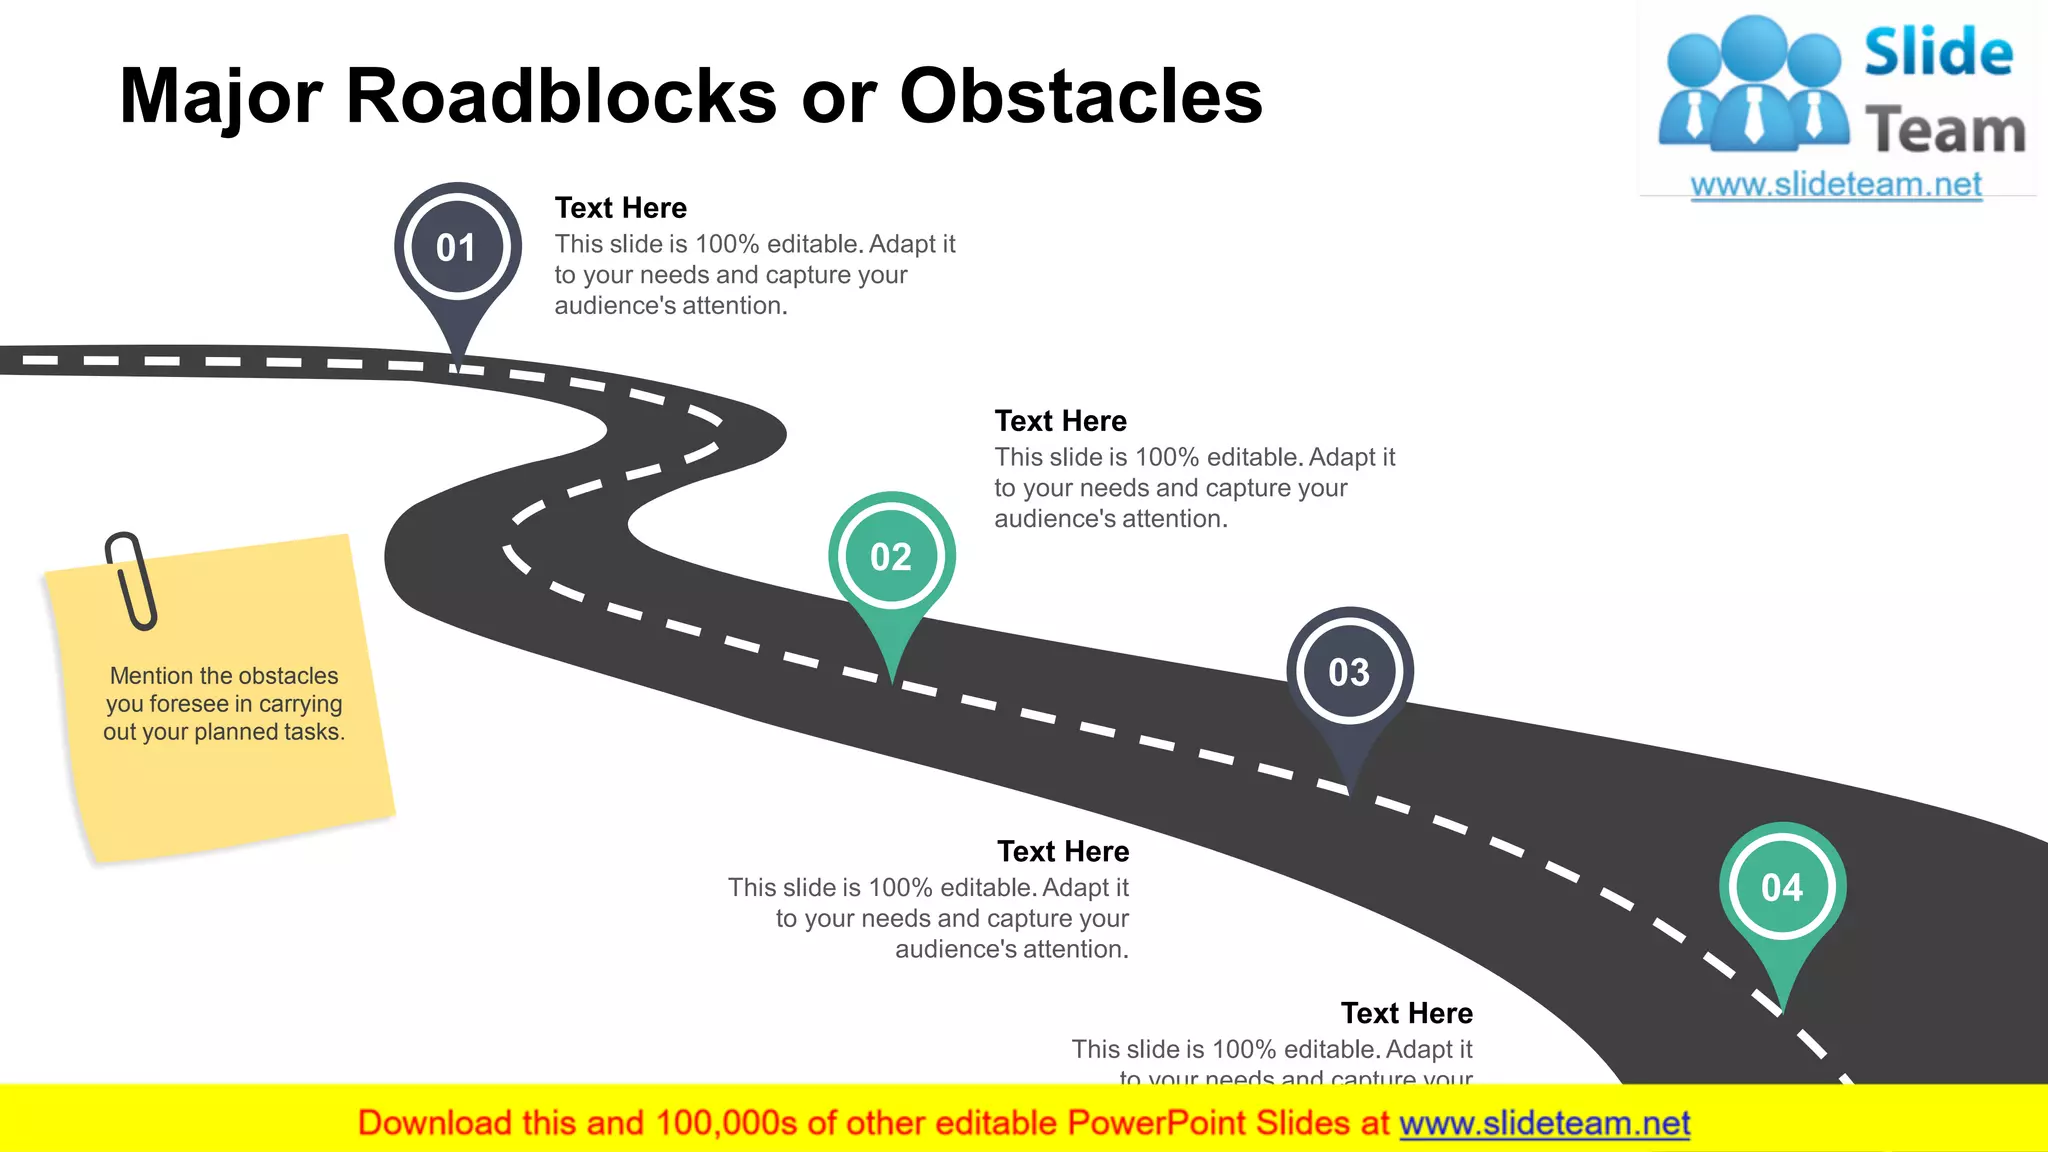
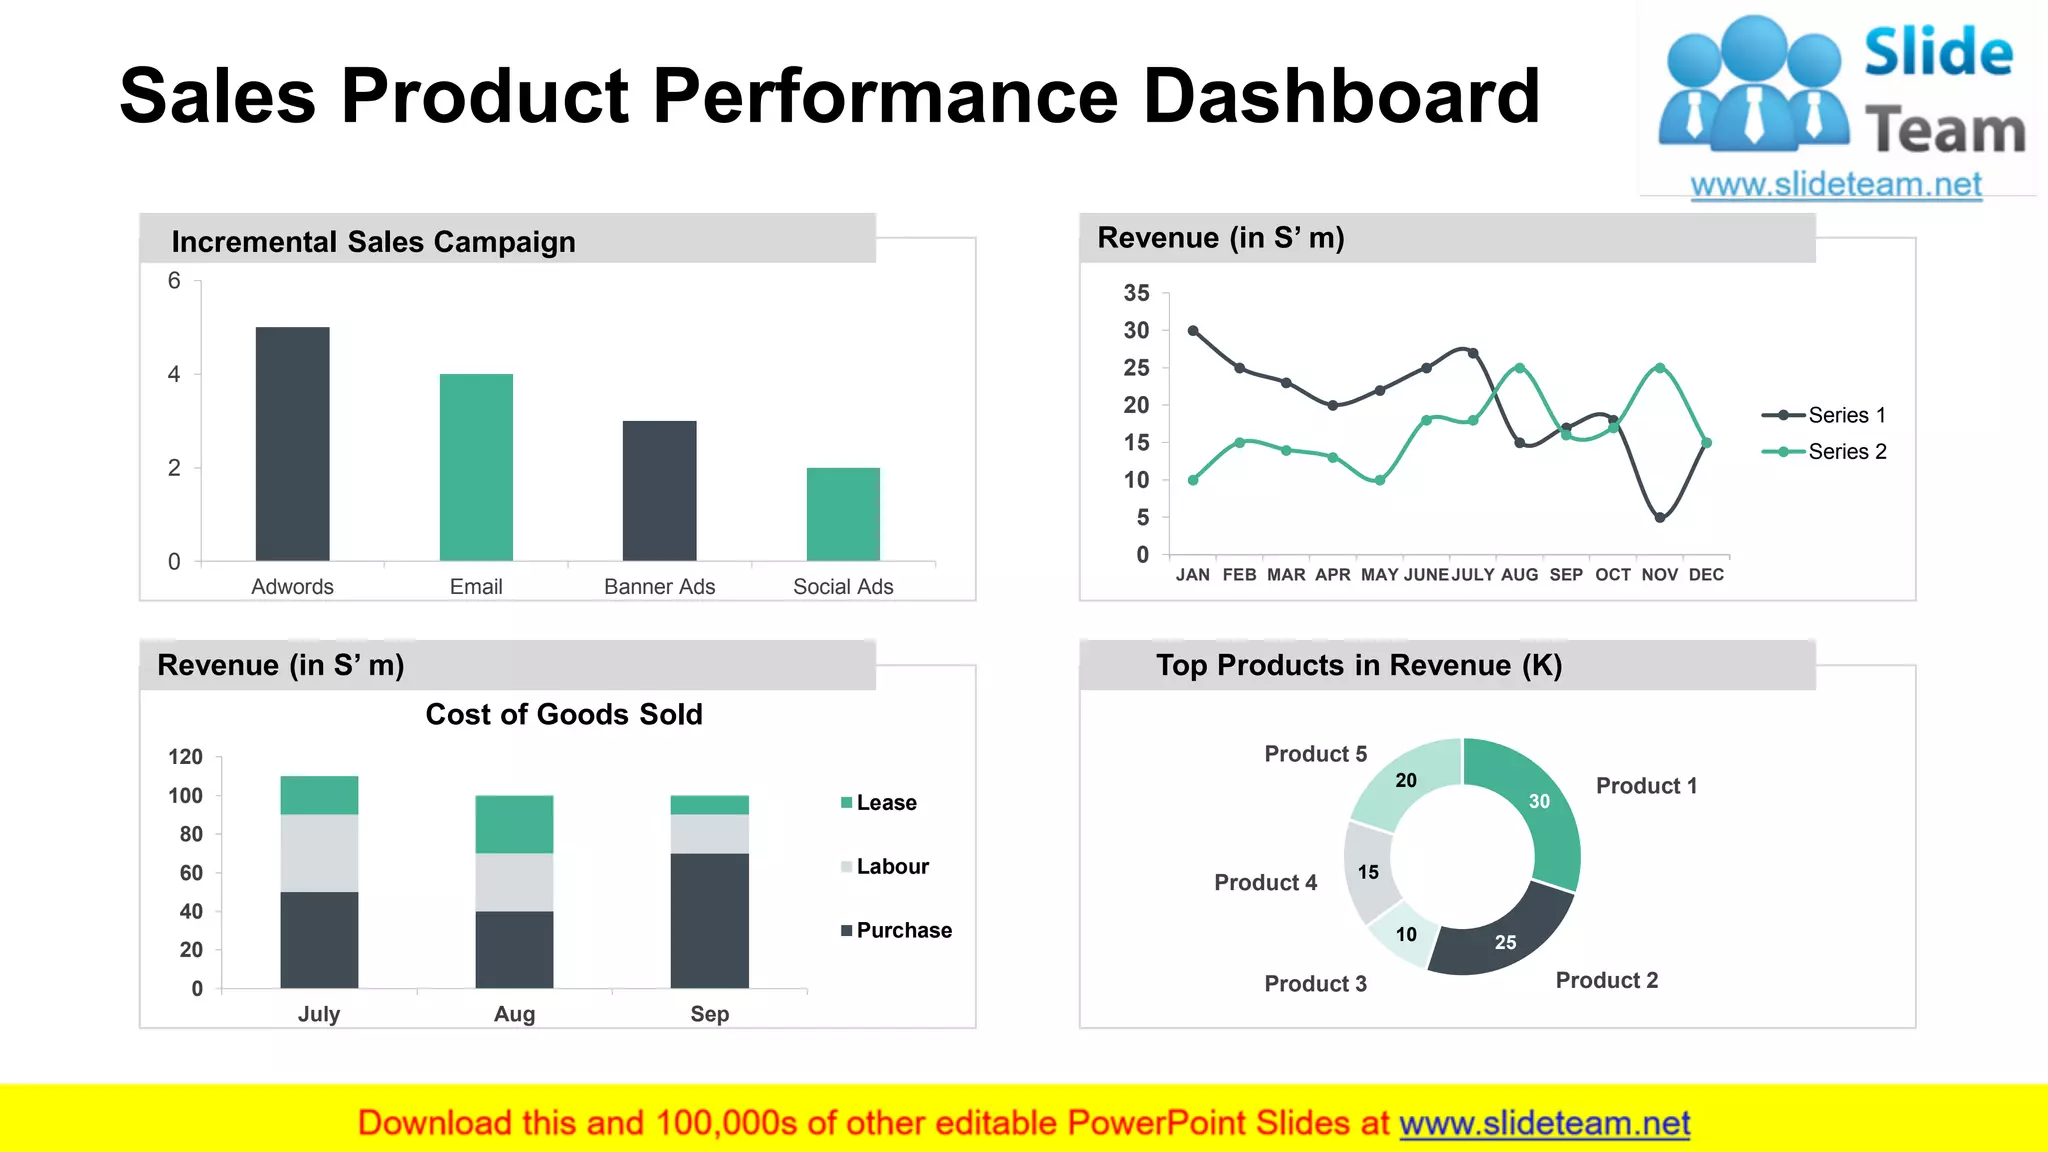
- The document appears to be a sales review presentation for a company. It includes sections on current financial highlights, products offered, services, sales team compensation plan, upcoming projects, sales vs targets, sales promotion tools, roadblocks, and a sales performance dashboard.
- The current financial highlights section shows increasing annual revenue, earnings per share, gross profit, and net profit from FY2018 to FY2020.
- The products offered section lists 4 editable slides to describe the company's products or services.
- Various charts and graphs are included to visualize sales data and compare actual performance to targets.
3. 3
Current Financial Highlights
Revenue (in S’ m)
610.2
625.3
628.4
600
610
620
630
FY18 FY19 FY20
115
127
135
16
18
20
22
100
110
120
130
140
FY18 FY19 FY20
25
35
40
0
2
4
6
8
0
10
20
30
40
50
FY18 FY19 FY20
Earnings Per Share (S’ cents)
1.8
2.95
3.74
0
2
4
FY18 FY19 FY20
Gross profit (in S’ m) & Gross Profit Margin (in %)
Net Profit (in S’ m) & Net Profit Margin (in %)
Specify the financial
performance of the
company on the basis of
the below four parameters.
You can alter these as per
your requirements.
This graph/chart is linked to excel, and changes automatically based on data. Just left click on it and select “Edit Data”.
4. Product 01
This slide is 100%
editable. Adapt it your
needs and capture your
audience’s attention.
Product 02
This slide is 100%
editable. Adapt it your
needs and capture your
audience’s attention.
Product 04
This slide is 100%
editable. Adapt it your
needs and capture your
audience’s attention.
Product 03
This slide is 100%
editable. Adapt it your
needs and capture your
audience’s attention.
4
Products Offering
6. 6
Sales Team Compensation Plan
Design Component Direct Sales Manager Channel Sales
Manager
Pay Mix 70%/30% to 65%/35% 80%/20% to 70%/30%
Performance
Measures
• Sales Team revenue and/or
gross profit vs. goal
• MBO’s, if appropriate
• Channel Partner revenue vs.
goal
• MBO’s, if appropriate
Plan Type Goal/Quota based bonus Text Here
Frequency of
Payments
Quarterly (sometimes annual
for long sales cycles)
Text Here
This slide is 100% editable. Adapt it your needs and capture your audience’s attention.
7. Designation
This slide is 100% editable. Adapt
it to your needs and capture your
audience's attention.
Name Here
Designation
This slide is 100% editable. Adapt
it to your needs and capture your
audience's attention.
Name Here
Designation
This slide is 100% editable. Adapt
it to your needs and capture your
audience's attention.
Name Here
7
Meet
Our Team
8. This slide is 100%
editable. Adapt it to your
needs and capture your
audience's attention.
This slide is 100%
editable. Adapt it to your
needs and capture your
audience's attention.
This slide is 100%
editable. Adapt it to your
needs and capture your
audience's attention.
This slide is 100%
editable. Adapt it to your
needs and capture your
audience's attention.
This slide is 100%
editable. Adapt it to your
needs and capture your
audience's attention.
8
Upcoming Projects
10. Sales Promotion Tools
Coupons
This slide is 100% editable. Adapt it to your
needs and capture your audience's attention.
Sampling
This slide is 100% editable. Adapt it to your
needs and capture your audience's attention.
Rebates/ Refunds
This slide is 100% editable. Adapt it to your
needs and capture your audience's attention.
Sweepstakes,
Contests & Games
This slide is 100% editable. Adapt it to your
needs and capture your audience's attention.
Specialties
This slide is 100% editable. Adapt it to your
needs and capture your audience's attention.
Premiums
This slide is 100% editable. Adapt it to your
needs and capture your audience's attention.
Price Reductions
This slide is 100% editable. Adapt it to your
needs and capture your audience's attention.
10
11. Major Roadblocks or Obstacles
Mention the obstacles
you foresee in carrying
out your planned tasks.
01
02
03
04
This slide is 100% editable. Adapt it
to your needs and capture your
audience's attention.
Text Here
This slide is 100% editable. Adapt it
to your needs and capture your
audience's attention.
Text Here
This slide is 100% editable. Adapt it
to your needs and capture your
audience's attention.
Text Here
This slide is 100% editable. Adapt it
to your needs and capture your
audience's attention.
Text Here
11
12. Sales Product Performance Dashboard
12This graph/chart is linked to excel, and changes automatically based on data. Just left click on it and select “Edit Data”.
Revenue (in S’ m)
Revenue (in S’ m)
0
2
4
6
Adwords Email Banner Ads Social Ads
Incremental Sales Campaign
30
2510
15
20
Top Products in Revenue (K)
Product 1
Product 2Product 3
Product 4
Product 5
0
5
10
15
20
25
30
35
JAN FEB MAR APR MAY JUNEJULY AUG SEP OCT NOV DEC
Series 1
Series 2
0
20
40
60
80
100
120
July Aug Sep
Cost of Goods Sold
Lease
Labour
Purchase
15. 15
Our
Mission
This slide is 100%
editable. Adapt it to your
needs and capture your
audience's attention.
Vision
This slide is 100%
editable. Adapt it to your
needs and capture your
audience's attention.
Mission
This slide is 100%
editable. Adapt it to your
needs and capture your
audience's attention.
Goal
16. Financial 01
This slide is 100% editable. Adapt it
to your needs and capture your
audience's attention.
Financial 03
This slide is 100% editable. Adapt it
to your needs and capture your
audience's attention.
This slide is 100% editable. Adapt it
to your needs and capture your
audience's attention.
Financial 02
16
Financials
17. 17
About
Us
Target Audiences
This slide is 100% editable. Adapt it
to your needs and capture your
audience's attention.
This slide is 100% editable. Adapt it
to your needs and capture your
audience's attention.
Preferred By Many
Values Client
This slide is 100% editable. Adapt it
to your needs and capture your
audience's attention.
18. Comparison
50%
40% 30%
18
This slide is 100% editable. Adapt it
to your needs and capture your
audience's attention.
LinkedIn By Users
This slide is 100% editable. Adapt it
to your needs and capture your
audience's attention.
Facebook By Users
This slide is 100% editable. Adapt it
to your needs and capture your
audience's attention.
Twitter By Users
19. This slide is 100% editable. Adapt it to your needs
and capture your audience's attention.
Text Here
This slide is 100% editable. Adapt it to your needs
and capture your audience's attention.
Text Here
Bulb or Idea
19
20. Stacked Column
80 100 120 140
180 200
170
206
230
260
270 250
0
50
100
150
200
250
300
350
400
450
500
550
600
2014 2015 2016 2017 2018 2019
Product 01
Product 02
Product 03
This graph/chart is linked to excel, and changes automatically based on data. Just left click on it and select “Edit Data”. 20
21. ClusteredColumn
0
10
20
30
40
50
60
70
80
90
100
Q1 Q2 Q3 Q4
SalesinPercentage(%)2019
2019
Product 01 Product 02 Product 03
This graph/chart is linked to excel, and changes automatically based on data. Just left click on it and select
“Edit Data”.
21